Why have data science dashboard templates emerged as critical assets in today's business environment? Visualizing and understanding complex data sets instantly is crucial for informed decision-making in a domain where data reigns supreme. Data science dashboards allow businesses to unravel trends, patterns, and insights, converting unprocessed data into strategic initiatives. Beyond mere data presentation, these dashboards enable businesses to leverage their data resources for expansion and innovation.
Looking to transform data into decisions? Check out our Top 10 Data Science Templates To Enable Better Decision-Making now with a click here!
The PowerPoint Presentations designed by SlideTeam set a new standard, featuring top-tier data science dashboard templates crucial for contemporary business functions. Each PPT Layout is engineered for the modern corporate world, blending sophisticated design with practical features to demystify complex data.
Let’s explore!
Template 1: Data Science Dashboard for Business Evaluation
This PowerPoint Slide presents a dynamic dashboard leveraging data science to represent critical business metrics visually. Get into detailed analyses of Product Availability, Business Performance, Product Quality, and Equipment Efficiency, all brought to life through engaging graphical elements. Additionally, this PPT Set features a detailed breakdown of annual product costs, including product name, quantity produced, and target quantity, offering a clear, visual insight into production metrics. Ideal for business managers seeking to harness the power of data science for strategic decision-making, this PPT Preset is your gateway to a deeper understanding of your business operations and opportunities for growth. Download this PPT Preset from the link below!
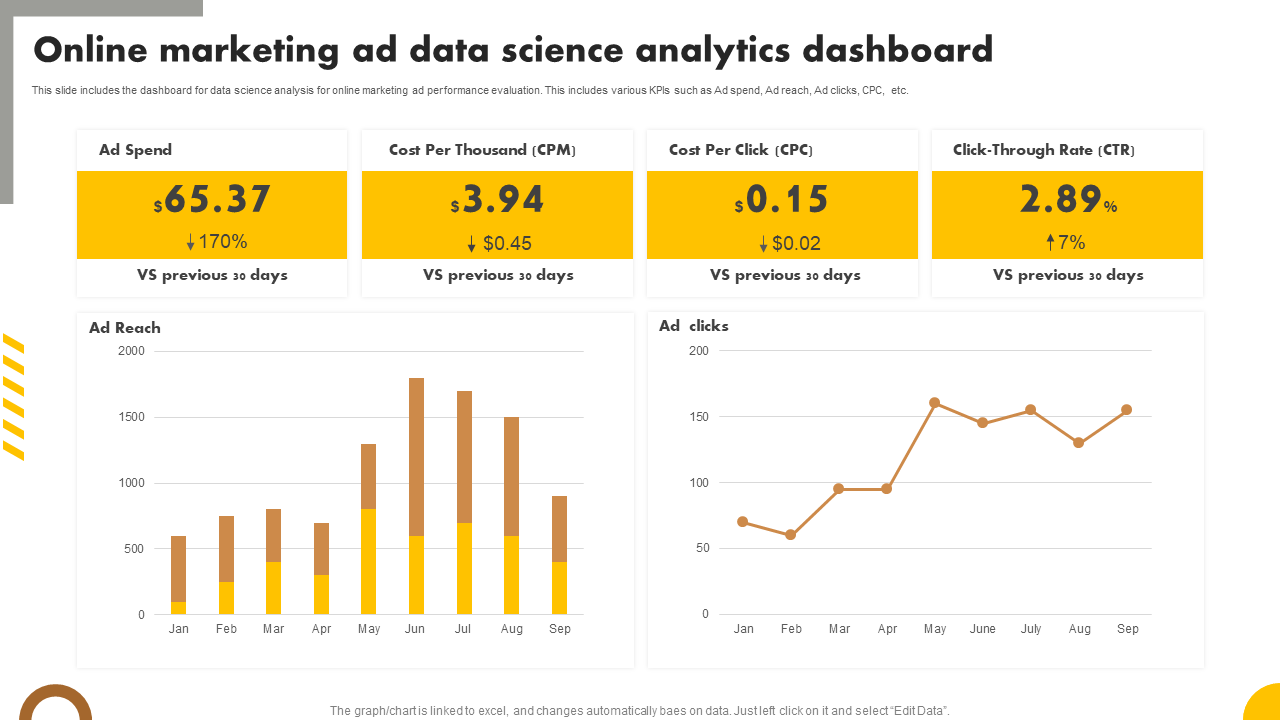
Template 2: Online Marketing Ad Data Science Analytics Dashboard
This PPT Template dashboard brings essential KPIs, including Ad Spend, Ad Reach, and Ad Clicks, along with Cost Per Click (CPC) and Click-Through Rate (CTR), providing a detailed analysis of your advertising initiatives. Each topic is presented with clarity, from the allocation of budgets in Ad spending to the expansive scope of Ad Reach and the engagement metrics of Ad Clicks. Scout into the economics of your campaigns with CPC insights and gauge audience interaction through CTR. Enhanced with graphical representations, this PPT Theme dashboard visualizes Ad Reach and Ad Clicks and bridges the gap between complex data and strategic marketing decisions. Get this PPT Layout today!
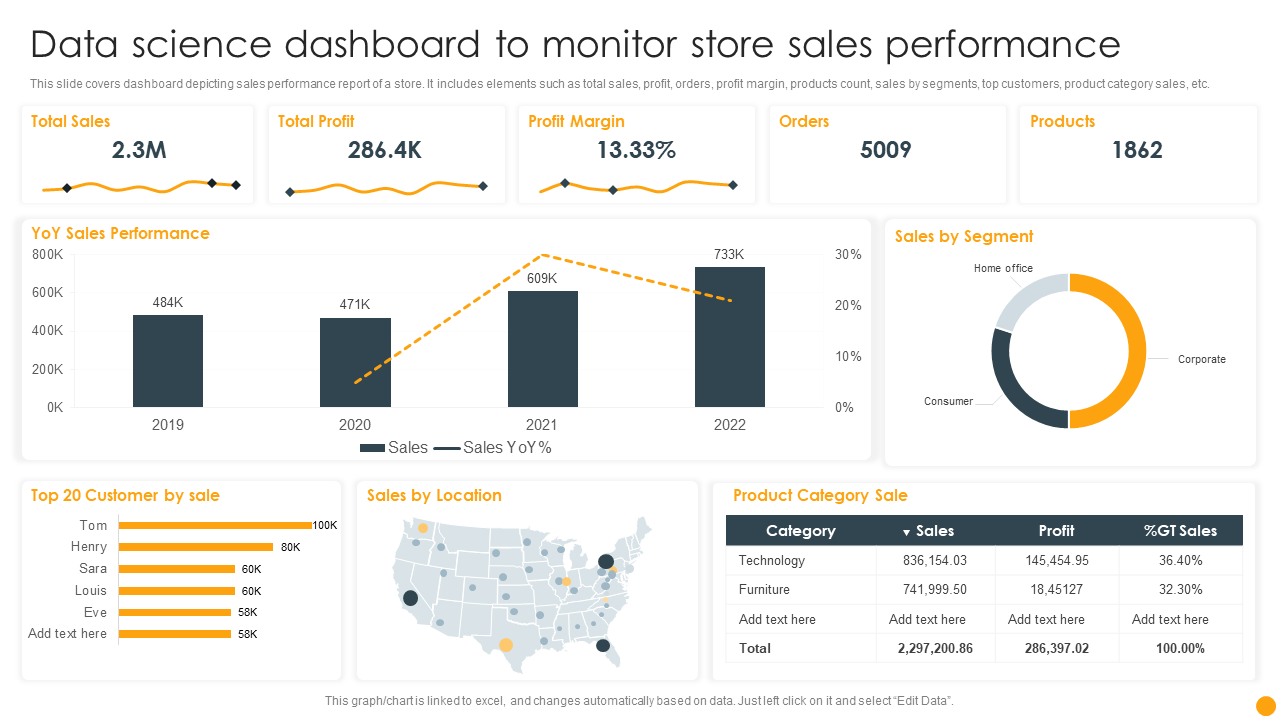
Template 3: Data Science Dashboard Snapshot To Monitor Store Sales Performance
This PowerPoint Presentation dashboard outlines crucial elements such as Total Sales, delineating revenue streams and Profit, and highlighting financial gains. It explores Orders, showcasing transaction volumes and Profit Margin, revealing the efficiency of sales operations. This PPT Deck elaborates on product count, offering insights into inventory and Sales by Segments and identifying consumer demographics. Further, the PPT Layout accentuates Top Customers, focusing on valuable clientele and Product Category Sales, categorizing revenue sources. It extends to Sales Performance, evaluating overall achievements, Sales by Location, pinpointing geographical strengths, and concludes with an analysis of Top Customers by Sales and Product Category Sales, providing a granular view of market trends.
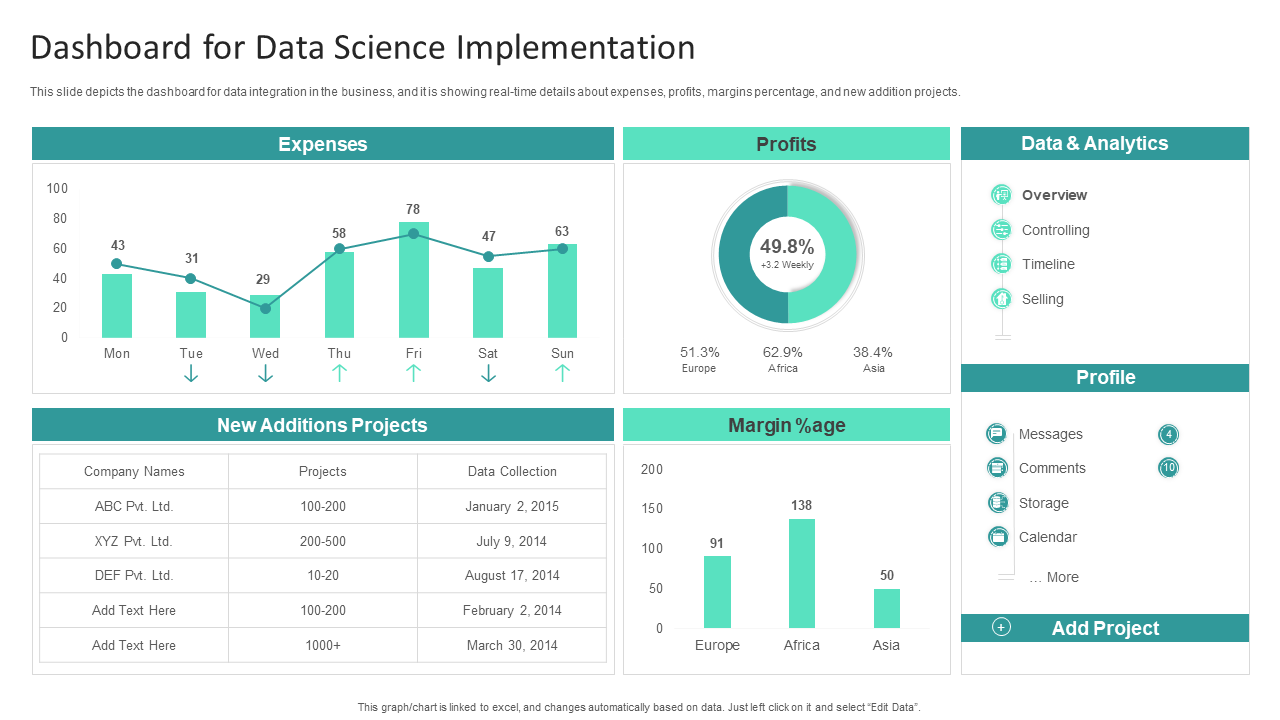
Template 4: Dashboard for Data Science Implementation Information Studies
This presentation slide details essential business indicators, including Expenses, outlining financial outlays and profits, marking net gains and Margin %age, and showing profitability ratios. This PPT Presentation also covers Data & Analytics, offering insights into analytical efforts and New Addition Projects, highlighting upcoming ventures. In this PPT Layout, each section, from financial metrics like Expenses and Profits to strategic aspects such as Margin Percentage and forward-looking New Addition Projects, is presented to enhance discussion on Implementation, Dashboard use, and Business strategies, making it invaluable for decision-makers. Get it today!
Conclusion
Data science professionals stand to gain significantly from this valuable data science dashboard PPT Templates by leveraging advanced visualization and analytical capabilities tailored for complex data environments. These PPT Slides facilitate extracting meaningful insights through sophisticated dashboard designs highlighting key performance indicators, trends, and patterns essential for predictive analytics and strategic decision-making.
Moreover, these templates support real-time data integration, enabling dynamic metrics tracking and fostering an agile response to market changes or internal performance shifts. This adaptability ensures that data science teams maintain a competitive edge by staying proactive and informed. Get these premium templates to enhance your data science projects, transform data into practical insights, and drive your business toward success.
What's more?
Ready to revolutionize your analytics approach? Explore our Top 10 Data Science Framework Templates with Examples and Samples now!
Seeking a breakthrough in your data analysis? Unveil our Top 10 Data Science Templates with Samples and Examples!


 Customer Reviews


