With an experienced team, practical strategies, and result-oriented branding techniques, big brands and startups are achieving targeted sales. Still, the challenges begin when they cannot assess their records. Creating multiple sheets and records becomes tedious and increases the chances of errors and inaccuracy.
Slide Team has analyzed this challenge extensively, bringing an effective solution to your service. Our experienced team has crafted visually appealing and result-oriented templates where you can record, research, and compare your sales data graphically. This would not only help your entire team to evaluate sales records in one place but also help you to present the graphical data to your investors and stakeholders.
These simple and editable sales graph templates are perfect for tracking and displaying your sales KPIs since they simplify complex sales target data into clear visual representations. By utilizing these templates, multiple client sales comparisons, different months' sales for different regions, and numerous product sales records could be easily assessed and presented monthly, quarterly, and annually.
These must-have templates provide all the details you need about your monthly sales, revenues, client base, and company's status in the industry. The sales graph displays your sales during the specified time frame.
With the help of our exclusive sales graph templates, improve your graphics and analyze sales records with the utmost accuracy without any mismanagement.
These templates are all fully editable and customizable. Slides ready for content are provided as structure, and the flexibility to change the presentation allows it to be customized to fit the needs of different audience segments.
Using our Sales CRM Templates for sales pipeline dashboards, you can improve customer relationships, streamline sales processes, and achieve effective lead management.
Let's get started now!
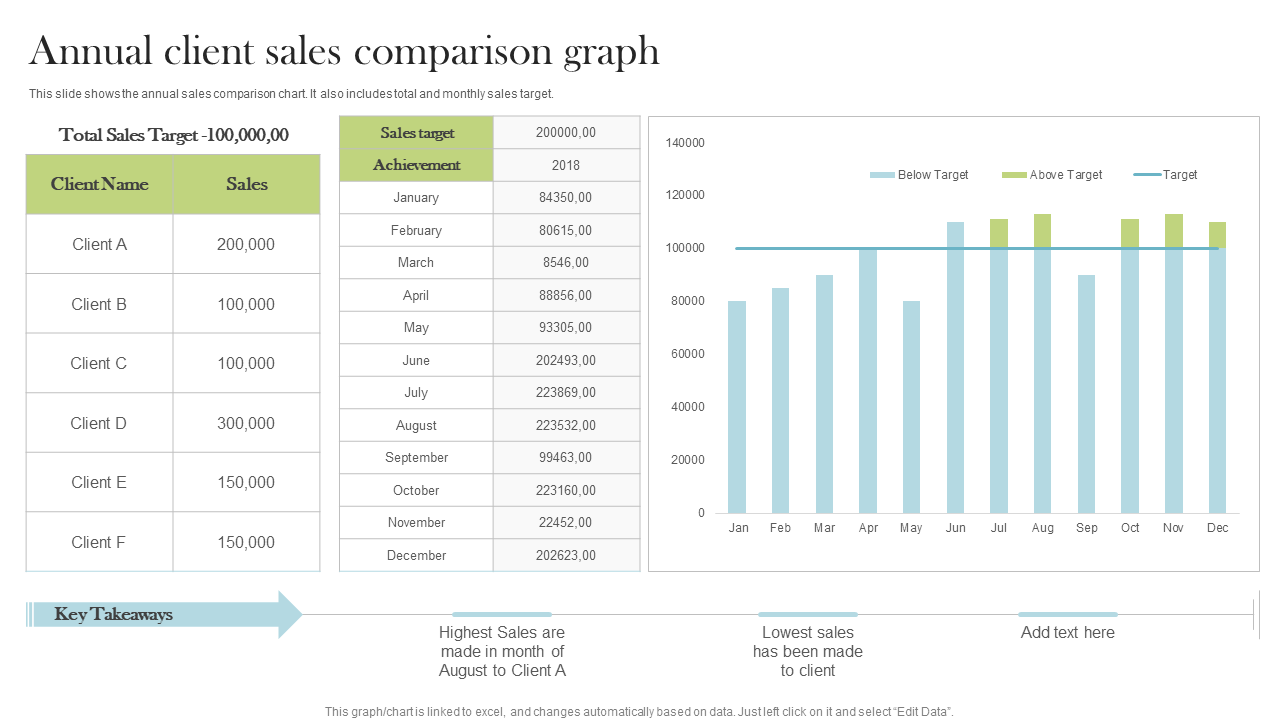
Template 1: Annual Client Sales Comparison Graph
Sales is the lifeline of any business, without which no company can ever survive. However, the most important thing for any business is to track their sales to determine whether they are growing. Instead of creating multiple graphs, sheets, and data to record and present your sales to the clients, the best thing you can do is deploy our visually appealing sales comparison graph PPT template. With detailed research, the template has been created for recording sales from different clients, sales targets, achievement of particular sales amount for each month, and the graphical analysis for you to make comparisons and pinpoint the tenure where sales were meager and reasons for the same. Get it right away!
Template 2: Monthly Sales Volume Report With Graph
Introducing another professionally-curated PPT template, you can deploy to record and showcase your monthly sales report graphically. The template offers to record monthly sales with particular areas from where they are generated. With the graphical demonstration, you can compare the current and last month's sales volume and assess the month with the least and most sales and the reasons behind it. You can also present your current month's sales volume to your stakeholders and team. With all the sales data gathered in one slide, you can give it to the board of directors and analyze and discuss the strategies to increase sales in the coming months. Grab this immediately and create your sales metrics dashboard, making your comparison analysis easier than ever!
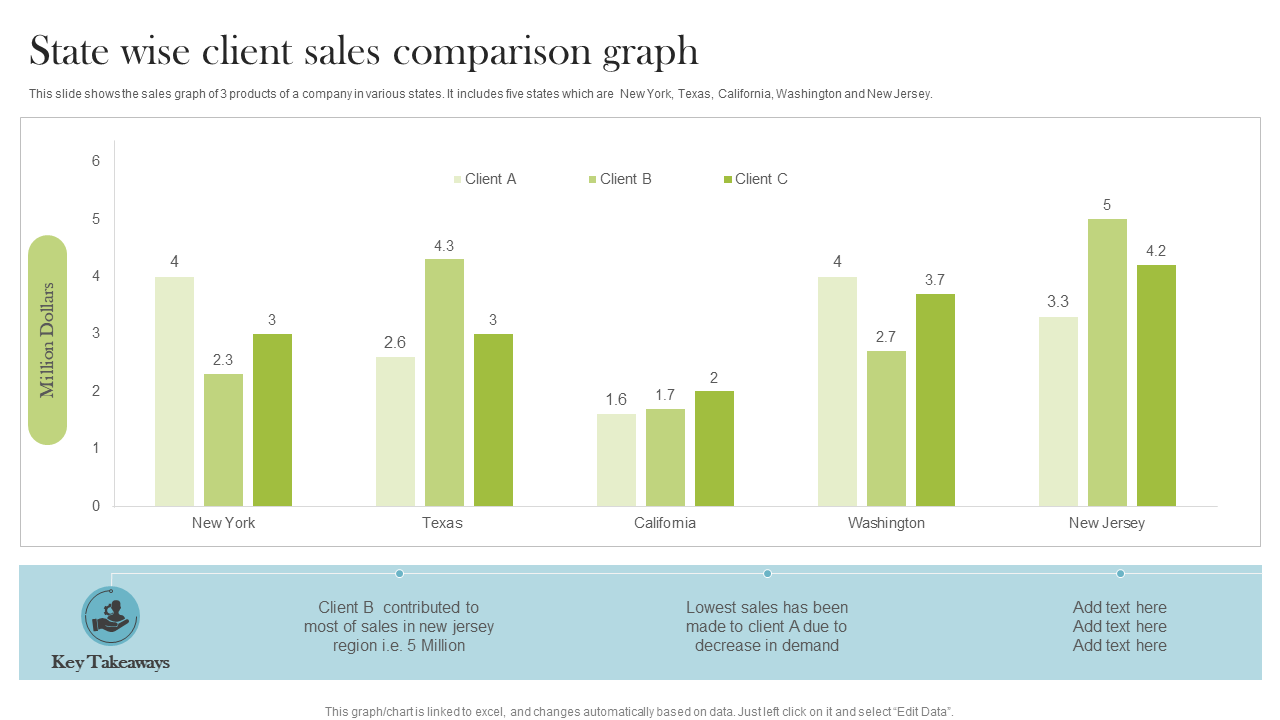
Template 3: State Wise Client Sales Comparison Graph
Are you a multi-products company seeking an effective way to compare and assess your financial data in different regions? The Slide Team is here to assist you! Deploy our perfectly created PPT template and get all the numbers visible in just one slide to jot down and present. With a visually appealing sales comparison graph, you can fill in sales generated through three different products in five regions in just a single template. And easy to analyze, you can also conclude your presentation with critical takeaways as to what product generated the most sales in numbers in what particular region, what product achieved the most minor sales, and the reason for the same. Download this now and craft the result-oriented sales and marketing plan to overcome low sales.
Streamline Your Sales Record with our Perfect PPT Templates!
With adaptable templates that can be altered to meet your team's demands, you can enable your employees to go beyond what is expected.
Slide Team helps your team be more productive and complete more tasks by making planning, collecting, managing, and tracking sales records from any location simple. Keep your team informed and engaged with roll-up sales reports, dashboards, and automated processes that report on critical metrics and provide real-time insight into sales comparison as it progresses.
Grab these PPT templates to monitor your sales data graphically and compare it with previous months or years to analyze what needs to be improved. Bid goodbye to missed opportunities and untracked records as you deploy SlideTeam's sales graph templates!


 Customer Reviews


