In business, staying ahead requires more than just keeping up with the competition—it demands a strategic understanding of data. Imagine, for a moment, the scale at which giants like Amazon perform their operations or how Netflix tailors your binge-worthy recommendations. What fuels their success? The answer lies in their mastery of data, brought to life through the lens of virtual dashboards.
The blog aims to break down the barriers between you and the untapped potential within your data. Your journey begins with the realization that it's the time to revolutionize the way you interpret and act upon your information. It's time to introduce a game-changer—a Virtual Dashboard that transforms complexity into clarity and chaos into strategy.
Why are Virtual Dashboards a Must for Businesses?
Ever found yourself drowning in a sea of spreadsheets, struggling to make sense of data sources? Without a Virtual Dashboard, this scenario is a painful reality for many businesses. Some common pain-points are: Time wasted on manual data analysis, decisions based on incomplete information, and opportunities slipping through the cracks.
We have the solution: Virtual Dashboard Templates!
Why Download Our Templates
These templates are your shortcut to efficiency, providing a ready-made canvas for your data. Here's how they help:
- Holistic Data Insight: Unify disparate data sources into cohesive visualizations for a holistic view of your business landscape.
- Agile Decision-Making: Respond to market changes with real-time insights accessible at the click of a button.
- Tailored Precision: Customize dashboards to your industry, business size, and specific needs, ensuring relevance and effectiveness.
Let's explore the templates!
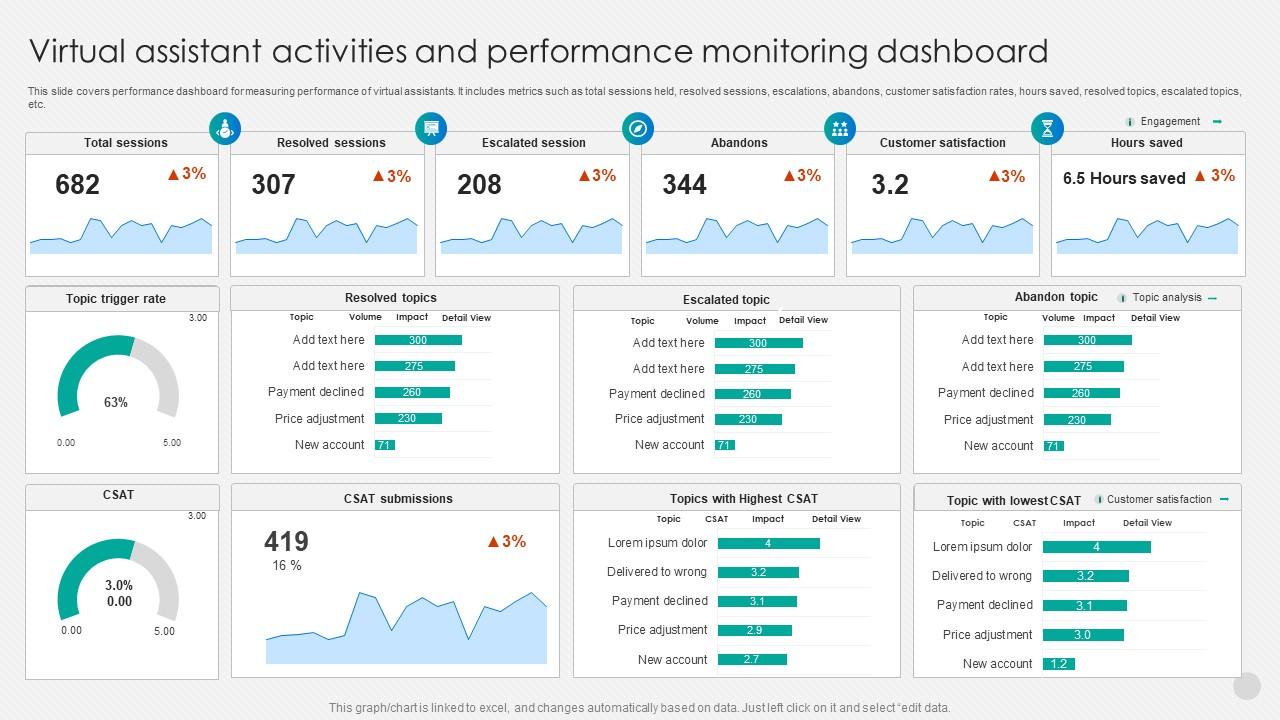
Template 1: Virtual Assistant Activities and Performance Monitoring Dashboard
Discover the key to streamlining your digital assistant’s performance with this consolidated dashboard. Get a clear overview of interactions, including total, resolved, and escalated sessions, to assess how effective your virtual assistant is. Be aware of abandoned sessions and track customer satisfaction rates to understand users better and enhance their experience. See just how much time your virtual assistant saves with its hours-saved report, highlighting efficiency gains. Plus, with the topic trigger rate analysis, you can dive into which topics are most popular with users, helping you focus on what matters most for continuous improvement and personalized customer service.
Template 2: Virtual Business Dashboard for Tracking Business Revenue
Boost your business with our easy-to-use Virtual Business Dashboard, focusing on real-time revenue tracking. Get a picture of your sales performance, including current and expected revenue, ongoing deals, and details on won and lost opportunities. Stay on top of your sales pipeline, track trends and forecasts to plan, and set realistic sales targets. This dashboard tracks your sales activities and drives your business toward higher conversions and success. Grab it today!
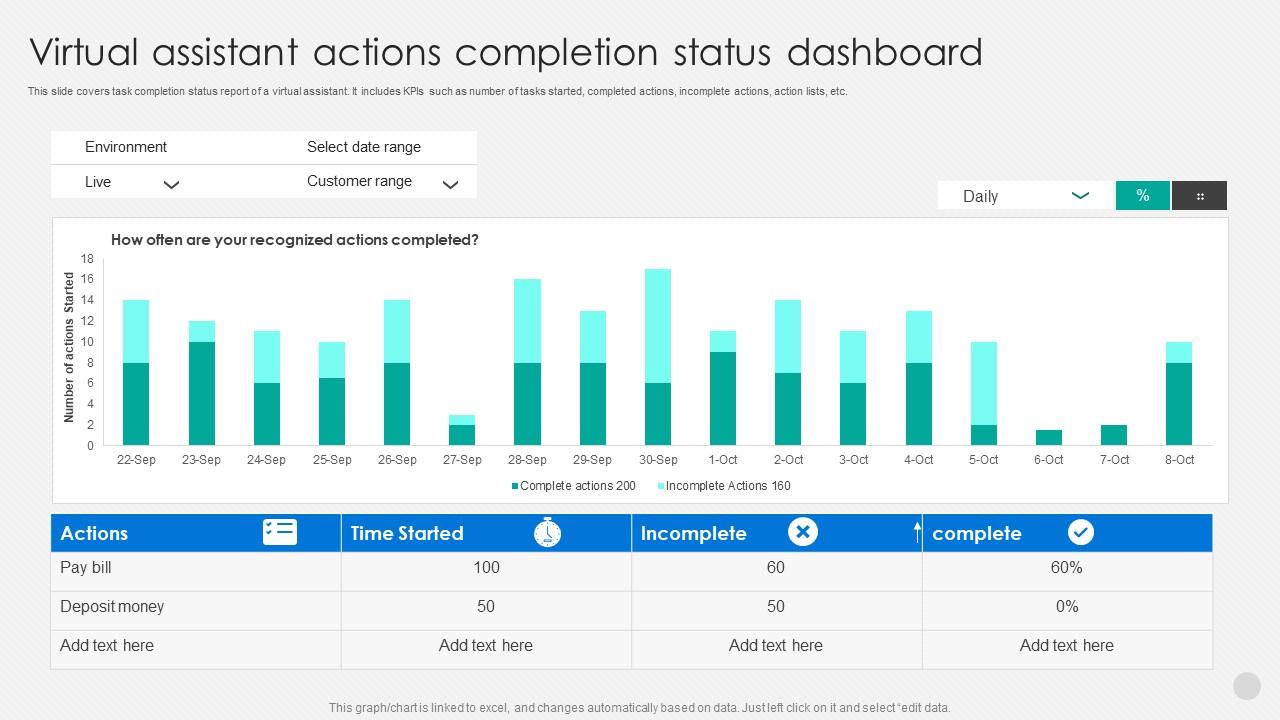
Template 3: Virtual Assistant Actions Completion Status Dashboard
Get a view of your virtual assistant's task performance with this straightforward PPT Dashboard. It features an easy-to-read bar graph that counts actions and distinguishes between what's been completed and what's still pending. You can tailor your view by selecting date ranges and customer groups, making it simple to focus on the data that matters most. This dashboard assists in managing tasks and enhancing your virtual assistant's efficiency. Download now!
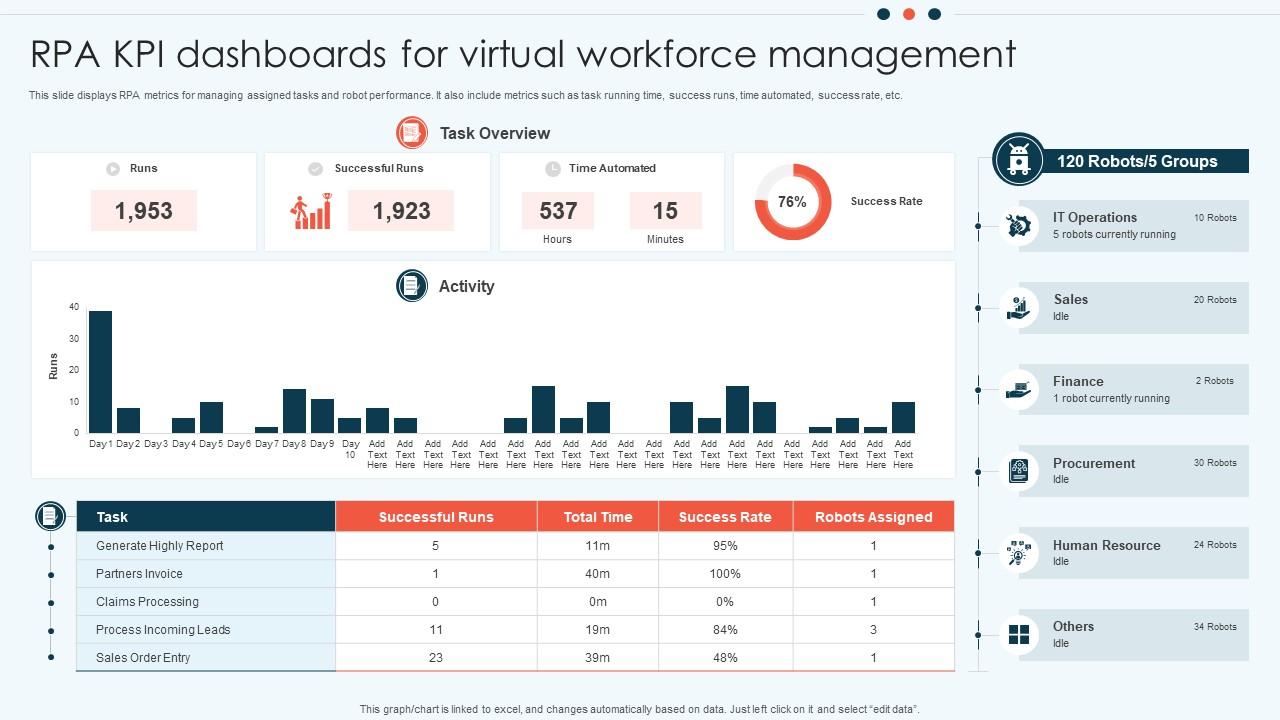
Template 4: RPA KPI Dashboards for Virtual Workforce Management
Manage your virtual workforce with this RPA (Robotic Process Automation) KPI Dashboard. This dashboard offers vital metrics on your automated tasks and robot efficiency, including total and successful task runs, time saved through automation, and the success rate of processes. Perfect for keeping tabs on your robotic workforce's performance, this tool helps you identify areas for improvement and ensures your automation strategy is on track. Download it today!
Template 5: Dashboard for Tracking Virtual Business
Stay on top of your virtual business with this user-friendly Dashboard. Track monthly revenue, identify your top deals, and see the number of subscribers you have across channels. Check out how your website is performing with a glance at the dashboard. Plus, there are special sections to review customer feedback, analyze your Twitter engagement, and understand where your visitors are coming from. This dashboard is a must-have for keeping your online business growth on track. Grab it today!
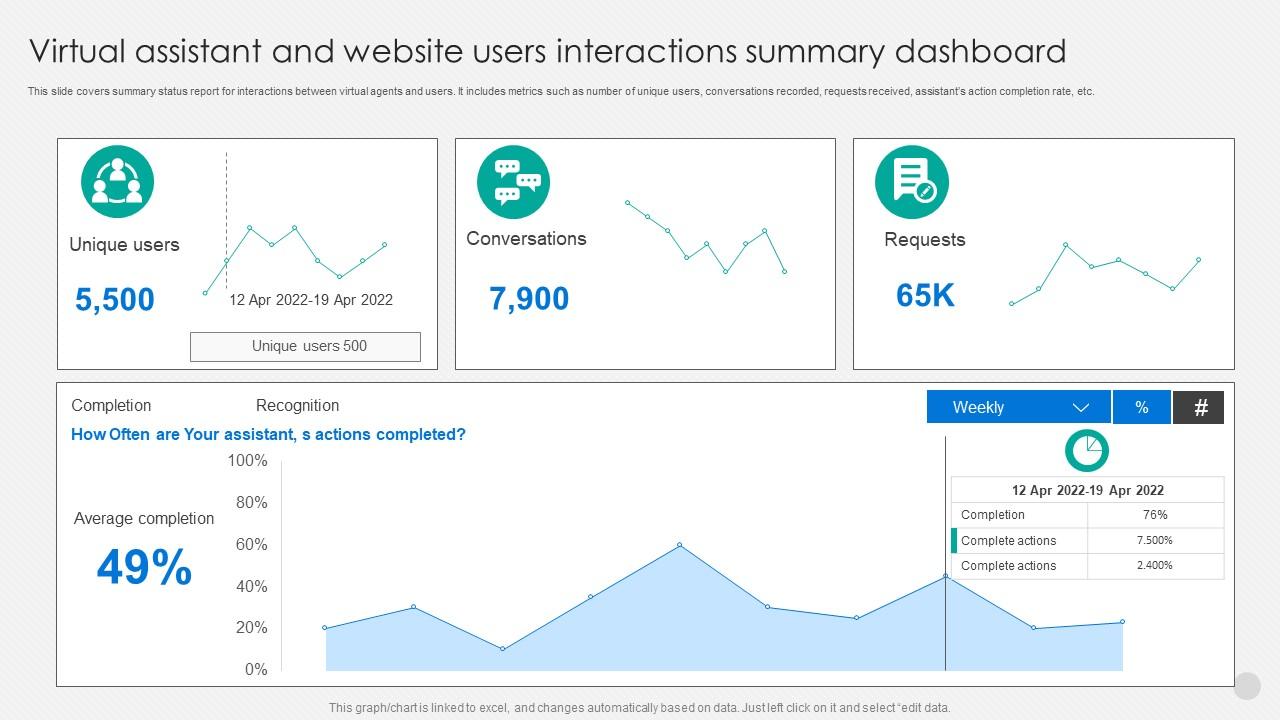
Template 6: Virtual Assistant and Website Users Interactions Summary Dashboard
Enhance your website's user engagement with this feature-packed dashboard. It summarizes interactions, highlighting unique users, conversions, and requests. Track your virtual assistant's action completion rate, offering insights daily, weekly, or monthly. Analyzing these key metrics lets you fine-tune your virtual assistant's responses and strategies to boost user engagement and satisfaction. Download this PPT template to understand user behavior and optimize your website's interactive experience.
Template 7: Tracking Essential Virtual Agents Activities Dashboard Implementing Augmented Intelligence
This PowerPoint Slide is designed for monitoring and optimizing virtual agent performance. This dashboard includes key metrics such as the new, completed, and faulty conversations, offering a real-time overview of virtual agent interactions. The average duration of conversations is highlighted to gauge efficiency. The template also features an easy-to-understand graph depicting weekly conversations categorized by topic, enabling an understanding of user engagement trends. Download now!
MASTER NEW-AGE RULES OF BUSINESS
In modern business, the ability to adapt and thrive is non-negotiable. As we wrap up our exploration of Virtual Dashboards, it's clear that these tools are not just reserved for industry giants like Amazon and Netflix. They are the key to unlocking untapped potential within your business, regardless of size or sector. Your journey toward data-driven success begins with a simple download, a commitment to understanding your data, and a willingness to let insights guide your decisions.




 Customer Reviews

