Are you concerned about the stock market's recent volatility? You're not alone. Both the young, who don’t care about being pragmatic, and the old, who err on the side of conservatism, are worried; so is everybody in between.
If, however, you happen to have diversified your investment portfolio with the inclusion of stocks, then you could have secured your financial security in the long term (at least over ten years of staying invested).
Unfortunately for everyone, the Covid-19 pandemic meant that all stocks did go down in a heap. Volatility in the stock market is an expected and known risk, but a global pandemic or a war in East Europe is harder to predict.
It is time to learn to be more cautious with your stock market investment and count the beans with care. Many investors are watching their portfolios closely, and some are even selling their stocks to cut their losses.
Before you make any rash decision, however, it’s important to understand what's driving the market's volatility. One of the best ways to do this is to look at a stock volatility chart.
What is a Stock Volatility Chart?
A stock volatility chart is a representation of how much a particular stock has fluctuated in price over time. Looking at a stock volatility chart can give you a good idea of how volatile the stock is. It can also help you spot trends in the stock's price movement.
Volatile stocks tend to have larger price swings than non-volatile stocks. This means that they are more likely to reach new highs or lows, naturally.
Use the stock volatility chart to make informed decisions with your stocks and help others to do the same. You have the data, we have the templates to put the data in.
Editable Stock Volatility Chart Templates
Finances, stocks, bonds, investments…these are topics that are difficult to understand for a layman. Our PowerPoint templates are perfect to present financial data to the audience in a digestible manner so that they can comprehend and implement stock investment advice.
We present 10 PPT designs to help you with this crucial presentation.
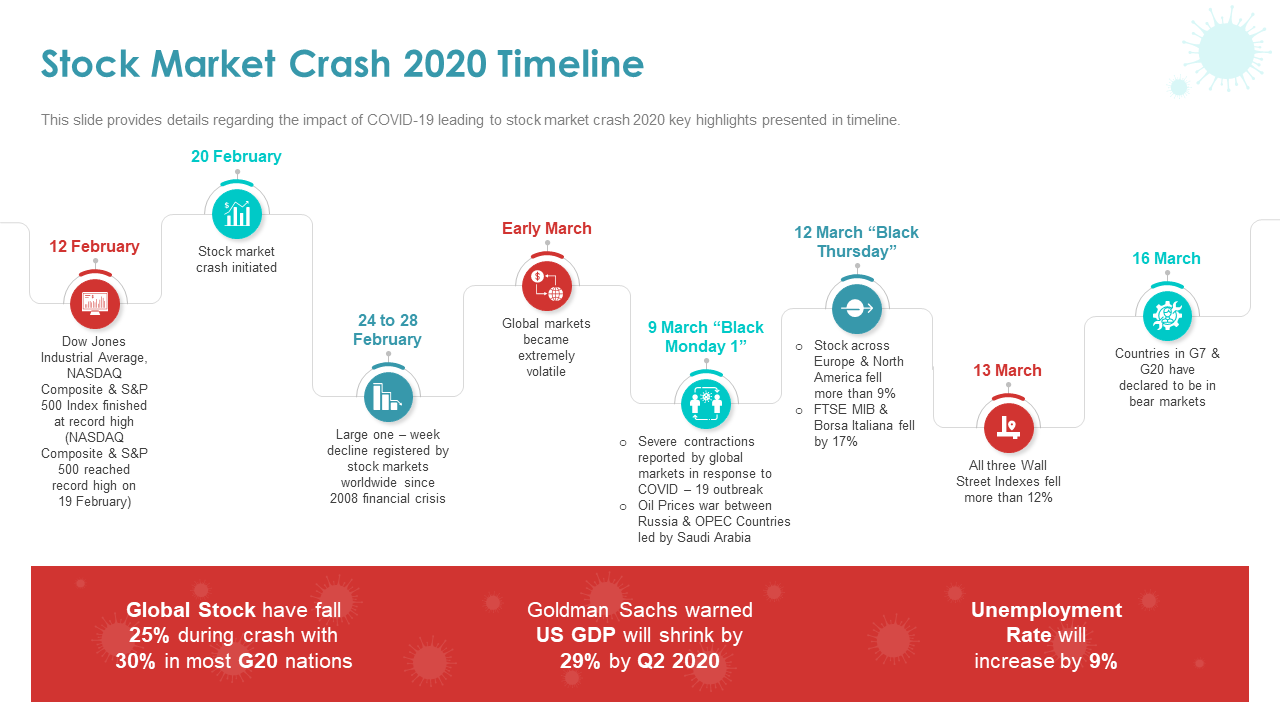
Template 1: Stock Market Crash 2020 Timeline PPT List
The stock market crash of 2020 wiped out trillions of dollars in wealth and left millions jobless. This timeline PowerPoint layout lists the events that led up to the crash and the aftermath. It is a valuable resource for anyone interested in understanding what caused the crash and how it affected the world economy. Download it now.
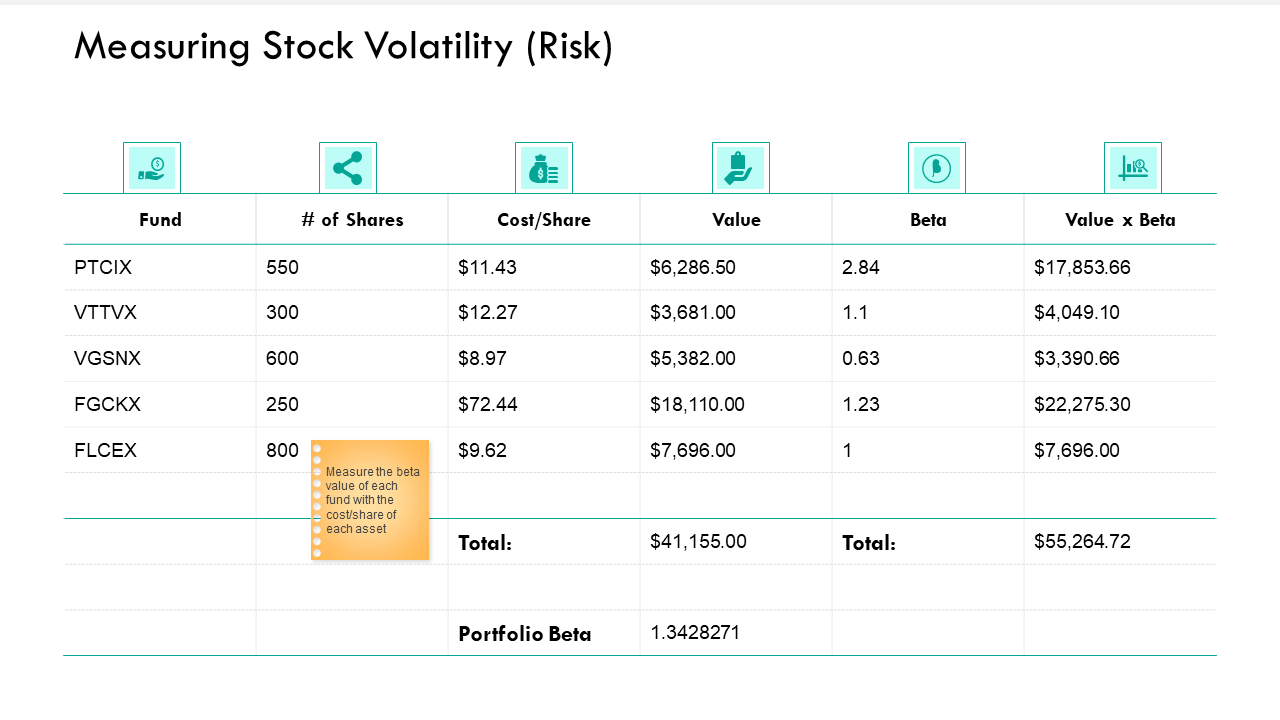
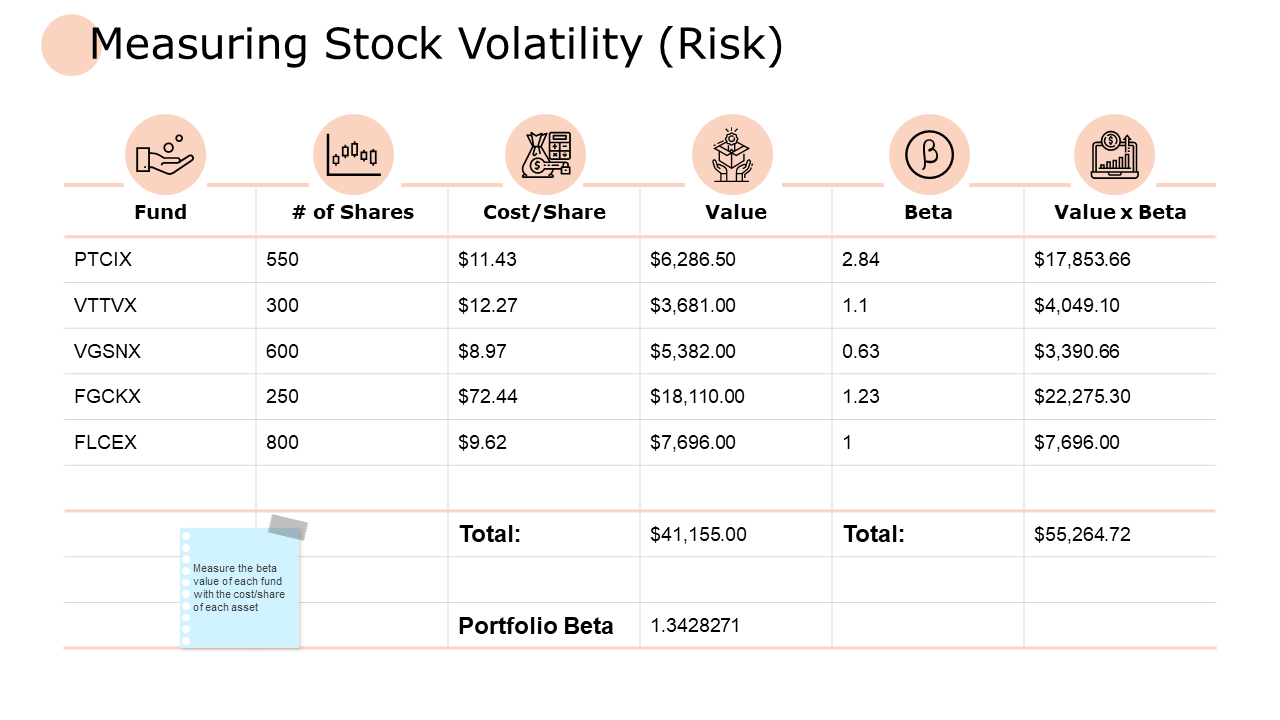
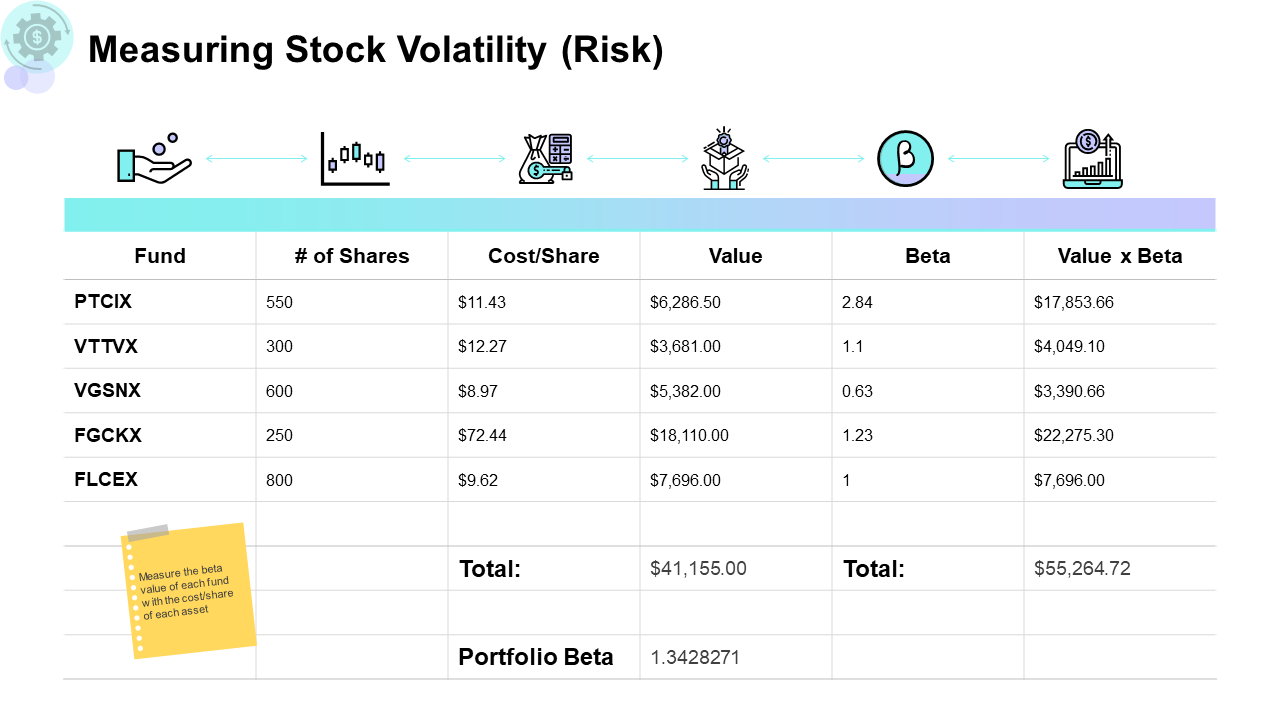
Template 2: Measuring Stock Volatility Risk Portfolio PowerPoint Graphics Design
This PowerPoint slide helps you measure and track stock volatility risk in your portfolio. It contains the table columns you need to make an informed decision about your investment. The attractive slide is also easy to understand. Employ it now.
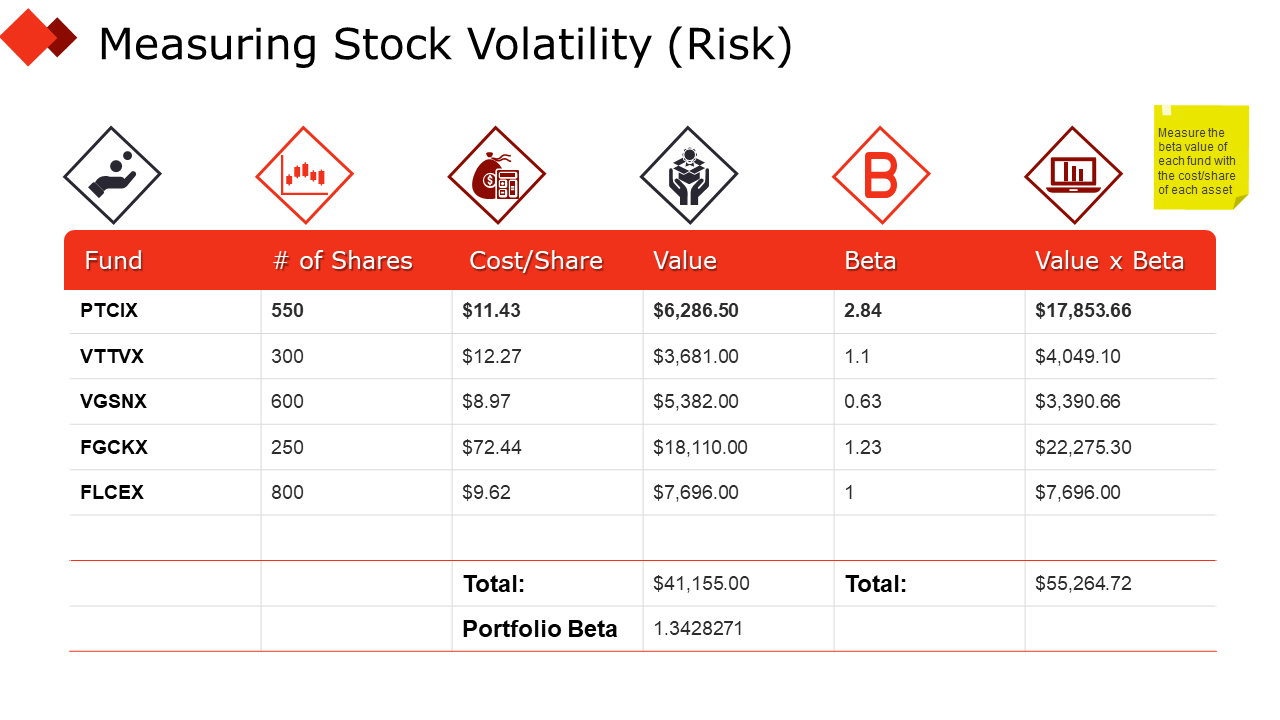
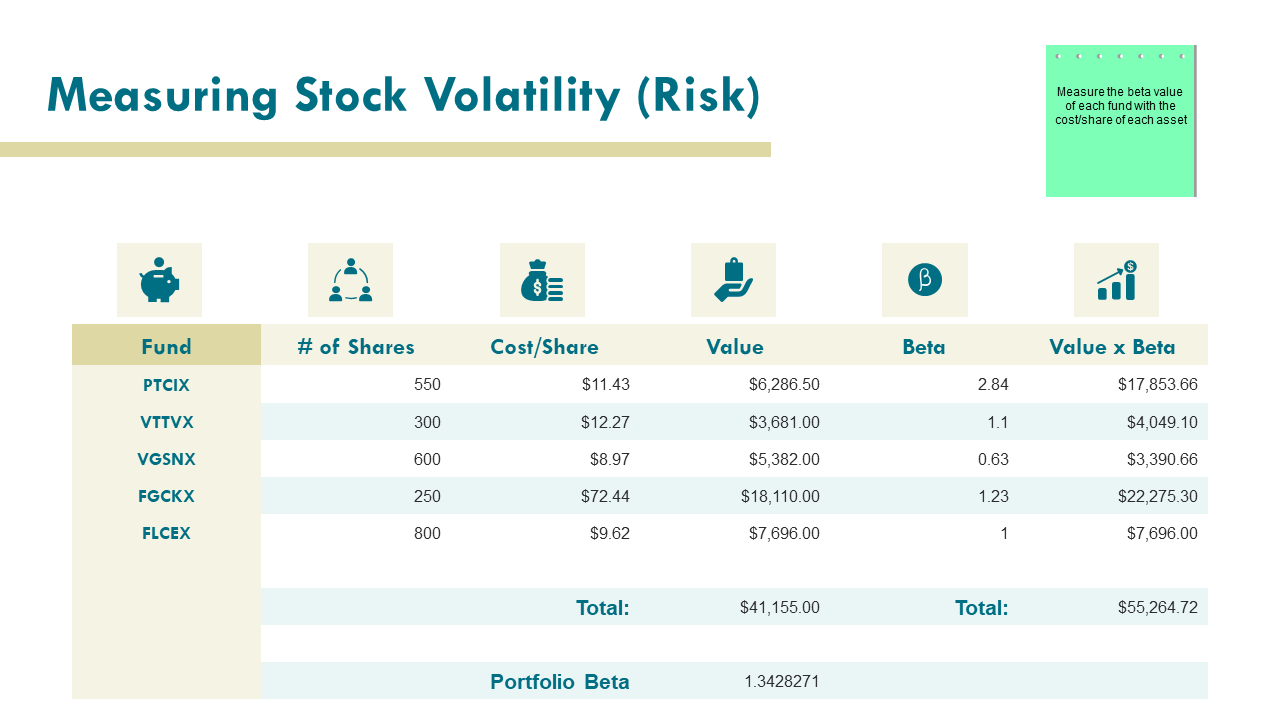
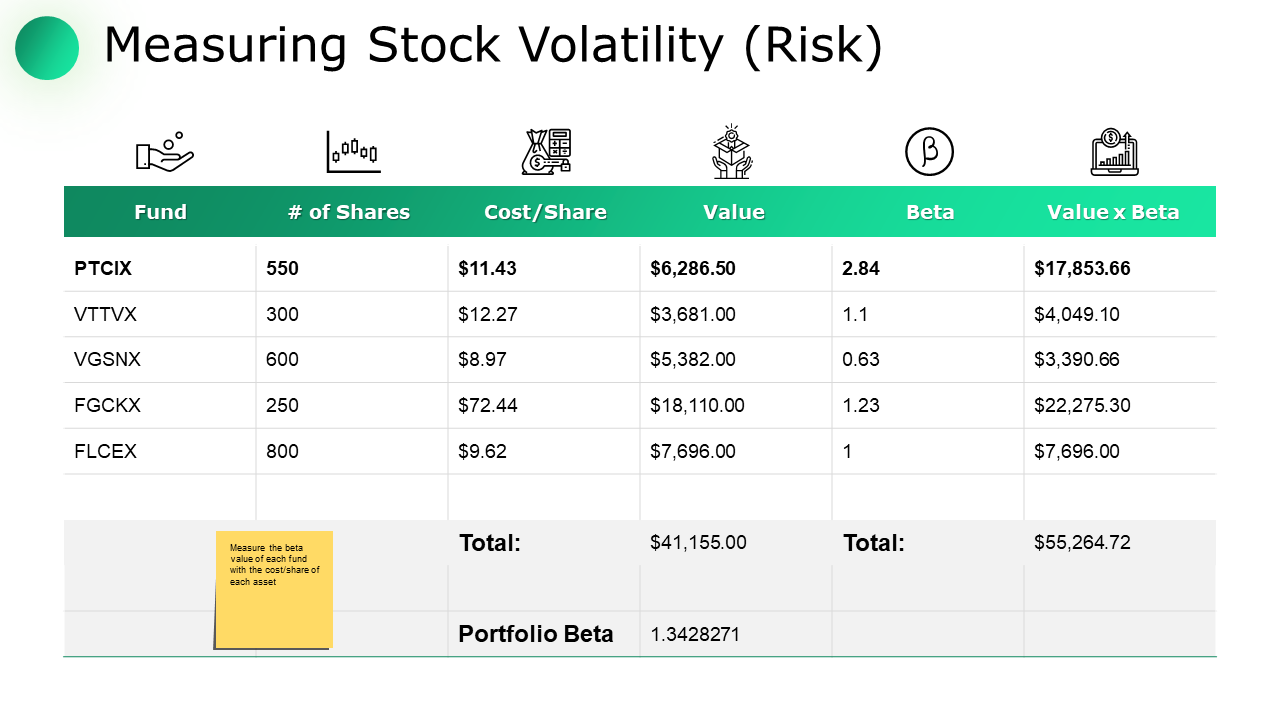
Template 3: Measuring Stock Volatility Risk Table PPT Slide
This PPT theme features a sleek and modern design that is easy to understand and good to look at. The rows make it simple to see how different investments are performing. As it is customizable you can edit it to represent as much data as you have. Incorporate it now.
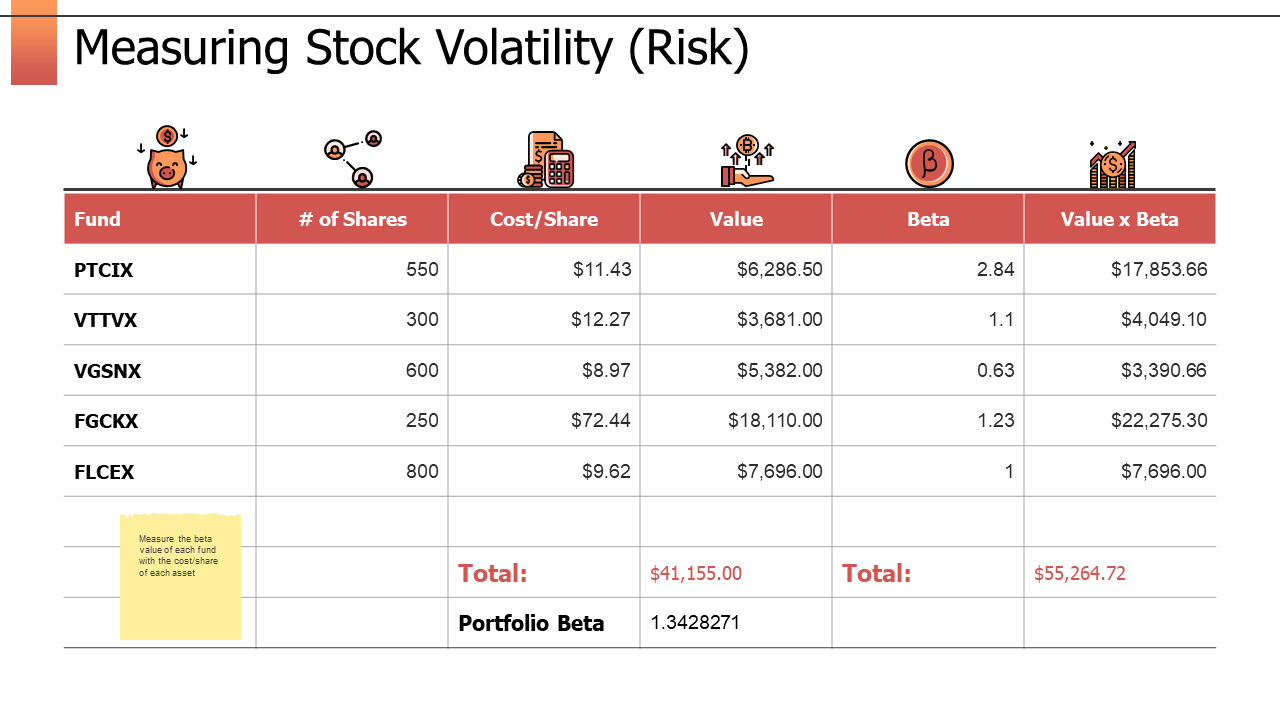
Template 4: Measuring Stock Volatility Risk Value Outline
The presentation is broken down into easy-to-understand slides that explain the concept of stock volatility risk and how to measure it. You can measure the beta value of each stock and represent the cost per share value as well. Use it now.
Template 5: Measuring Stock Volatility Risk Model
This PPT set will allow you to see how much risk your holding of stocks carries. The sleek and modern design is sure to capture the attention of your audience, while the clear and concise layout makes it easy to understand the information. Download it now.
Template 6: Measuring Stock Volatility Risk Growth
With our color-coded system, you'll be able to identify stocks on the basis of risk in this PowerPoint theme. This is an essential tool for an investor who wants to take control of their portfolio and make informed decisions about where to invest their money. Get it now.
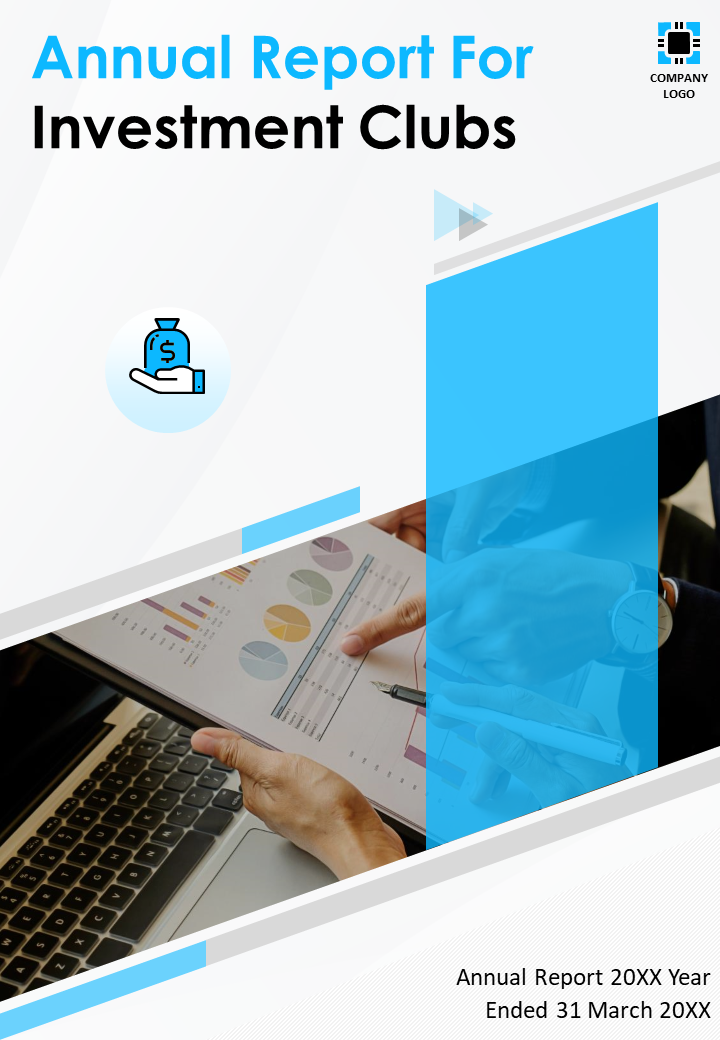
Template 7: Annual Reports for Investment Clubs
It allows you to showcase your findings and results in a digestible, yet visually appealing manner. This document is editable in PowerPoint, so you can tailor it to fit your needs. It covers the company highlights, chairman’s reports, business model, etc. Download it now.
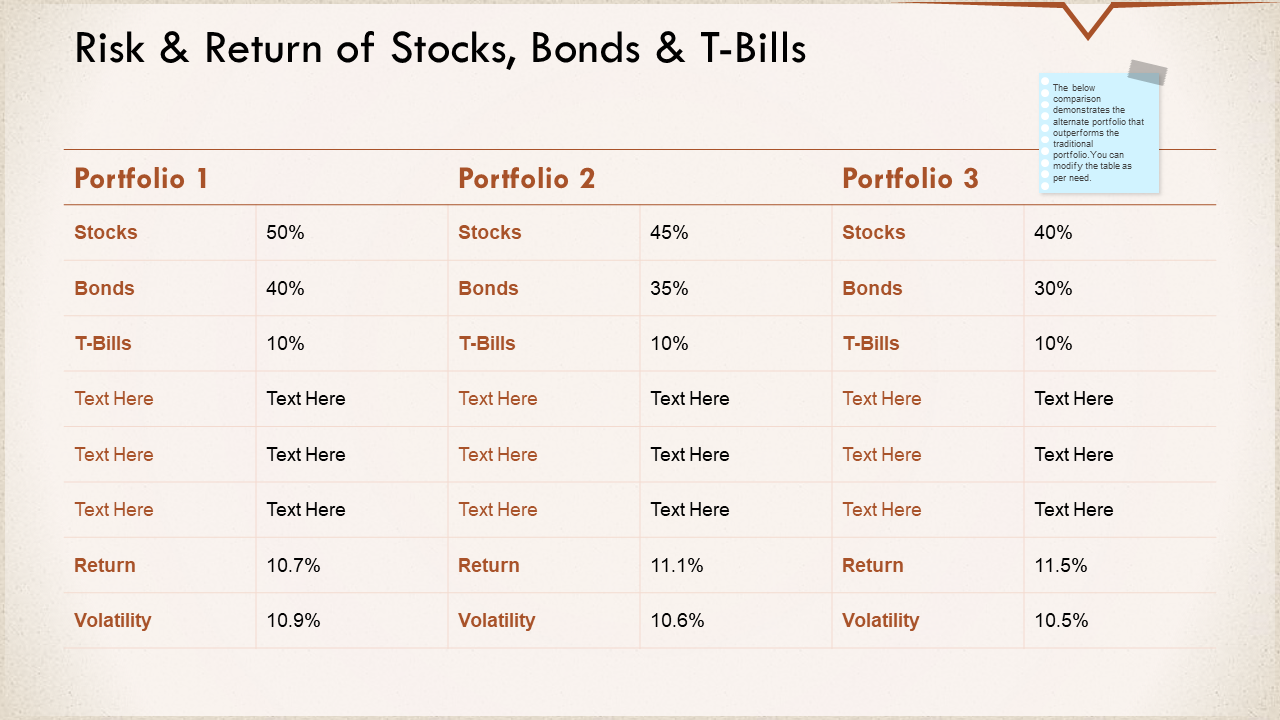
Template 8: Risk and Return of Stocks Bonds and T Bills Volatility
This PowerPoint layout covers the definition of volatility, how it is measured, and its impact on stock prices. It also discusses the risk and return characteristics of stocks, bonds, and T-bills, as well as the risks associated with each investment. Employ it now.
Template 9: Measuring Stock Volatility Portfolio Summary
Whether you're looking to showcase your company's products and services, present your latest research findings, or simply deliver an engaging and informative presentation, our PPT design is the perfect tool. Download it now.
Template 10: Measuring Stock Volatility Risk Cost
With its intuitive interface and customizable features, you can get started on measuring risk right away. Whether you're a beginner or a seasoned investor, this is a must-have tool for anyone looking to stay on top of their stock portfolio. Download it now.
With a stock volatility chart, you can find stocks that are undervalued or overvalued; use it to find other scrips that are about to experience a price change or measure market risk and predict future price movements.
No matter the objective, our stock volatility chart templates will help you manage risk in your stock investments.
PS: Are you a market analyst or a stock manager? Then you need to check out our handy blog (with PPT templates) to better analyze the stock market.


 Customer Reviews

