![The Superfast Guide to Waterfall Chart [PPT Templates Included] [Free PDF Attached]](https://www.slideteam.net/wp/wp-content/uploads/2022/05/Waterfall-Chart_1.gif)


 Customer Reviews
Do you feel like your presentations always lack that certain je ne sais quoi? Do you wish to make your presentations pop? A waterfall chart can help.
But what are waterfall charts? And why should you use them in your presentations?
We will discuss what waterfall charts are and how they are used. Then we will take a look at the advantages and disadvantages of using waterfall charts in business presentations. Finally, we will provide helpful tips for creating effective waterfall charts using PowerPoint templates in this blog.
So let’s get started!
What Is a Waterfall Chart?
Waterfall charts are graphs used to show how a value changes from one point to another. It is named after the waterfall effect created when water flows over a series of rocks. They are also sometimes called flying bricks charts or Mario charts, after the video game character who jumps from one platform to another.
Now that we know what it is, let’s take a look at its uses.
What Are the Applications of a Waterfall Chart?
Waterfall charts are a great way to visualize data, and they can be used for a variety of purposes. For example, you could use a waterfall chart to track a project's progress or show how different parts of a product come together.
You can also use it to show how revenue has changed over time or how various expense categories have changed over time.
What Are the Advantages of a Waterfall Chart?
There are several advantages of using waterfall charts in business presentations. Firstly, waterfall charts are visually appealing and can help to engage the audience. Secondly, they can be used to show a variety of data sets in a single graph. This can be helpful when trying to compare different values or trends. Finally, waterfall charts are relatively easy to create, and there are many PowerPoint templates available that can help save time.
With all their pros, waterfall charts have their cons as well. Let us dwell on some of them.
What Are the Disadvantages of a Waterfall Chart?
Waterfall charts are best used for presentations. They can be a great way to engage your audience and get them involved in the data. But, they are not always the best option for printed materials.
Firstly, waterfall charts can be difficult to interpret if the data sets are large and complex. Secondly, waterfall charts may not be appropriate for all types of data. Third, they only work for linear processes—if your data is more complex, you might want to use a different chart type. Finally, they can take up a lot of space on a slide and may not be suitable for text-laden presentations with little to no empty space
Now that you understand the nature of the waterfall charts, let’s learn how to create your own.
How to Design and Best Present Them: Waterfall Chart Templates
When creating waterfall charts in PowerPoint, it is important to use a template designed for business presentations. This will ensure that the waterfall chart is easy to interpret and looks professional. Now, let’s take a look at the steps needed to create this chart in PowerPoint.
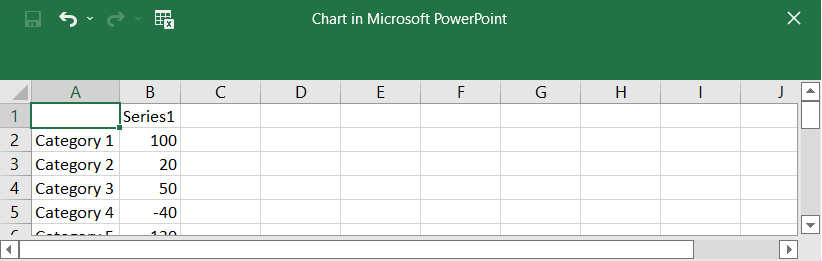
Step 1: Insert and Select Waterfall Chart
Go to Insert > Chart > Waterfall > OK and select the layout as we have done in the screenshot below.


Step 2: Enter Your Data in the Excel Pop-up
Insert the data in the Excel dialog box that appears in the slide.
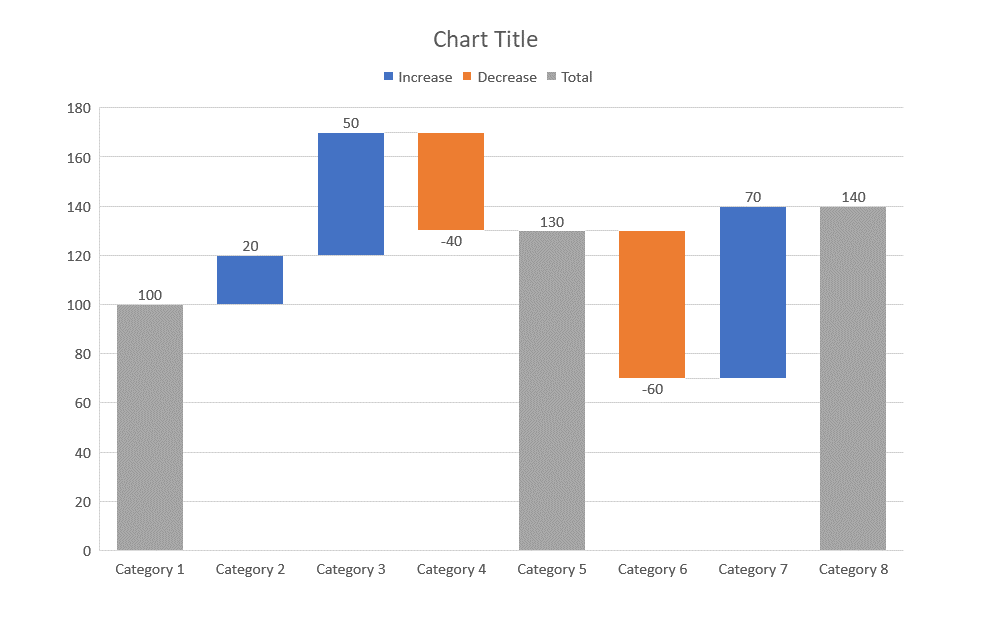
Step 3: Create the Plot and Customize
The chart will change as you add the data in the Excel dialog box. You can customize the chart using the options on the chart's right-hand side, such as the chart elements (trendline), styles, and filters.
The use of waterfall chart templates in your presentations and meetings would help you showcase your data and its results in a manner that is understandable to an average person.
However, designing an entire template is a time-consuming task. Hence, we have brought you 10 hand-picked templates from which you can choose depending on your needs. Let’s take a look.
Template 1: Waterfall Project Management PPT Bundle
This PPT deck includes everything you need to get started with your next project, including templates for every phase of the waterfall method, charts and diagrams, and more. It includes slides for waterfall project management benefits, methodology, process, etc. Download it now.

Template 2: Profit and Loss Waterfall Chart PPT Slide
This PowerPoint theme can be used to show changes in revenue or profit over time. It's also perfect for conducting inventory or performance analysis. So whether you need to track your annual sales, total profit, or inventory balance, this PPT design will do the trick! Get it now.

Template 3: Methodology of Waterfall Project Management
Our PPT preset can help you avoid common pitfalls and stay on track by breaking down your project into specific stages. It explains how to plan, execute, and monitor projects. This tried-and-true PowerPoint template offers a simple, step-by-step process that is perfect for any organization. Download it now!

Template 4: Waterfall Chart Showing Company Growth
This PowerPoint set will help you clearly demonstrate the cumulative effect of values introduced in a sequence. It is perfect for showing how an initial value is affected by subsequent positive or negative values. Each column is color-coded to clearly distinguish between positive and negative values, making it easy to follow along. Get it now!

Template 5: Waterfall Method for Software Implementation
This PPT theme helps provide a new approach to software development that makes it easy and efficient for startups and unicorns alike. With this PowerPoint design, you can rest assured that your software will be implemented quickly and correctly, with minimal risk of errors or delays. Download it now!

Template 6: Project Approach Differences for Agile Vs Waterfall
If you're working on a software development project, you've probably heard of the agile approach. And you may also be familiar with the traditional waterfall approach. But what's the difference between these two approaches? This PowerPoint deck helps you understand this difference and make the right decision. Download it now!

Template 7: Sales Waterfall Showing Annual Sales Growth Drivers
This PPT slide lets you show the total change, as well as the individual changes, that led to your overall growth. You can use it to showcase yearly sales growth or YoY sales growth And it's also great for presenting financial statements or population data. Employ it now!

Template 8: Analysis of Product Performance Through Revenue Waterfall Chart
This PowerPoint theme provides a visual representation of how your product is generating revenue and can help you identify areas for improvement. This PPT slide is a valuable tool for any business owner or manager. Get the insights you need to make informed decisions about your product with this essential chart. Download it now!

Template 9: Waterfall Chart Showing Budget
This PPT slide is perfect for analytical purposes, allowing you to showcase changes in your budget. You can customize the objects in the PPT slide to fit your needs, and it can be used by directors or presented by directors to their staff. The bars are color-coded, making it easy to see where your budget stands. Incorporate it now!

Template 10: System Development Waterfall Model
This PowerPoint deck provides a step-by-step guide for developing a new system, from initial planning through to final implementation. It is a highly effective way to ensure that all aspects of the system are taken into account and that the end result is a well-functioning system that meets all the requirements. Get it now!

So if you're looking to use waterfall charts in your next presentation we've got you covered with the PPT templates stated above. They are not only easy to navigate but also highly flexible.
Just download the powerpoint templates, and you'll be ready to go!
What have you used waterfall charts for? Share them in the comments below!
P.S: Increase efficiency and productivity using the scrum process. Use this guide (with templates included) to implement this process.
Download the free Waterfall Chart PDF.