- Sub Categories
-
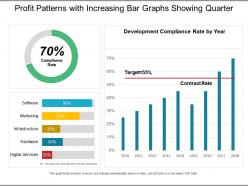 Profit patterns with increasing bar graphs showing quarter
Presenting this set of slides with name - Profit Patterns With Increasing Bar Graphs Showing Quarter. This is a three stage process. The stages in this process are Engineering, Procurement And Construction, Construction Management, Engineering, Purchasing And Construction .
-
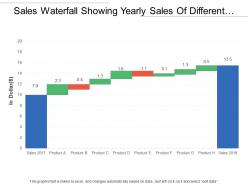 Sales waterfall showing yearly sales of different product
Presenting this set of slides with name - Sales Waterfall Showing Yearly Sales Of Different Product. This is a ten stage process. The stages in this process are Sales Waterfall, Waterfall Chart.
-
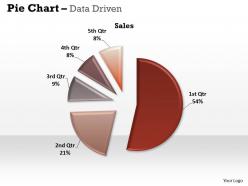 Data driven pie chart for easy comparison powerpoint slides
We are proud to present our data driven pie chart for easy comparison powerpoint slides. This Pie charts is useful to compare different parts of a whole amount. It is often used to present financial information.Use this slide to transmit this clarity of purpose onto the eager minds of your team.
-
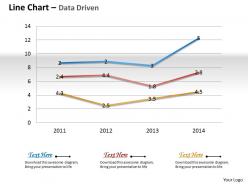 Data driven chart shows changes over the time powerpoint slides
We are proud to present our data driven chart shows changes over the time powerpoint slides. Your Ideas Provide Food For Thought. Our Data Driven Chart Shows Changes Over The Time Powerpoint Slides Power Point Templates Will Help You Create A Dish To Tickle The Most Discerning Palate. Our Data Driven Chart Shows Changes Over The Time Powerpoint Slides Power Point Templates Are Innately Eco-Friendly. Their High Recall Value Negate The Need For Paper Handouts.
-
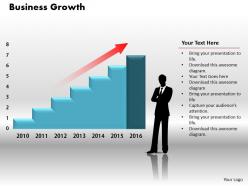 0414 business person with column chart powerpoint graph
Useful for start-ups and professionals preparing business-related presentations. Compatible with every software and Google slides. Provision to add name, trademark and logo of the company. No space constraints for adding sub-titles and titles. No pixilation with respect to picture graphics when projected on wider or bigger screens. Customisable in terms of color, font of the text, design an orientation. Convertible into common formats like PDF and JPEG.
-
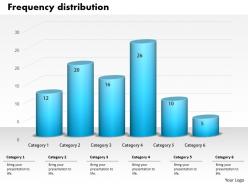 0414 data distribution column chart powerpoint graph
Simple to save into JPEG and PDF document. PPT samples are harmonious with Google slides. Flexible to share in widescreen view as amazing picture quality. Easy to alter color, text, font and shape. Similar designs accessible with different nodes and stages as required. Convenience to incorporate occupational label, design. Speedy download and sharing is easy. Valuable for sending birthday wishes, personalized messages and postal envelope services etc.
-
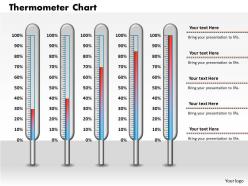 0414 thermometer column chart design powerpoint graph
Educate your team with the knowledge you have gained. Professionals can use this slide for health and column chart graph representation. All the colors used in the PPT slide is editable. Use this template in full screen for the best experience, get rid of the watermark and use it with google slides, just click download and follow the steps.
-
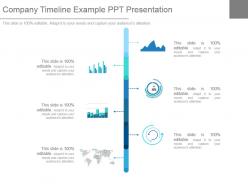 Company timeline example ppt presentation
Presenting company timeline example ppt presentation. This is a company timeline example ppt presentation. This is a six stage process. The stages in this process are business, marketing, icons, strategy, timeline.
-
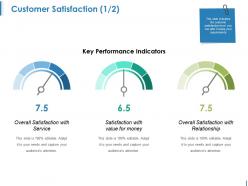 Customer satisfaction ppt background
Presenting this set of slides with name - Customer Satisfaction Ppt Background. This is a three stage process. The stages in this process are Overall Satisfaction With Service, Satisfaction With Value For Money, Overall Satisfaction With Relationship.
-
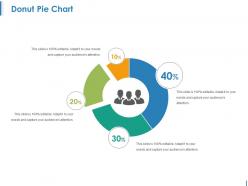 Donut pie chart ppt examples
Presenting this set of slides with name - Donut Pie Chart Ppt Examples. This is a four stage process. The stages in this process are Donut Pie Chart, Finance, Marketing, Strategy, Analysis.
-
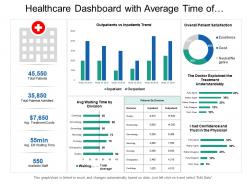 Healthcare dashboard with average time of division and patient satisfaction
Presenting this set of slides with name - Healthcare Dashboard With Average Time Of Division And Patient Satisfaction. This is a five stage process. The stages in this process are Healthcare, Health Improvement, Medical Care.
-
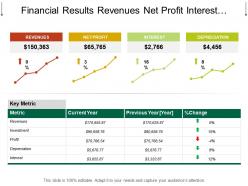 Financial results revenues net profit interest depreciation
Presenting, Financial Results Revenues Net Profit Interest Depreciation PowerPoint template. This presentation slide is beneficial for managers, employees, accountant, CA, finance manager, and organizations looking to project their business process through a flow chart. This presentation template is hundred percent editable, which means you can change the text, color, and view of the given template according to your desire. You can choose icons among the thousands of options accessible. This presentation slide is compatible with Google Slides. Ease of download and convert into jpeg or pdf format.
-
 0514 money data driven chart powerpoint slides
Offer 100% access to change the size and style of the slides once downloaded and saved in the desired format. Accessible in standard and widescreen view display. More bars can also be added as per the need. Simple to download and share. Exclusively editable PowerPoint templates to allow customization i.e. with color, text and layout. Easily convertible into JPEG or PDF document. Beneficial for the business managers, financial executives, marketing professionals and the strategy designers.
-
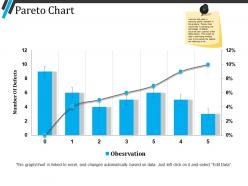 Pareto chart powerpoint templates
Presenting pareto chart powerpoint templates. This is a pareto chart powerpoint templates. This is a seven stage process. The stages in this process are pareto chart, business, growth, finance, analysis.
-
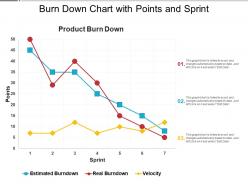 Burn down chart with points and sprint
Presenting this set of slides with name - Burn Down Chart With Points And Sprint. This is a three stage process. The stages in this process are Burn Down Chart, Agile Software Development Chart, Run Chart.
-
 Government and public works kpi dashboard showing criminal records
Presenting this set of slides with name - Government And Public Works Kpi Dashboard Showing Criminal Records. This is a eight stage process. The stages in this process are Government And Public Works, Government And Public Tasks.
-
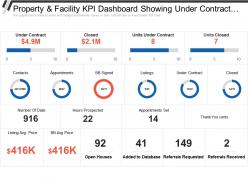 Property and facility kpi dashboard showing under contract closed and monthly team pacing
Get a chance to explore, property and facility KPI dashboard showing under contract closed and monthly team pacing KPI dashboard PowerPoint Presentation Slide. This Presentation has been designed by professionals and is fully editable. You can reshape the font size, font type, colors, and even the background. This Template is cordial with Google Slide and can be saved in JPG or PDF format without any resistance created. Fast download at the click of the button.
-
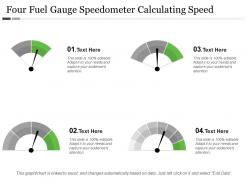 Four fuel gauge speedometer calculating speed
Presenting this set of slides with name - Four Fuel Gauge Speedometer Calculating Speed. This is a four stage process. The stages in this process are Fuel Gauge, Gas Gauge, Fuel Containers.
-
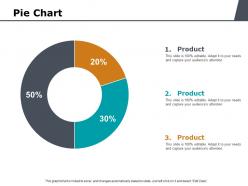 Pie chart investment ppt powerpoint presentation templates
Presenting this set of slides with name - Pie Chart Investment Ppt Powerpoint Presentation Templates. This is a three stages process. The stages in this process are Pie Chart, Finance, Marketing, Business, Analysis.
-
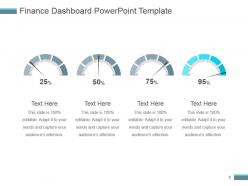 Finance dashboard snapshot powerpoint template
Presenting finance dashboard powerpoint template. This is a finance dashboard snapshot powerpoint template. This is a four stage process. The stages in this process are dashboard, finance, percentage, business, marketing.
-
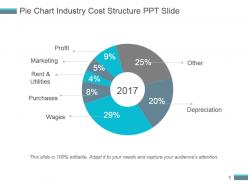 Pie chart industry cost structure ppt slide
Presenting pie chart industry cost structure ppt slide. This is a pie chart industry cost structure ppt slide. This is a seven stage process. The stages in this process are profit, marketing, rent and utilities, purchases, wages, other, depreciation.
-
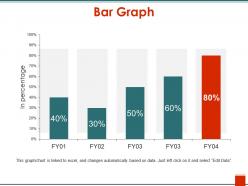 Bar graph powerpoint ideas
Presenting the Bar Graph PowerPoint Ideas template. The template is fully editable in MS PowerPoint and other similar software. Modify the font type, size, diagram color, background color, etc. according to your needs. The slide is also compatible with Google Slides and can be saved in numerous images or document formats such as JPG or PDF. High-quality graphics ensure that pixelation does not arise.
-
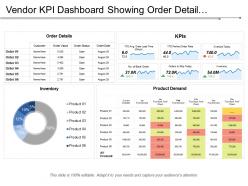 Vendor kpi dashboard showing order detail inventory and orders to ship today
Presenting this set of slides with name - Vendor Kpi Dashboard Showing Order Detail Inventory And Orders To Ship Today. This is a four stage process. The stages in this process are Vendor, Supplier, Retailer.
-
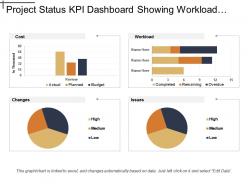 Project status kpi dashboard showing workload cost and issues
Presenting this set of slides with name - Project Status Kpi Dashboard Showing Workload Cost And Issues. This is a four stage process. The stages in this process are Project Health Card, Project Performance, Project Status.
-
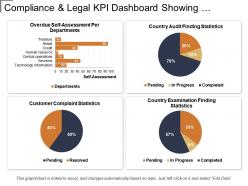 Compliance and legal kpi dashboard showing self-assessment per department
Presenting this set of slides with name - Compliance And Legal Kpi Dashboard Showing Self-Assessment Per Department. This is a four stage process. The stages in this process are Compliance And Legal, Legal Governance, Risk Management.
-
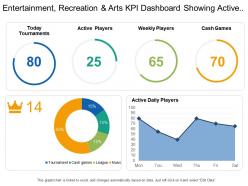 Entertainment recreation and arts kpi dashboard showing active daily players and today tournaments
Presenting this set of slides with name - Entertainment Recreation And Arts Kpi Dashboard Showing Active Daily Players And Today Tournaments. This is a four stage process. The stages in this process are Entertainment, Recreation And Arts, Attractions, Culture, Entertainment.
-
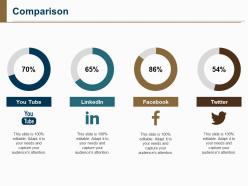 Comparison powerpoint slide rules
Presenting comparison PowerPoint slide rules. The comparison chart template designed by professional team of SlideTeam to compare different things. The comparison analysis PowerPoint temple is completely editable in PowerPoint. The comparison chart in excel PPT slide is compatible with Google Slide and the comparison slide gets linked with Excel data sheet. You can make changes in the font size, font type, color as well as dimensions of the circular icons in the comparison chart circles diagram slide as per the requirement.
-
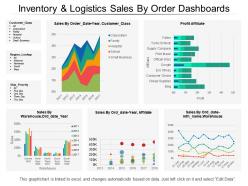 Inventory and logistics sales by order dashboards
Presenting this set of slides with name - Inventory And Logistics Sales By Order Dashboards. This is a five stage process. The stages in this process are Inventory And Logistics, Inventory Management, Warehousing And Inventory Management.
-
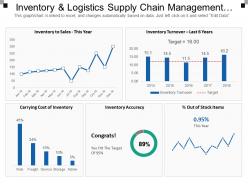 Inventory and logistics supply chain management dashboards
Presenting inventory and logistics supply chain management dashboards PowerPoint template. Access to edit the content, style, size and orientation of the PPT slides. Extremely spacious to cover all the aspects of the company profile. High resolution images do not pixelate when projected on wide screen. Personalize the PPT with your company name and logo. Modify the presentation elements as per the need of an hour. Compatible with numerous software and format options. Used by entrepreneurs, marketers, managerial department, stakeholders and students. Self-explanatory and intellectual slide charts.
-
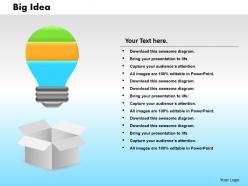 0414 bulb coming out of box bar chart powerpoint graph
We are proud to present our 0414 bulb coming out of box bar chart powerpoint graph. Hit the right notes with our 0414 Bulb Coming Out Of Box Bar Chart Powerpoint Graph Powerpoint Templates. Watch your audience start singing to your tune. Walk your team through your plans using our 0414 Bulb Coming Out Of Box Bar Chart Powerpoint Graph Powerpoint Templates. See their energy levels rise as you show them the way.
-
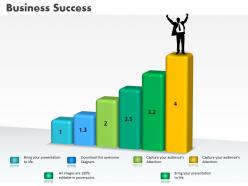 0414 business success concept column chart powerpoint graph
PowerPoint template has extraordinary quality to impose a long-lasting impression. PPT comes with easy instructions for any modifications. Growth and success oriented slides. Slide can be easily inserted in an ongoing presentation. These are compatible with Google framework. These do not need much time and effort for their operation. Choice to get presentation design in Standard and Widescreen view.
-
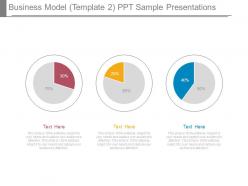 Business model template 2 ppt sample presentations
Presenting business model template 2 ppt sample presentations. This is a business model template 2 ppt sample presentations. This is a three stage process. The stages in this process are business, percentage, marketing, strategy, process.
-
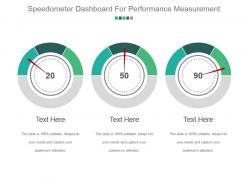 Speedometer dashboard for performance measurement powerpoint slide backgrounds
Presenting speedometer dashboard for performance measurement powerpoint slide backgrounds. This is a speedometer dashboard for performance measurement powerpoint slide backgrounds. This is a three stage process. The stages in this process are measure, meter, dashboard, speedometer, needle.
-
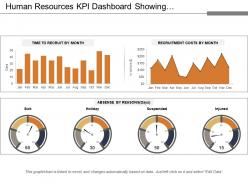 Human resources kpi dashboard showing recruitment costs and absence by reason
Presenting this set of slides with name - Human Resources Kpi Dashboard Showing Recruitment Costs And Absence By Reason. This is a three stage process. The stages in this process are Human Resource, Hrm, Human Capital.
-
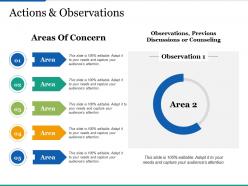 Actions and observations ppt infographics clipart images
This is a five stage process. The stage in this process are Business, Management, Observations, Discussions, Counseling.
-
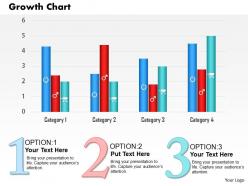 0514 business growth chart for finance powerpoint slides
Impactful visuals with intellectual content. Ease of download. Easy to execute changes at personal level as per the need. 100 percent editable slide design template. High resolution visuals. No fear of image pixilation when projected on wide screen. Compatible with multiple numbers of software options like, JPEG, JPG and PNG. Used by large number of business analysts, business strategists, students and teachers.
-
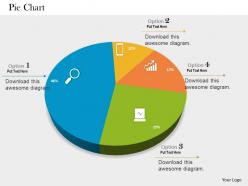 0514 sales data driven pie chart powerpoint slides
Absolutely editable color scheme and contrast of PPT graphics. Add your company name, logo, brand-name etc. to personalize. Presentation slide accessible in Standard 4:3 and Widescreen 16:9 view. Handy to be saved in JPG or PDF format. Beneficial for sales executives, marketers, business professionals, financial analysts, strategists, students, teachers, etc. Self-explanatory and intellectual slide design.
-
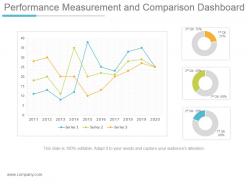 Performance measurement and comparison dashboard snapshot ppt design
Presenting performance measurement and comparison dashboard snapshot ppt design. This is a performance measurement and comparison dashboard ppt design. This is a three stage process. The stages in this process are series, qtr.
-
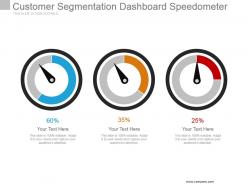 Customer segmentation dashboard speedometer powerpoint slide
Presenting customer segmentation dashboard speedometer powerpoint slide. This is a customer segmentation dashboard speedometer powerpoint slide. This is a three stage process. The stages in this process are dashboard, measurement, business, strategy, success.
-
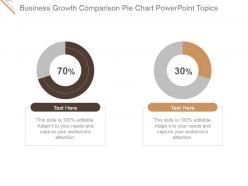 Business growth comparison pie chart powerpoint topics
Presenting business growth comparison pie chart powerpoint topics. This is a business growth comparison pie chart powerpoint topics. This is a two stage process. The stages in this process are business, meter, measure, growth, comparison.
-
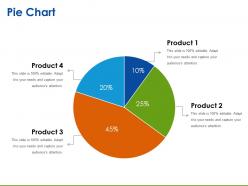 Pie chart ppt sample download
Presenting pie chart ppt sample download. This is a pie chart ppt sample download. This is a four stage process. The stages in this process are pie chart, finance, analysis, marketing, strategy, business.
-
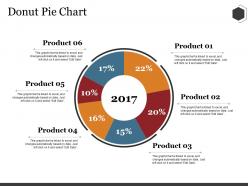 Donut pie chart ppt summary rules
Presenting this set of slides with name - Donut Pie Chart Ppt Summary Rules. This is a six stage process. The stages in this process are Business, Percentage, Years, Marketing, Chart.
-
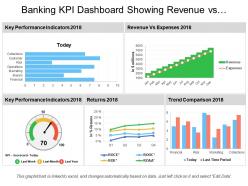 Banking kpi dashboard showing revenue vs expenses and returns
Presenting this set of slides with name - Banking Kpi Dashboard Showing Revenue Vs Expenses And Returns. This is a five stage process. The stages in this process are Banking, Finance, Money.
-
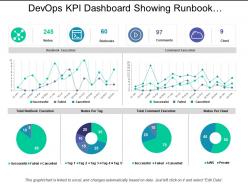 Devops kpi dashboard showing runbook execution and command execution
Presenting this set of slides with name - Devops Kpi Dashboard Showing Runbook Execution And Command Execution. This is a six stage process. The stages in this process are Development And Operations, Devops.
-
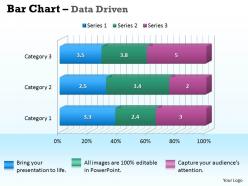 Data driven 3d bar chart for business information powerpoint slides
We are proud to present our data driven 3d bar chart for business information powerpoint slides. The above template shows data driven bar chart.This ppt diagram is simple and practical techniques that have helped the leading people in business, sport and public service reach the pinnacles of their careers.
-
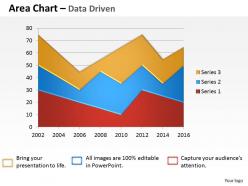 Data driven visualization area chart powerpoint slides
We are proud to present our data driven visualization area chart powerpoint slides. This PowerPoint chart helps people understand data quickly. Whether you want to make a comparison, show a relationship, or highlight a trend, it helps your audience to see what you are talking about.
-
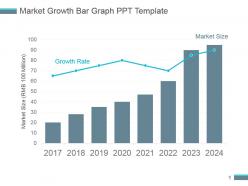 Market growth bar graph ppt template
Presenting market growth bar graph ppt template. This is a market growth bar graph ppt template. This is a eight stage process. The stages in this process are market size, growth rate.
-
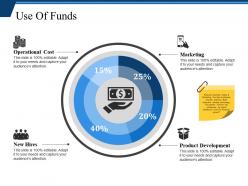 Use of funds powerpoint slide templates download
Presenting this set of slides with name - Use Of Funds Powerpoint Slide Templates Download. This is a four stage process. The stages in this process are Operational Cost, Marketing, New Hires, Product Development.
-
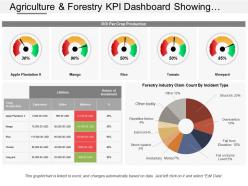 Agriculture and forestry kpi dashboard showing roi per crop production and industry claim count
Presenting agriculture and forestry KPI dashboard showing ROI per crop production and industry claim count PowerPoint slide. Unaffected high-resolution PowerPoint slide. Include or exclude slide content as per your individual need. Personalize the presentation with individual company name and logo. Beneficial for industry professionals, managers, executives, researchers, sales people, etc. This template is available in both Standard and Widescreen slide size. Easy and quick downloading process. Flexible option for conversion in PDF or JPG formats. Compatible with Google slides.
-
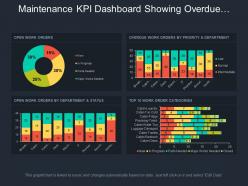 Maintenance kpi dashboard showing overdue work orders by priority and department
Presenting this set of slides with name - Maintenance Kpi Dashboard Showing Overdue Work Orders By Priority And Department. This is a four stage process. The stages in this process are Maintenance, Preservation, Conservation.
-
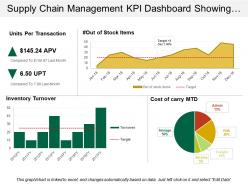 Supply chain management kpi dashboard showing units per transaction
Presenting predesigned Supply Chain Management KPI Dashboard Showing Warehouse Operating Costs PPT slide. Download of the template design is simple. You can modify the layout font type, font size, colors and the background as per needs. Template slide is fully flexible with Google Slides and other online software’s. You can alter the design using the instructional slides provided with the template. You can remove the watermark with your brand name, trademark, signature or logo. You can save the template into PNG or JPEG formats. Supreme quality layouts are used to create this template which is editable in PowerPoint. Sample content can be replaced with your presentation content.
-
 Transportation kpi dashboard snapshot showing fleet delivery status loading time and weight
Presenting transportation KPI dashboard snapshot showing fleet delivery status loading time and weight PPT slide. Simple data input with linked Excel chart, just right click to input values. This PowerPoint theme is fully supported by Google slides. Picture quality of these slides does not change even when project on large screen. Fast downloading speed and formats can be easily changed to JPEG and PDF applications. This template is suitable for marketing, sales persons, business managers and entrepreneurs.
-
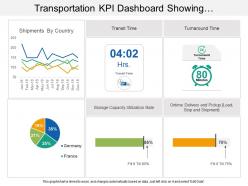 Transportation kpi dashboard showing shipments by country and transit time
Presenting transportation KPI Dashboard showing shipments by country and transit time PPT slide. This deck offers you plenty of space to put in titles and subtitles. This template is Excel linked just right click to input your information. High resolution based layout, does not change the image even after resizing. This presentation icon is fully compatible with Google slides. Quick downloading speed and simple editing options in color text and fonts.PPT icons can easily be changed into JPEG and PDF applications
-
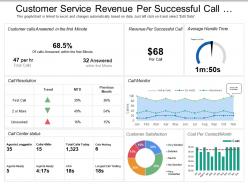 Customer service revenue per successful call dashboard
Presenting this set of slides with name - Customer Service Revenue Per Successful Call Dashboard. This is a three stage process. The stages in this process are Customer Base, Recurring Customers, Customer Services.
-
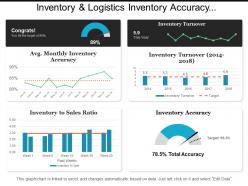 Inventory and logistics inventory accuracy dashboards
Presenting this set of slides with name - Inventory And Logistics Inventory Accuracy Dashboards. This is a four stage process. The stages in this process are Inventory And Logistics, Inventory Management, Warehousing And Inventory Management.
-
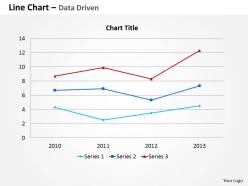 Data driven line chart for business information powerpoint slides
We are proud to present our data driven line chart for business information powerpoint slides. Our Data Driven Line Chart For Business Information Powerpoint Slides Power Point Templates Are Endowed To Endure. Ideas Conveyed Through Them Will Pass The Test Of Time. Bait Your Audience With Our Data Driven Line Chart For Business Information Powerpoint Slides Power Point Templates. They Will Bite The Hook Of Your Ideas In Large Numbers.
-
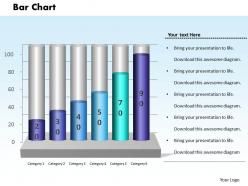 0414 percentage growth column chart powerpoint graph
Presentation slide supports changing the color, size and orientation of any icon to your liking. It’s easy for the PPT design to run smoothly on any software. All images are 100% editable in the presentation visual. Best feature being the conversion of presentation slide show to PDF or JPG format. Can be used by businesses of all sizes. Offers high resolution without compromising on pixels quality in PPT layout when viewed on a larger screen. Compatible with Google slides.
-
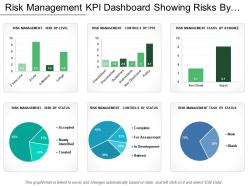 Risk Management Kpi Dashboard Showing Risks By Level Assignee And Status
Presenting this set of slides with name - Risk Management Kpi Dashboard Showing Risks By Level Assignee And Status. This is a six stage process. The stages in this process are Risk Management, Risk Assessment, Project Risk.
-
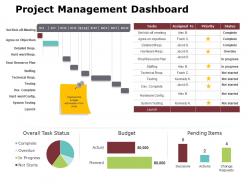 Project management dashboard ppt powerpoint presentation gallery display
Presenting this set of slides with name - Project Management Dashboard Ppt Powerpoint Presentation Gallery Display. This is a two stage process. The stages in this process are Business, Management, Strategy, Analysis, Marketing.
-
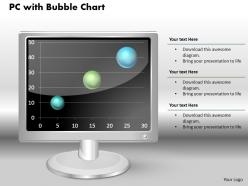 0414 bubble chart pc display design powerpoint graph
We are proud to present our 0414 bubble chart pc display design powerpoint graph. Our 0414 Bubble Chart PC Display Design Powerpoint Graph Powerpoint Templates come in all colours shades and hues. They help highlight every nuance of your views. Our 0414 Bubble Chart PC Display Design Powerpoint Graph Powerpoint Templates will fulfill your every need. Use them and effectively satisfy the desires of your audience.


