- Sub Categories
-
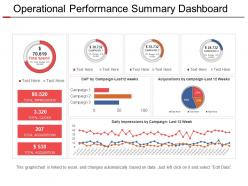 Operational performance summary dashboard presentation design
Presenting operational performance summary dashboard presentation design PowerPoint slide. This deck offers you plenty of space to put in titles and sub titles. High resolution-based layout does not change the image even after resizing. This presentation icon is fully compatible with Google slides. Quick downloading speed and simple editing options in color text and fonts.PPT icons can easily be changed into JPEG and PDF applications. This diagram has been designed for entrepreneurs, corporate and business managers. Easy to use, edit and you can design attractive slides within few minutes.
-
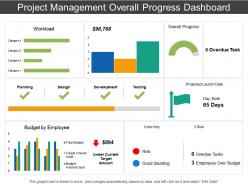 Project management overall progress dashboard
Preference to amend and personalize the PPT slide by adding business details i.e. name, logo, image or even tag line. Quick download and can be shared with large audience. Staggering balance colors, font and shape. Comparable Presentation design comes with different nodes and stages. Familiar with Google slides and easy to alter into JPEG and PDF.PPT diagram can be shared in both standard and widescreen view depending upon your requirement. High resolution and tremendous quality PowerPoint template
-
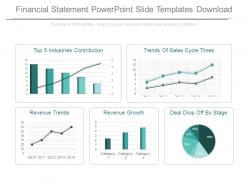 Financial statement powerpoint slide templates download
Presenting financial statement powerpoint slide templates download. This is a financial statement powerpoint slide templates download. This is a five stage process. The stages in this process are top 5 industries contribution, trends of sales cycle times, revenue trends, revenue growth, deal drop off by stage.
-
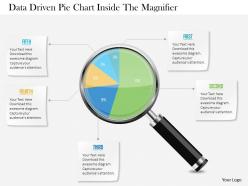 1214 data driven pie chart inside the magnifier powerpoint slide
Presenting, 1214 data-driven pie chart inside the magnifier PowerPoint slide. Hassle free, easy and fast download. Fully modifiable text as per your requirement. Modify the color design and contrast to suit the contextual requirement. Completely editable orientation and size of PPT icons. Enter your own company logo, tagline, watermark, trademark etc. to personalize. The steps in this process determine the objective, identify areas for improvement and much more. Can be projected on wide screens.
-
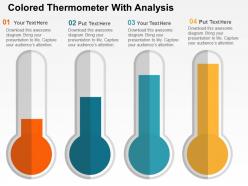 Colored thermometer with analysis powerpoint slides
The incorporation of these images with your presentations creates a perfect looking presentation. Numerous icons are offered to include in the presentation. The appearance of these can be altered by changing the colours and the content. All the vital business aspects are very well covered in these slides. They have easy and error free downloading.
-
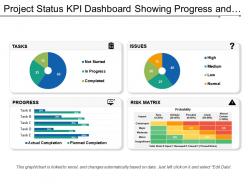 Project status kpi dashboard snapshot showing progress and risk matrix
Presenting project status KPI dashboard snapshot showing progress and risk matrix PowerPoint template. Simple data input like company logo, name or trademark. This PowerPoint theme is fully supported by Google slides. Picture quality of these slides does not change even when projected on large screen. This formats can be easily changed to JPEG and PDF applications. This template is suitable for marketing, sales persons, business managers and entrepreneurs. Adjust PPT layout, font, text and color as per your necessity
-
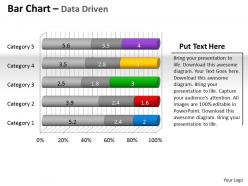 Data driven 3d bar chart to put information powerpoint slides
We present to you this data driven 3D bar chart to put information PowerPoint slides. As the PPT presentation is fully editable you can change the font size, font style and the font color used in the pre-designed slides. You can save the presentation in JPG or PDF format. The slides can also be viewed in standard size display ratio of 4:3 or widescreen display ratio of 16:9. The template is compatible with Google slides, which makes it even easier to use.
-
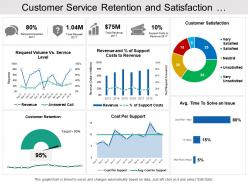 Customer service retention and satisfaction dashboard
Presenting this set of slides with name - Customer Service Retention And Satisfaction Dashboard. This is a six stage process. The stages in this process are Customer Base, Recurring Customers, Customer Services.
-
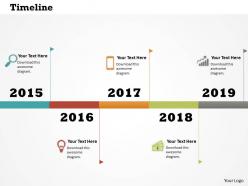 0514 colored graphic data driven time line diagram powerpoint slides
Easy editing and proofing. Offers modification in font, color and orientation. Compatible with Microsoft 2010 and 2013 versions. PPT visual offers high color resolution. PowerPoint presentation is beneficial for sales, stock market, entrepreneurs and students. PPT slide supports widescreen or standard screen option.
-
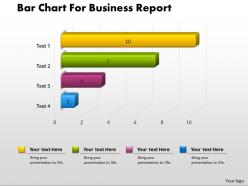 0414 bar chart for business report powerpoint graph
Edit and modify it the way you want to. Replace the icons images and enter the content in the provided text spaces. Download and save instantly. Use your brand’s name at the place of watermark and make it your own slide template. No effect on picture quality when opened on a big screen. Beneficial for the Business presenters and marketing professionals.
-
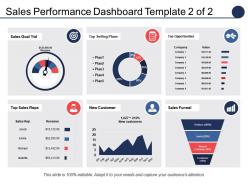 Sales Performance Dashboard Top Selling Plans Top Opportunities
Presenting sales performance dashboard top selling plans top opportunities PPT template. Completely amendable by any user at any point of time without any hassles. Error free performance to put an everlasting impression on the viewers. Great for incorporating business details such as name, logo and trademark. Can be utilized by students, entrepreneurs, investors and customers. Professionally designed presentation slides. Personalize the presentation with individual company name and logo. Available in both Standard and Widescreen slide size.
-
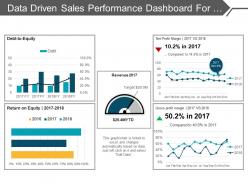 Data driven sales performance dashboard for achieving sales target ppt slides
Presenting a PPT slide named Data driven sales performance dashboard for achieving sales target PPT slides. This PPT slide is Excel driven and easily customizable. The font style, the font color and the font size can be easily edited by a mere click. Access this presentation easily anywhere as it is compatible with Google slides. You can convert and save this slide in PDF or JPG formats. Add or delete content from the given slide as per your convenience. You can add icons to make it more impressive. You can choose from thousands of high quality icons. Download and enjoy the professionally designed PPT slide.
-
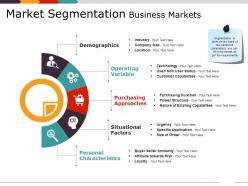 Market segmentation business markets ppt examples
Presenting Market Segmentation Business Markets PPT Examples PowerPoint slide. You can download and save this PowerPoint layout in different formats like PDF, PNG and JPG. This PPT theme is available in both 4:3 and 16:9 aspect ratios. As this PowerPoint template is 100% editable, you can modify color, font size, font type, and shapes as per your requirements. This PPT presentation is Google Slides compatible hence it is easily accessible.
-
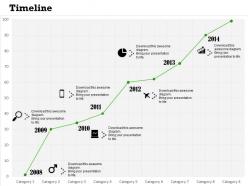 0514 business growth analysis time line diagram powerpoint slides
High resolution visuals. No fear of image pixilation when output is viewed on large screen. Ease of executing changes as it is thoroughly editable. Thoroughly editable slide design visual. Easy to customize and personalize the presentation with company specific name, logo and trademark. Thoroughly editable slide design model. Ease of addition and deletion of content, Guidance for marking changes has been provided in pictorial form.
-
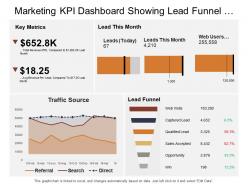 Marketing kpi dashboard snapshot showing lead funnel traffic sources key metrics
Presenting this set of slides with name - Marketing Kpi Dashboard Snapshot Showing Lead Funnel Traffic Sources Key Metrics. This is a three stage process. The stages in this process are Marketing, Branding, Promoting.
-
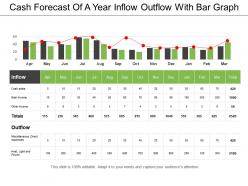 Cash forecast of a year inflow outflow with bar graph
Presenting cash forecast of a year inflow outflow with bar graph. This is a cash forecast of a year inflow outflow with bar graph. This is a two stage process. The stages in this process are cash forecast, cash flow, money forecast, fund forecast.
-
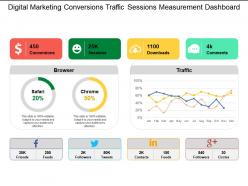 Digital marketing conversions traffic sessions measurement dashboard
Presenting digital marketing conversions traffic sessions measurement dashboard. This is a digital marketing conversions traffic sessions measurement dashboard. This is a four stage process. The stages in this process are digital marketing, digital marketing dashboard, digital marketing funnel.
-
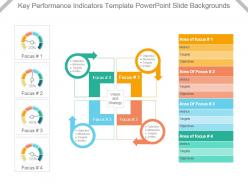 Key performance indicators template powerpoint slide backgrounds
Excellent use colors in the presentation template. Imaginatively created PowerPoint shape with modification options. Easily adjustable PPT slide as can be converted into JPG and PDF format. Conforming designs accessible to different nodes and stages. Great pixel quality as image quality remains relentless on every screen size. Choice to reveal slide in standard 4:3 widescreen 16:9 view. Presentation graphic suitable with Google slides. Fast download saves valuable time. Makes it easier to share the information with ease with large set of viewers. Easy to portray the KRAs related to the work.
-
 Human resources kpi dashboard showing employee number by salary staff composition
Presenting this set of slides with name - Human Resources Kpi Dashboard Showing Employee Number By Salary Staff Composition. This is a four stage process. The stages in this process are Human Resource, Hrm, Human Capital.
-
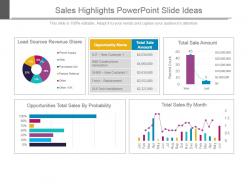 Sales highlights powerpoint slide ideas
Presenting sales highlights powerpoint slide ideas. This is a sales highlights powerpoint slide ideas. This is a five stage process. The stages in this process are lead sources revenue share, opportunity name, total sale amount, total sale amount, opportunities total sales by probability, total sales by month.
-
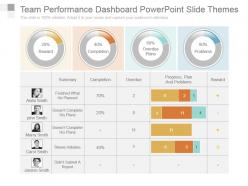 Team performance dashboard powerpoint slide themes
Presenting team performance dashboard powerpoint slide themes. This is a team performance dashboard powerpoint slide themes. This is a four stage process. The stages in this process are summary, completion, overdue, progress, plan and problems, reward, finished what he planned, doesnt complete his plans, doesnt complete his plans, shows initiative, didnt submit a report.
-
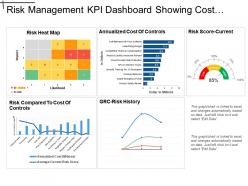 Risk Management Kpi Dashboard Showing Cost Of Control And Risk Score
Presenting this set of slides with name - Risk Management Kpi Dashboard Showing Cost Of Control And Risk Score. This is a five stage process. The stages in this process are Risk Management, Risk Assessment, Project Risk.
-
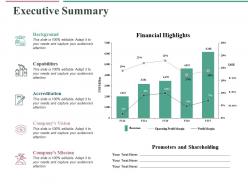 Executive summary ppt professional display
Presenting this set of slides with name - Executive Summary Ppt Professional Display. This is a five stage process. The stages in this process are Bar Chart, Marketing, Strategy, Planning, Finance.
-
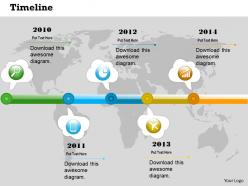 0514 global business data driven time line diagram powerpoint slides
Presentation slide is beneficial for clients, managers, project in charge, financial sector and business conferences. Color, style and position can be standardized, supports font size which can be read from a distance. PPT slide is compatible with Microsoft 2010 and 2013 versions. Text and graphics can be placed on the slide. PPT diagram 100% compatible with Google slide.
-
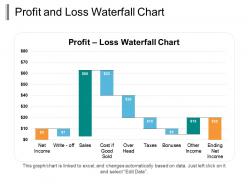 Profit and loss waterfall chart ppt infographic template
Presenting the Profit And Loss Waterfall Chart PPT Infographic Template. You can edit this template in PowerPoint. The PPT layout is customizable. You can link the slide to your excel sheet and the graph will change accordingly. The slide is available in both standard and wide screen formats. You can change the colors of the chart and bars and the background as well to suit your needs. So go ahead and make your presentation with a few clicks.
-
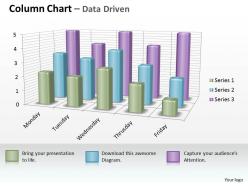 Data driven 3d business inspection procedure chart powerpoint slides
Presenting, data driven 3d business inspection procedure chart PowerPoint slides. High-resolution PPT slides to address the inspection procedure formation. The content is authoritative and ready to use. Modifiable background, color, layout, and font style and font type. Can be quickly converted into PDF and JPG format. The appealing layout for comparison and captivating figures to demonstrate the concept. Compatible with google slides and can be converted into pdf or jpeg format as per the need.
-
 Sliding scale for business report powerpoint show
Presenting sliding scale for business report powerpoint show. This is a sliding scale for business report powerpoint show. This is a five stage process. The stages in this process are business, scale, process, strategy, management.
-
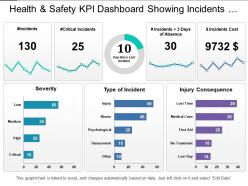 Health and safety kpi dashboard showing incidents severity and consequences
Presenting the health and safety PPT slide. This PPT slide is fully editable and is designed by professionals looking for a professional presentation. You can edit the objects in the slide like font size and font color easily. This presentation slide is fully compatible with Google Slide and can be saved in JPG or PDF file format easily. Click on the download button below.
-
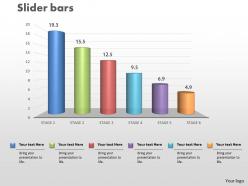 0414 slider column chart data series powerpoint graph
High resolution graphics. PPT slide can be presented in both standard and widescreen view. Completely editable slide as colors, icons, and text can be change as per the need. Quick download. Effortless addition of company name, trademark/ logo. PPT templates are well-harmonized with Google slides. Excel linked design so you can make changes in the excel sheet and the design will change accordingly. Beneficial for business owners, marketers, shareholders, financiers, investors, entrepreneurs.
-
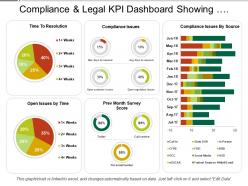 Compliance and legal kpi dashboard showing compliance issues and resolution time
Presenting this set of slides with name - Compliance And Legal Kpi Dashboard Showing Compliance Issues And Resolution Time. This is a three stage process. The stages in this process are Compliance And Legal, Legal Governance, Risk Management.
-
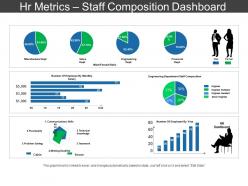 Hr metrics staff composition dashboard sample ppt files
Presenting HR Metrics Staff Composition Dashboard Sample PPT Files which is completely editable. You can open and save your presentation in various formats like PDF, JPG, and PNG. Freely access this template in both 4:3 and 16:9 aspect ratio. Change the color, font, font size, and font type of the slides as per your requirements. This template is adaptable with Google Slides which makes it easily accessible at once.
-
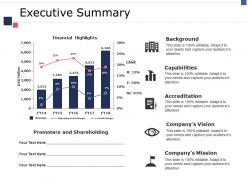 Executive summary ppt pictures icon
Presenting this set of slides with name - Executive Summary Ppt Pictures Icon. This is a five stage process. The stages in this process are Financial Highlights, Background, Capabilities, Accreditation, Usd Million.
-
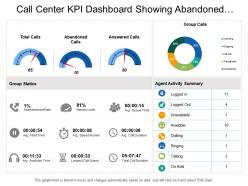 Call center kpi dashboard showing abandoned calls group calls group statistics
Presenting this set of slides with name - Call Center Kpi Dashboard Showing Abandoned Calls Group Calls Group Statistics. This is a four stage process. The stages in this process are Call Center Agent, Customer Care, Client Support.
-
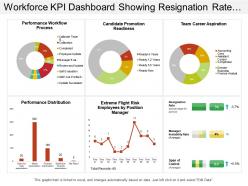 Workforce kpi dashboard showing resignation rate manager instability rate and performance workflow process
Presenting this set of slides with name - Workforce Kpi Dashboard Showing Resignation Rate Manager Instability Rate And Performance Workflow Process. This is a six stage process. The stages in this process are Staff, Personnel, Workforce.
-
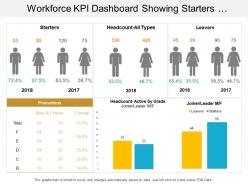 Workforce kpi dashboard showing starters headcount leavers promotions and joiners
Presenting this set of slides with name - Workforce Kpi Dashboard Showing Starters Headcount Leavers Promotions And Joiners. This is a three stage process. The stages in this process are Staff, Personnel, Workforce.
-
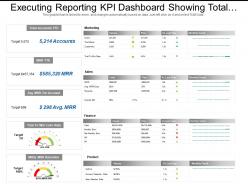 Executing reporting kpi dashboard showing total accounts marketing sales finance
Presenting this set of slides with name - Executing Reporting Kpi Dashboard Showing Total Accounts Marketing Sales Finance. This is a four stage process. The stages in this process are Executive Reporting, Executive Analysis, Executive Performance.
-
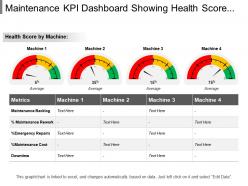 Maintenance kpi dashboard showing health score by machine
Presenting maintenance KPI dashboard showing health score by machine PowerPoint slide. This PPT slide offers you plenty of space to put in titles and sub titles. High resolution based presentation layout, does not change the image even after resizing. This presentation icon is fully compatible with Google slides. Quickly downloads and simple editing options in color text and fonts. Can easily be changed into JPEG and PDF applications. This diagram has been designed for entrepreneurs, corporate and business managers.
-
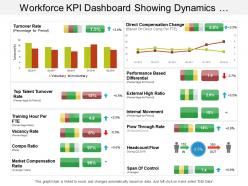 Workforce kpi dashboard showing dynamics structure and span of control
Presenting this set of slides with name - Workforce Kpi Dashboard Showing Dynamics Structure And Span Of Control. This is a two stage process. The stages in this process are Staff, Personnel, Workforce.
-
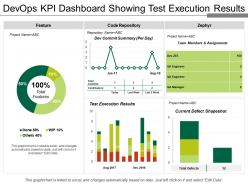 Devops kpi dashboard showing test execution results
Presenting this set of slides with the name DevOps Kpi Dashboard Showing Test Execution Results. This set of slides contains information about the important process of the DevOps Kpi dashboard that are Features, code repository, zephyr, Test execution results, and current defect Shapeshot. This is a completely editable PowerPoint presentation and is available for immediate download. Download now and impress your audience.
-
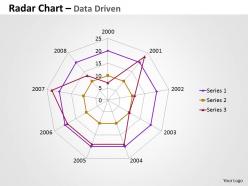 Data driven chart comparing multiple entities powerpoint slides
Presenting data driven chart comparing multiple entities PPT slide. Makes the information clear in the mind of the audience. Editable visuals, colors and text. Easy to edit and customize as per your needs. Beneficial for industry professionals, technologists, managers, executives, researchers, sales people, etc. Flexible presentation designs can be presented in standard and widescreen view. Has a futuristic and realistic approach. Privilege of insertion of logo and trademarks for more personalization. Easy to download and save. Highly beneficial PowerPoint Slide for highlighting radar charts.
-
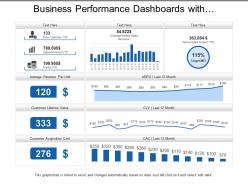 Business performance dashboards with average revenue and customer lifetime value
Presenting, our business performance dashboards with average revenue and customer lifetime value PPT template. You can download this engaging PPT template and take a report of the full version of this PPT deck which includes editing the text, adjusting the colors according to your liking, watermark gets expelled, include your company's logo and get slides in widescreen version.
-
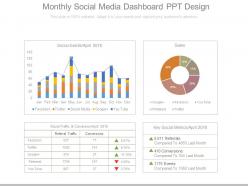 Monthly social media dashboard snapshot ppt design
Presenting monthly social media dashboard snapshot ppt design. This is a monthly social media dashboard ppt design. This is a four stage process. The stages in this process are social events, sales, social traffic and conversion, key social metrics, referrals, conversions, events.
-
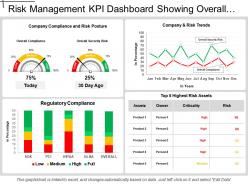 Compliance and legal kpi dashboard showing regulatory compliance
Presenting this set of slides with name - Compliance And Legal Kpi Dashboard Showing Regulatory Compliance. This is a four stage process. The stages in this process are Compliance And Legal, Legal Governance, Risk Management.
-
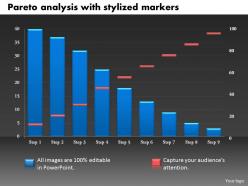 0414 pareto analysis column chart with stylized markers powerpoint graph
High-resolution images and the slide icons. Allow saving in the multiple formats like JPG or PDF format. Easy to edit and customize the content or the slide icons. 100% access to edit the background, style and orientation of the slide icons once downloaded. Provided guidance to customize the background or the slide icons content. Beneficial for the business leaders, sales and marketing professionals.
-
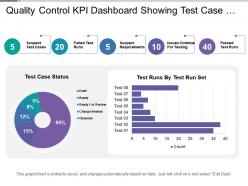 Quality control kpi dashboard showing test case status
Presenting this set of slides with name - Quality Control Kpi Dashboard Showing Test Case Status. This is a two stage process. The stages in this process are Quality Management, Quality Control, Quality Assurance.
-
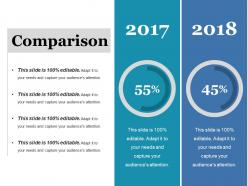 Comparison ppt file themes
Presenting this set of slides with name - Comparison Ppt File Themes. This is a two stage process. The stages in this process are Finance, Business, Year, Comparison, Donut.
-
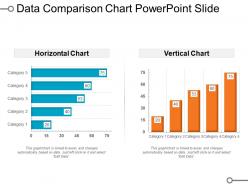 Data comparison chart powerpoint slide
Presenting data comparison chart PowerPoint slide presentation template. You can download this slide and then save into another format such as JPG and PDF and can also display in standard and widescreen view. A user can alter this slide such as color, text, font type, font size and aspect ratio. This slide gets synced with Google Slides, Excel sheet and edit in PowerPoint. You may share this template with large segment because it has great pixel quality. You can insert the relevant content in text placeholder of this slide.
-
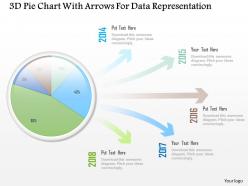 1214 3d pie chart with arrows for data representation powerpoint slide
The PPT images offer compatibility with Google templates. High resolution icons for clear message delivery. An easy access to make the desired changes or edit it anyways. Wide screen view of the slides. Easy conversion into Jpeg or Pdf format. Unique and informational content. Valuable for business professionals, sales representatives, marketing professionals, students and selling investigators.
-
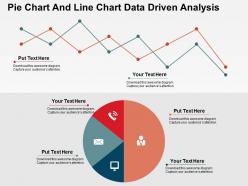 Pie chart and line chart data driven analysis powerpoint slides
PowerPoint Template for professionals for pie chart and line chart data driven analysis. Highly beneficial for professionals from diverse companies. Editable charts, colors and text. Adequate space available in each PowerPoint slide to insert text as desired. Manual option available to alter color or PowerPoint image. Simply click to add company logo, trademark or name.
-
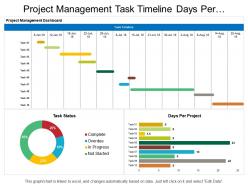 Project management task timeline days per project dashboard
Introducing project management task timeline days per project dashboard PPT template. Access to convert the presentation design into JPG and PDF. Offer 100% access to change the values, size and style of the slides once downloaded and saved in the desired format. High quality charts, images and visuals used in the designing process. Choice to get presentation slide in standard or in widescreen view. Easy to convert in JPEG and PDF document. Compatible with Google slides. Easy and hassle-free downloading process.
-
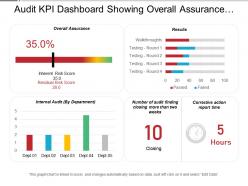 Audit kpi dashboard showing overall assurance internal audit and results
Presenting audit kpi dashboard showing overall assurance internal audit and results presentation slide. The PPT layout is extremely easy to understand as it enables you to roll out various improvements to the editable slides. You can change the text dimension, textual style and furthermore the textual style shading according to your prerequisites. Layout slide can be downloaded rapidly and taxi be spared in configuration of PDF or JPG effectively. The format slide in the wake of being downloaded can be seen in extensive screen show proportion of 16:9 or standard size presentation proportion of 4:3.
-
 0514 3d graphic of dollar bag powerpoint slides
The PPT images offer compatibility with Google templates. High resolution icons for clear message delivery. An easy access to make the desired changes or edit it anyways. Wide screen view of the slides. Easy conversion into JPG or PDF format. Unique and informational content. Valuable for business professionals, sales representatives, marketing professionals and finance managers.
-
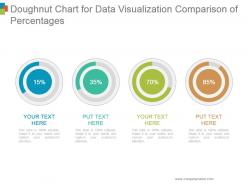 Doughnut chart for data visualization comparison of percentages powerpoint slides design
Presenting doughnut chart for data visualization comparison of percentages powerpoint slides design. This is a doughnut chart for data visualization comparison of percentages powerpoint slides design. This is a four stage process. The stages in this process are business, marketing, financial, percentage, increase.
-
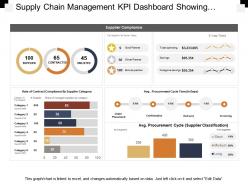 Supply chain management kpi dashboard showing supplier compliance stats
Presenting this set of slides with name - Supply Chain Management Kpi Dashboard Showing Supplier Compliance Stats. This is a four stage process. The stages in this process are Demand Forecasting, Predicting Future Demand, Supply Chain Management.
-
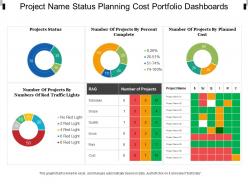 Project name status planning cost portfolio dashboards
Introducing project name status planning cost portfolio dashboards PPT template. Presentable and easy to comprehend visual graphic. The presentation template can be downloaded and saved in any desired format. Valuable for the business presenters and entrepreneurs as they can showcase their business success in a creative way. Privilege of insertion of logo and trademarks for more personalization. Adaptable to wide screen view without the problem of pixilation. Can be used with Google slides. Beneficial for industry professionals, managers, executives, researchers, sales people, etc.
-
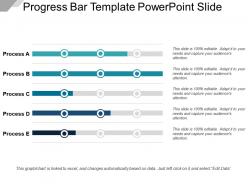 Progress bar template powerpoint slide
Presenting Progress Bar Template Powerpoint Slide.The designs are 100% editable in this PowerPoint template. The font size, font color, graphic colors, and slide background can be customized without any hassle. The users can add or remove the text according to their needs. This template includes a progress bar template which is designed by keeping compatibility with Google Slides in mind. It is available in both standard and widescreen size.
-
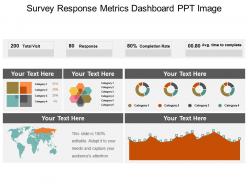 Survey response metrics dashboard snapshot ppt image
Presenting survey response metrics dashboard snapshot PPT image PPT presentation which is 100% editable. This PPT template is crafted with attractive display and unique components. This PPT slide is easy to customize and enables you to personalize it as per your own criteria. The presentation slide is fully compatible with Google slides, multiple format and software options. In case of any assistance, kindly take instructions from our presentation design services and it is easy to download in a very short span of time. The images, layouts, designs are of high quality and ensures quality in widescreen.
-
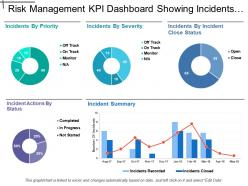 Risk Management Kpi Dashboard Showing Incidents By Priority And Severity
Presenting this set of slides with name - Risk Management Kpi Dashboard Showing Incidents By Priority And Severity. This is a four stage process. The stages in this process are Risk Management, Risk Assessment, Project Risk.
-
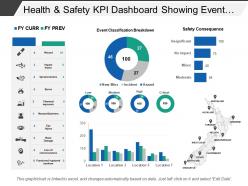 Health and safety kpi dashboard showing event classification breakdown
Presenting the modern dashboard PPT template. This dashboard PPT design is 100% editable and is created by professionals. You can bring changes to the objects in the template like font size and font color very easily. This presentation slide is fully compatible with Google Slide and can be saved in JPG or PDF file format without any hassle. Fast download this at the click of the button.
-
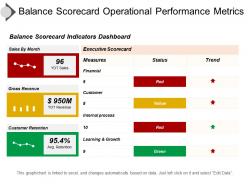 Balance scorecard operational performance metrics ppt icon
Presenting Balance Scorecard Operational Performance Metrics Ppt Icon. You can save it into other formats like JPG & PDF after downloading this slide. You can easily represent the design in the standard or widescreen view. The template is compatible with Google Slides and editable in PowerPoint too. You can do modification in the color, text, font size, font type, diagram and aspect ratio of this slide. Sharing the template with a large segment become easy because of its splendid pixel quality. A user can easily add the related information in text placeholder of this slide.


