Pitch deck slide key metrics presentation images presentation layouts
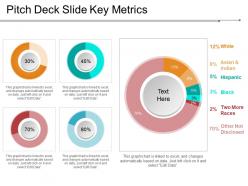
Evaluate your investment and profit using the Pitch deck slide key metrics presentation images presentation layout. Make use of donut chart and other measuring graphs to make the analysis easy. Infographics of such a high quality can add value as well as visual attraction to your business presentation. With this dashboard, you can display important information using charts and graphs. Communicate easily with your audience, making them easy to understand the basis of your presentation. Use this PPT template to put forth the finances involved in your business. Facilitate analytic data to your audience with our KPI measurement tool. Calculate the profits earned from various platforms in your company using our PPT analytical chart. With visuals and illustrations that we have offered in this PowerPoint template, you can put the desired impact on your people. Make a hassle-free presentation with this readily available professional PowerPoint template. Get this PPT dashboard to impress your audience with your comprehensive presentation. Indicate what the future can bring with our Pitch Deck Slide Key Metrics Presentation Images Presentation Layouts. Elaborate on the efforts afoot.
- Google Slides is a new FREE Presentation software from Google.
- All our content is 100% compatible with Google Slides.
- Just download our designs, and upload them to Google Slides and they will work automatically.
- Amaze your audience with SlideTeam and Google Slides.
-
Want Changes to This PPT Slide? Check out our Presentation Design Services
- WideScreen Aspect ratio is becoming a very popular format. When you download this product, the downloaded ZIP will contain this product in both standard and widescreen format.
-

- Some older products that we have may only be in standard format, but they can easily be converted to widescreen.
- To do this, please open the SlideTeam product in Powerpoint, and go to
- Design ( On the top bar) -> Page Setup -> and select "On-screen Show (16:9)” in the drop down for "Slides Sized for".
- The slide or theme will change to widescreen, and all graphics will adjust automatically. You can similarly convert our content to any other desired screen aspect ratio.
Compatible With Google Slides

Get This In WideScreen
You must be logged in to download this presentation.
PowerPoint presentation slides
Presenting the slide named Pitch deck slide key metrics presentation images presentation layouts. This template is professionally designed and is completely editable. The font color, font size, font style, background color, and color of the diagram can be altered as per your suitability. The text in the template can be replaced with your desired content. The slide is totally compatible with Google Slides and can be easily saved in JPG or PDF format. You can customize the template conveniently by changing the data in the excel sheet, as this template is Excel-linked. Editable icons make the presentation more presentable.
People who downloaded this PowerPoint presentation also viewed the following :
Content of this Powerpoint Presentation
Description:
The image showcases a PowerPoint slide with the title "Pitch Deck Slide Key Metrics," which includes four donut charts representing different key metrics. Each chart has a central label indicating a percentage, with a color-coded key that could represent various data points or categories. These types of charts are commonly used in presentations to visually display data proportions in a clear, easily digestible manner. The note below each chart mentions that the graph/chart is linked to Excel and updates automatically based on data, implying that these charts are dynamic and can be edited or updated by clicking and selecting 'Edit Data.'
Use Cases:
This slide is versatile and can be used across multiple industries for presentations requiring data visualization:
1. Finance:
Use: Illustrating financial distributions or company shareholding structures.
Presenter: Financial Analyst.
Audience: Investors, stakeholders.
2. Marketing:
Use: Displaying market segmentation or consumer demographics.
Presenter: Marketing Manager.
Audience: Marketing team, brand managers.
3. Human Resources:
Use: Showing employee demographics or diversity metrics.
Presenter: HR Specialist.
Audience: Company leadership, HR department.
4. Sales:
Use: Visualizing sales distributions across different regions or product categories.
Presenter: Sales Director.
Audience: Sales team, management.
5. Healthcare:
Use: Representing patient demographics or treatment efficacy rates.
Presenter: Healthcare Administrator.
Audience: Medical staff, healthcare providers.
6. Education:
Use: Demonstrating student enrollment statistics by program or demographics.
Presenter: Academic Researcher.
Audience: Educational board, faculty.
7. Technology:
Use: Portraying user engagement metrics or feature adoption rates for software products.
Presenter: Product Manager.
Audience: Development team, stakeholders.
Pitch deck slide key metrics presentation images presentation layouts with all 5 slides:
Encourage concerted action with our Pitch Deck Slide Key Metrics Presentation Images Presentation Layouts. The group will follow a common agenda.
-
Informative design.
-
The content is very helpful from business point of view.


