- Sub Categories
-
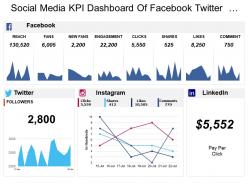 Social media kpi dashboard of facebook twitter instagram clicks followers
Presenting this set of slides with name - Social Media Kpi Dashboard Of Facebook Twitter Instagram Clicks Followers. This is a four stage process. The stages in this process are Social Media, Digital Marketing, Social Marketing.
-
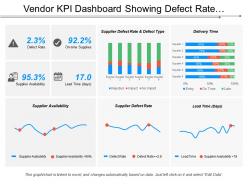 Vendor kpi dashboard showing defect rate on-time suppliers and lead time
Presenting this set of slides with name - Vendor Kpi Dashboard Showing Defect Rate On-Time Suppliers And Lead Time. This is a stage process. The stages in this process are Vendor, Supplier, Retailer.
-
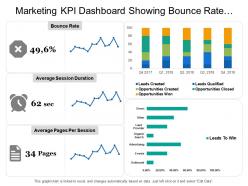 Marketing kpi dashboard showing bounce rate average session duration
Presenting this set of slides with name - Marketing Kpi Dashboard Showing Bounce Rate Average Session Duration. This is a three stage process. The stages in this process are Marketing, Branding, Promoting.
-
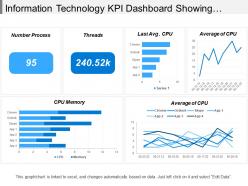 Information technology kpi dashboard showing cpu memory average of cpu
Presenting this set of slides with name - Information Technology Kpi Dashboard Showing Cpu Memory Average Of Cpu. This is a six stage process. The stages in this process are Information Technology, It, Iot.
-
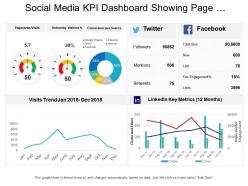 Social media kpi dashboard showing page viewsvisits conversion per source
Presenting this set of slides with name - Social Media Kpi Dashboard Showing Page Viewsvisits Conversion Per Source. This is a four stage process. The stages in this process are Social Media, Digital Marketing, Social Marketing.
-
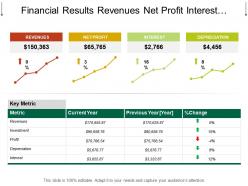 Financial results revenues net profit interest depreciation
Presenting, Financial Results Revenues Net Profit Interest Depreciation PowerPoint template. This presentation slide is beneficial for managers, employees, accountant, CA, finance manager, and organizations looking to project their business process through a flow chart. This presentation template is hundred percent editable, which means you can change the text, color, and view of the given template according to your desire. You can choose icons among the thousands of options accessible. This presentation slide is compatible with Google Slides. Ease of download and convert into jpeg or pdf format.
-
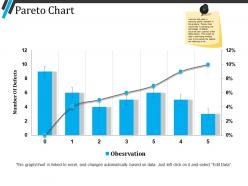 Pareto chart powerpoint templates
Presenting pareto chart powerpoint templates. This is a pareto chart powerpoint templates. This is a seven stage process. The stages in this process are pareto chart, business, growth, finance, analysis.
-
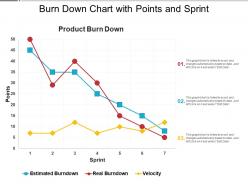 Burn down chart with points and sprint
Presenting this set of slides with name - Burn Down Chart With Points And Sprint. This is a three stage process. The stages in this process are Burn Down Chart, Agile Software Development Chart, Run Chart.
-
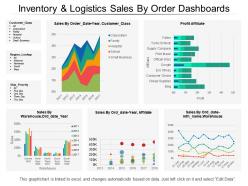 Inventory and logistics sales by order dashboards
Presenting this set of slides with name - Inventory And Logistics Sales By Order Dashboards. This is a five stage process. The stages in this process are Inventory And Logistics, Inventory Management, Warehousing And Inventory Management.
-
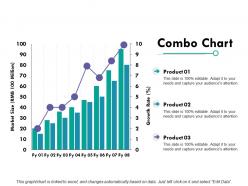 Combo chart finance ppt powerpoint presentation diagram graph charts
Presenting this set of slides with name - Combo Chart Finance Ppt Powerpoint Presentation Diagram Graph Charts. This is a three stage process. The stages in this process are Combo Chart, Product, Growth Rate, Market Size, Finance.
-
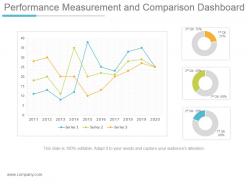 Performance measurement and comparison dashboard snapshot ppt design
Presenting performance measurement and comparison dashboard snapshot ppt design. This is a performance measurement and comparison dashboard ppt design. This is a three stage process. The stages in this process are series, qtr.
-
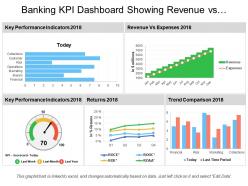 Banking kpi dashboard showing revenue vs expenses and returns
Presenting this set of slides with name - Banking Kpi Dashboard Showing Revenue Vs Expenses And Returns. This is a five stage process. The stages in this process are Banking, Finance, Money.
-
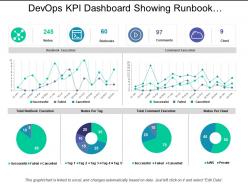 Devops kpi dashboard showing runbook execution and command execution
Presenting this set of slides with name - Devops Kpi Dashboard Showing Runbook Execution And Command Execution. This is a six stage process. The stages in this process are Development And Operations, Devops.
-
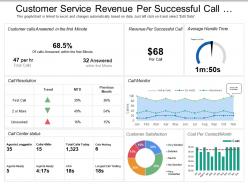 Customer service revenue per successful call dashboard
Presenting this set of slides with name - Customer Service Revenue Per Successful Call Dashboard. This is a three stage process. The stages in this process are Customer Base, Recurring Customers, Customer Services.
-
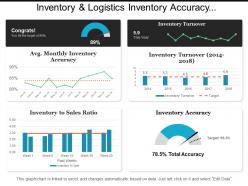 Inventory and logistics inventory accuracy dashboards
Presenting this set of slides with name - Inventory And Logistics Inventory Accuracy Dashboards. This is a four stage process. The stages in this process are Inventory And Logistics, Inventory Management, Warehousing And Inventory Management.
-
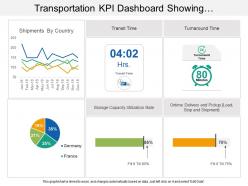 Transportation kpi dashboard showing shipments by country and transit time
Presenting transportation KPI Dashboard showing shipments by country and transit time PPT slide. This deck offers you plenty of space to put in titles and subtitles. This template is Excel linked just right click to input your information. High resolution based layout, does not change the image even after resizing. This presentation icon is fully compatible with Google slides. Quick downloading speed and simple editing options in color text and fonts.PPT icons can easily be changed into JPEG and PDF applications
-
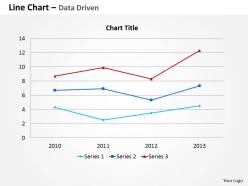 Data driven line chart for business information powerpoint slides
We are proud to present our data driven line chart for business information powerpoint slides. Our Data Driven Line Chart For Business Information Powerpoint Slides Power Point Templates Are Endowed To Endure. Ideas Conveyed Through Them Will Pass The Test Of Time. Bait Your Audience With Our Data Driven Line Chart For Business Information Powerpoint Slides Power Point Templates. They Will Bite The Hook Of Your Ideas In Large Numbers.
-
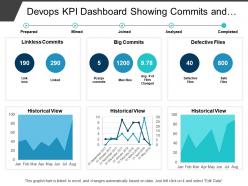 Devops kpi dashboard showing commits and defective files
Presenting this set of slides with name - Devops Kpi Dashboard Showing Commits And Defective Files. This is a six stage process. The stages in this process are Development And Operations, Devops.
-
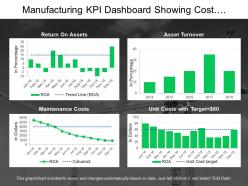 Manufacturing kpi dashboard showing cost management and asset turnover
Presenting this set of slides with name - Manufacturing Kpi Dashboard Showing Cost Management And Asset Turnover. This is a four stage process. The stages in this process are Manufacturing, Production, Manufacture.
-
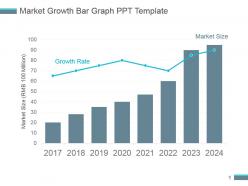 Market growth bar graph ppt template
Presenting market growth bar graph ppt template. This is a market growth bar graph ppt template. This is a eight stage process. The stages in this process are market size, growth rate.
-
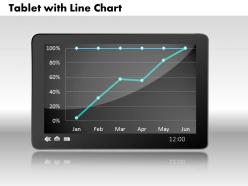 0414 tablate with line chart powerpoint graph
We are proud to present our 0414 tablate with line chart powerpoint graph. Our Tablate With Line Chart Powerpoint Graph Powerpoint Templates provide the pitch to bowl on. Mesmerise your audience with your guile. Our Tablate With Line Chart Powerpoint Graph Powerpoint Templates are stepping stones to success. Climb them steadily and reach the top.
-
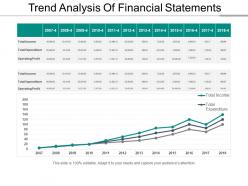 Trend analysis of financial statements powerpoint layout
Presenting a PowerPoint slide named Trend Analysis of Financial Statements PowerPoint Layout. This template with high-quality graphics is completely editable and professionally designed. With an option to change the size, style, and color of the font, this slide is ready to use. You can customize the text and color of the diagram as well as the background as per your discretion. The PPT slide is compatible with Google Slides, which makes it easily accessible. You can customize and save the file as JPG or PDF formats. Once the graph is linked to excel, it automatically changes based on the data.
-
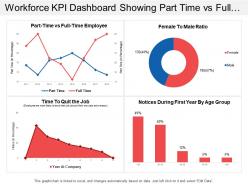 Workforce kpi dashboard showing part time vs full time employee
Presenting this set of slides with name - Workforce Kpi Dashboard Showing Part Time Vs Full Time Employee. This is a four stage process. The stages in this process are Staff, Personnel, Workforce.
-
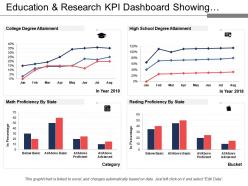 Education and research kpi dashboard showing degree attainment and proficiency
Presenting education and research KPI dashboard showing degree attainment and proficiency PPT slide. The educational degree attainment KPI report presentation slide designed by the professional team of SlideTeam. The education population analysis PPT template is fully editable in PowerPoint. The research status KPI report presentation template is compatible with Google Slide so a user can share this degree attainment metric dashboard slide with others. A user can make changes in the font size, font type, color as well as dimensions of the proficiency KPI dashboard PPT slide as per the requirement. You may edit the value in the education proficiency report slide as the slide gets linked with the Excel sheet.
-
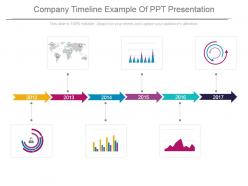 Company timeline example of ppt presentation
Presenting company timeline example of ppt presentation. This is a company timeline example of ppt presentation. This is a six stage process. The stages in this process are arrow, business, process, marketing, success, planning.
-
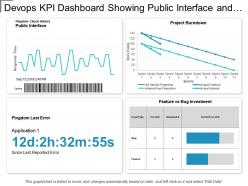 Devops kpi dashboard showing public interface and project burndown
Presenting this set of slides with name - Devops Kpi Dashboard Showing Public Interface And Project Burndown. This is a four stage process. The stages in this process are Development And Operations, Devops.
-
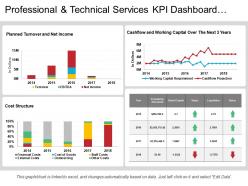 Professional and technical services kpi dashboard showing cost structure
Presenting this set of slides with name - Professional And Technical Services Kpi Dashboard Showing Cost Structure. This is a four stage process. The stages in this process are Professional And Technical Services, Services Management, Technical Management.
-
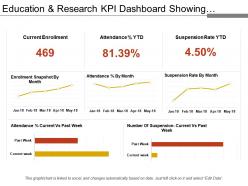 Education and research kpi dashboard showing attendance and suspension rate
Presenting education and research KPI dashboard showing attendance and suspension rate PPT slide. The suspension rate KPI dashboard PPT slide designed by the professional team of SlideTeam. The attendance rate report slide is 100% editable in PowerPoint. The attendance and detention KPI dashboard PowerPoint slide is compatible with Google Slide so a user can share this attendance rate dashboard slide with others. A user can make changes in the font size, font type, color as well as dimensions of the college acceptance rate dashboard PPT template as per the requirement. You may edit the value in the reporting tool KPI dashboard presentation template as the slide gets linked with the Excel sheet.
-
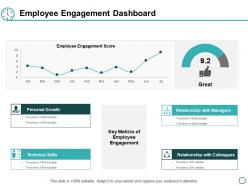 Employee engagement dashboard ppt powerpoint presentation layouts ideas
Presenting this set of slides with name - Employee Engagement Dashboard Ppt Powerpoint Presentation Layouts Ideas. This is a five stages process. The stages in this process are Personal Growth, Technical Skills, Relationship With Colleagues, Business, Management.
-
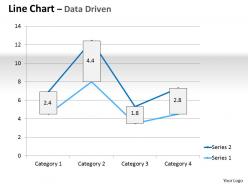 Data driven line chart market graph powerpoint slides
We are proud to present our data driven line chart market graph powerpoint slides. You Have Belief Am Faith In Your Futuristic Plans. Chalk Them Out For Your Team With Our Data Driven Line Chart Market Graph Powerpoint Slides Power Point Templates. Use Our Bewitching Data Driven Line Chart Market Graph Powerpoint Slides Power Point Templates. They Will Delight Your Audience With The Magic Of Your Words.
-
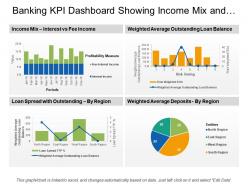 Banking kpi dashboard showing income mix and loan spread
Presenting this set of slides with name - Banking Kpi Dashboard Showing Income Mix And Loan Spread. This is a four stage process. The stages in this process are Banking, Finance, Money.
-
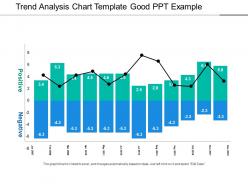 Trend analysis chart template good ppt example
Presenting Trend Analysis Chart Template Good Ppt Example. This PPT presentation is thoroughly researched by the experts and the slide consists of appropriate content that can be modified. It is fully customizable. You can add or delete the content as per your need. Not just this, you can also make the required changes in the texts and shapes. Download this professionally designed PPT, add your content and present it with confidence.
-
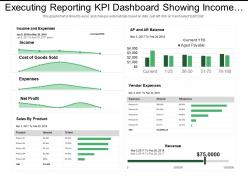 Executing reporting kpi dashboard snapshot showing income sales by product vendor expenses
Presenting this set of slides with name - Executing Reporting Kpi Dashboard Snapshot Showing Income Sales By Product Vendor Expenses. This is a four stage process. The stages in this process are Executive Reporting, Executive Analysis, Executive Performance.
-
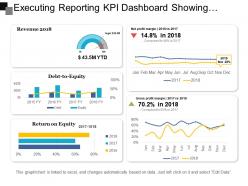 Executing reporting kpi dashboard showing revenue net profit margin debt to equity
Presenting this set of slides with name - Executing Reporting Kpi Dashboard Showing Revenue Net Profit Margin Debt To Equity. This is a five stage process. The stages in this process are Executive Reporting, Executive Analysis, Executive Performance.
-
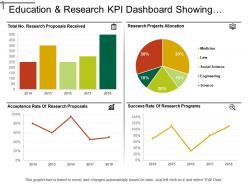 Education and research kpi dashboard showing research project allocation
Presenting education and research KPI dashboard showing research project allocation PPT slide. The project reporting design presentation template designed by professional team of SlideTeam. The research project PPT slide is fully customizable in PowerPoint. The project allocation dashboard PowerPoint slide is also compatible with Google Slide so a user can share this slide with others. A user can make changes in the font size, font type, color as well as dimensions of the allocated project report detail slide as per the requirement. You may edit the value in the education KPI dashboard PowerPoint template as the slide gets linked with the Excel sheet.
-
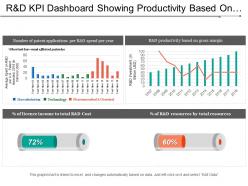 R and d kpi dashboard showing productivity based on gross margin
Presenting this set of slides with name - R And D Kpi Dashboard Showing Productivity Based On Gross Margin. This is a three stage process. The stages in this process are R And D, Research And Development, Research And Technological Development.
-
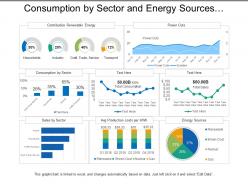 Consumption by sector and energy sources utilities dashboard
Presenting this set of slides with name - Consumption By Sector And Energy Sources Utilities Dashboard. This is a three stage process. The stages in this process are Utilities, Use, Advantage.
-
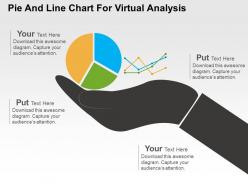 Pie and line chart for virtual analysis powerpoint slides
High resolution PPT example for pie and line chart for virtual analysis. Increase the level of personalization with your company logo and name. Compatible with all software and can be saved in any format. Useful tool for students, business analysts, sales people, sales managers and professionals of any industry. Precise and easy to comprehend information on PPT sample. Useful for marketing and business related presentations.
-
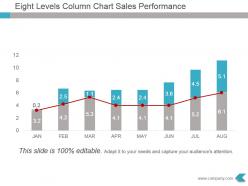 Eight levels column chart sales performance ppt diagram
Presenting eight levels column chart sales performance ppt diagram. This is a eight levels column chart sales performance ppt diagram. This is a eight stage process. The stages in this process are column, chart, sales, performance, growth.
-
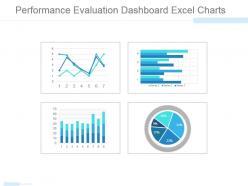 Performance evaluation dashboard excel charts powerpoint topics
Presenting performance evaluation dashboard excel charts powerpoint topics. This is a performance evaluation dashboard excel charts powerpoint topics. This is a four stage process. The stages in this process are graph, finance, dashboard, pie, business.
-
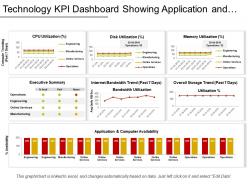 Technology kpi dashboard showing application and compute availability
Presenting this set of slides with name - Technology Kpi Dashboard Showing Application And Compute Availability. This is a seven stage process. The stages in this process are Technology, IT, IOT.
-
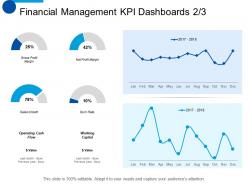 Financial management kpi dashboards snapshot planning ppt summary smartart
Presenting this set of slides with name - Financial Management KPI Dashboards Snapshot Planning Ppt Summary Smartart. This is a six stage process. The stages in this process are Sales Growth, Gross Profit Margin, Net Profit Margin, Planning, Marketing.
-
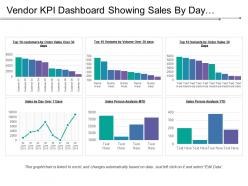 Vendor kpi dashboard showing sales by day sales person analysis top 10 customers by order value
Presenting this set of slides with name - Vendor Kpi Dashboard Showing Sales By Day Sales Person Analysis Top 10 Customers By Order Value. This is a six stage process. The stages in this process are Vendor, Supplier, Retailer.
-
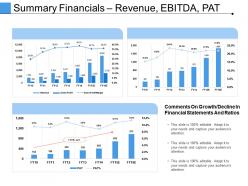 Summary financials revenue ebitda pat powerpoint slide designs
Presenting this set of slides with name - Summary Financials Revenue Ebitda Pat Powerpoint Slide Designs. This is a three stage process. The stages in this process are Finance, Marketing, Bar, Planning, Growth.
-
 Business planning and team discussion powerpoint images
Presenting business planning and team discussion powerpoint images. This is a business planning and team discussion powerpoint images. This is a five stage process. The stages in this process are work strategy, timeline, mission, success.
-
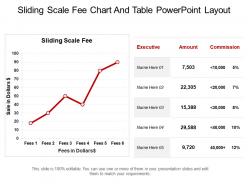 Sliding scale fee chart and table powerpoint layout
Presenting sliding scale fee chart and table powerpoint layout. This is a sliding scale fee chart and table powerpoint layout. This is a stage process. The stages in this process are executive, amount, commission, sale in dollars.
-
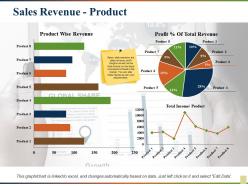 Sales revenue product revenue new customers gross profit
Presenting this set of slides with name - Sales Revenue Product Revenue New Customers Gross Profit. This is a eight stage process. The stages in this process are Product Wise Revenue, Profit Percentage Of Total Revenue, Total Income, Product.
-
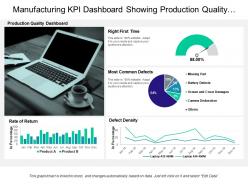 Manufacturing kpi dashboard showing production quality and defect density
Presenting this set of slides with name - Manufacturing Kpi Dashboard Showing Production Quality And Defect Density. This is a four stage process. The stages in this process are Manufacturing, Production, Manufacture.
-
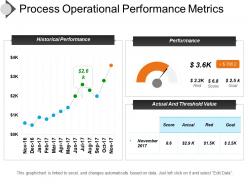 Process operational performance metrics presentation slides
Presenting process operational performance metrics presentation slides. PPT is useful in process performance measurement and improvement related slideshows. You can open the design template with Google Slides and PowerPoint. Images are fully supported on standard and wide screen views. Diagrams are fully editable in PowerPoint. You can change all the design components including font type, color, size, shape, background, images etc.
-
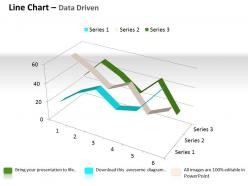 Data driven 3d line chart for comparison of data powerpoint slides
We are proud to present our data driven 3d line chart for comparison of data powerpoint slides. Our Data Driven 3D Line Chart For Comparison Of Data Powerpoint Slides Power Point Templates Are Building A Great Reputation. Of Being The Driving Force Of A Good Presentation. Use Our Data Driven 3D Line Chart For Comparison Of Data Powerpoint Slides Power Point Templates And Surely Win The Game. As A Presenter Gain Great Name And Fame.
-
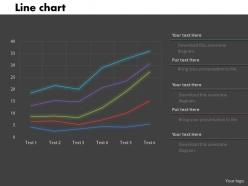 0414 line chart for data analysis powerpoint graph
We are proud to present our 0414 line chart for data analysis powerpoint graph. Our Line Chart For Data Analysis Powerpoint Graph Powerpoint Templates are building a great reputation. Of being the driving force of a good presentation. Use our Line Chart For Data Analysis Powerpoint Graph Powerpoint Templates and surely win the game. As a presenter gain great name and fame.
-
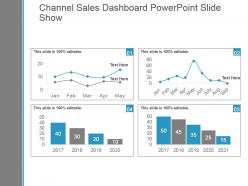 Channel sales dashboard powerpoint slide show
Presenting channel sales dashboard powerpoint slide show. This is a channel sales dashboard powerpoint slide show. This is a four stage process. The stages in this process are business, marketing, line chart, dashboard, management.
-
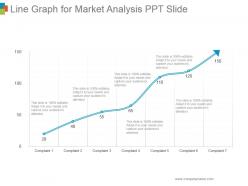 Line graph for market analysis ppt slide
Presenting line graph for market analysis ppt slide. This is a line graph for market analysis ppt slide. This is a seven stage process. The stages in this process are complaint.
-
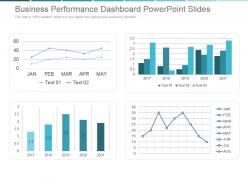 Business performance dashboard powerpoint slides
Presenting business performance dashboard powerpoint slides. This is a business performance dashboard powerpoint slides. This is a four stage process. The stages in this process are business, chart and graph, strategy, success, line graph.
-
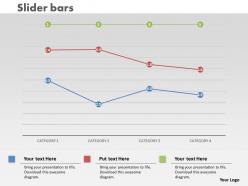 0414 slider line chart for communicating data powerpoint graph
We are proud to present our 0414 slider line chart for communicating data powerpoint graph. Activate the energies of your audience with our Slider Line Chart For Communicating Data Powerpoint Graph Powerpoint Templates. Get their creative juices flowing with your words. Enhance the stature of your presentation with our Slider Line Chart For Communicating Data Powerpoint Graph Powerpoint Templates. Adorn the beauty of your thoughts with their colourful backgrounds.
-
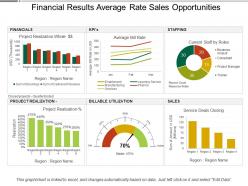 Financial results average rate sales opportunities
Introducing financial results average rates sales opportunities Presentation template. Pre-designed PowerPoint slide assist you in saving time and effort. Color, text and font can be easily edited as the PPT graphic is completely editable. Adaptable as can be transformed into PDF or JPEG formats. Fast download and easy to share with large set of audience. Presentation diagram is presentable in standard and widescreen display. Innovatively created PPT design familiar with Google slides.
-
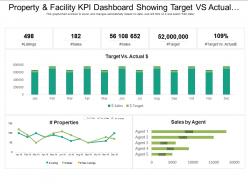 Property and facility kpi dashboard showing target vs actual cost and sales by agent
Get a chance to go through, property and facility KPI dashboard showing target-vs-actual cost and sales by agent PowerPoint Presentation Slide. This Presentation has been designed by professionals and is fully editable. You can have access to alter the font size, font type, colors, and even the background. This Template is amiable with Google Slide and can be saved in JPG or PDF format without any chaos created. Fast download at the click of the button.
-
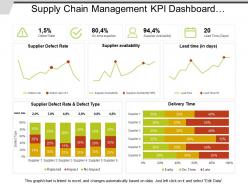 Supply chain management kpi dashboard showing defect rate and delivery time
Presenting this set of slides with name - Supply Chain Management Kpi Dashboard Showing Defect Rate And Delivery Time. This is a three stage process. The stages in this process are Demand Forecasting, Predicting Future Demand, Supply Chain Management.
-
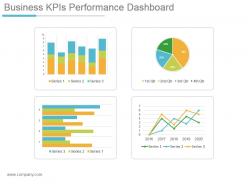 Business kpis performance dashboard snapshot powerpoint slide clipart
Presenting business kpis performance dashboard snapshot powerpoint slide clipart. This is a business kpis performance dashboard powerpoint slide clipart. This is a four stage process. The stages in this process are series, qtr.
-
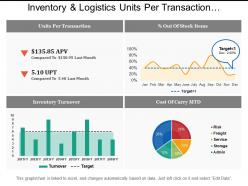 Inventory and logistics units per transaction dashboards
Spectacular inventory and logistics units per transaction dashboards PPT template. Top quality and creative PowerPoint slide design. Adjustable presentation graphic as compatible with Google slides. Perfect for sales executives, marketers, business professionals, analysts, strategists, students, teachers, etc. Information on making the changes has been provided for your provision. Download is rapid and can be displayed in widescreen view mode also. 100% editable PPT designs as completely modifiable such as icons, text, colors, etc. Effortlessly convertible into JPEG and PDF file formats.


