- Sub Categories
-
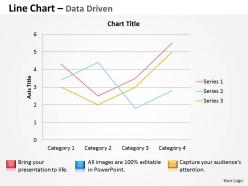 Data driven line chart to demonstrate data powerpoint slides
We are proud to present our data driven line chart to demonstrate data powerpoint slides. This line chart displays information as a series of data points connected by straight line segments.You can illustrate your ideas and imprint them in the minds of your team with this PPT diagram
-
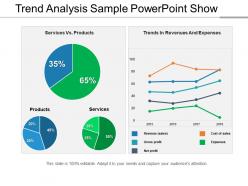 Trend analysis sample powerpoint show
Presenting a PowerPoint slide named Trend Analysis Sample PowerPoint Show. Create a compelling presentation with this PPT diagram, which is both professional and editable. Customize colors, choose font styles, and size. You can choose from a wide variety of icons. Resize and scale the images to fit any content. The PPT slide is compatible with Google Slides and can be fetched at once. You can save it as both PDF and JPG format. This PPT slide is data-driven and linked to the Excel sheet.
-
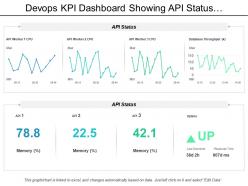 Devops kpi dashboard showing api status and uptime
Presenting this set of slides with name - Devops Kpi Dashboard Showing Api Status And Uptime. This is a four stage process. The stages in this process are Development And Operations, Devops.
-
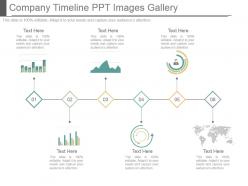 Company timeline ppt images gallery
Presenting company timeline ppt images gallery. This is a company timeline ppt images gallery. This is a six stage process. The stages in this process are business, timeline, icons, strategy, success.
-
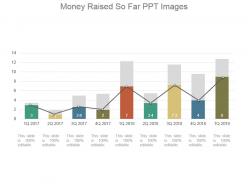 Money raised so far ppt images
Presenting money raised so far PPT images. Change PowerPoint structure, font, text, color and design as per your requirements. Easy data entry options to put in company logo, brand or name .Ideal for marketing professionals, business managers, entrepreneurs and big organizations. This presentation theme is totally attuned with Google slide. Easy conversion to other software’s like JPG and PDF formats. Image quality remains the unchanged even when resize the image or portray on large screens. You can play with shapes and colors to make the chart fitting your brand colors and style.
-
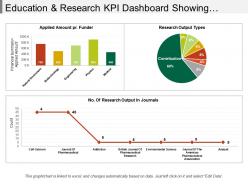 Education and research kpi dashboard Snapshot showing research outputs and amount
Presenting education and research KPI dashboard snapshot showing research outputs and amount PPT slide. The research data metric presentation slide designed by professional team of SlideTeam. The education and research report PPT slide is 100% customizable in PowerPoint. The research amount KPI dashboard slide is also compatible with Google Slide so a user can share this slide with others. A user can make changes in the font size, font type, color as well as dimensions of the research key measure PPT template as per the requirement. You may edit the value in the research key measure PPT template as the slide gets linked with the Excel sheet.
-
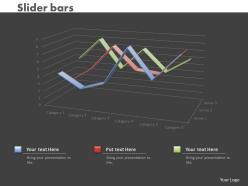 0414 slider line chart business illustration powerpoint graph
Easy data input like company logo, name or trademark. This PowerPoint icon is completely compatible with Google slides. Great for entrepreneurs, marketing and sales persons. Change PPT layout, font, text, color and blueprint as per your approach. Quick downloading speed and formats can be changed to JPEG and PDF. Quality of picture remain unaffected even when we resize the image.
-
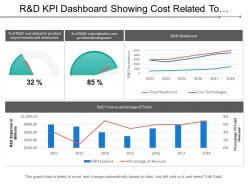 R and d kpi dashboard showing cost related to product improvements and extensions
Presenting this set of slides with name - R And D Kpi Dashboard Showing Cost Related To Product Improvements And Extensions. This is a four stage process. The stages in this process are R And D, Research And Development, Research And Technological Development.
-
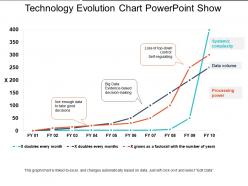 Technology evolution chart powerpoint show
Introducing technology evolution chart PowerPoint slide. Informational PPT structure altogether valuable for IT experts, IT managers and other IT professionals, business specialists, and more. Advantageous PPT Image which offers a scope to add the organization name, structure, or symbol or logo. Consonant with all other accessible software applications and Google Slides. Highlights such as the image, style, text, font, color and more. are also 100% editable.
-
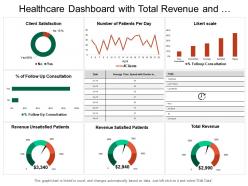 Healthcare dashboard with total revenue and patients per day
Presenting this set of slides with name - Healthcare Dashboard With Total Revenue And Patients Per Day. This is a six stage process. The stages in this process are Healthcare, Health Improvement, Medical Care.
-
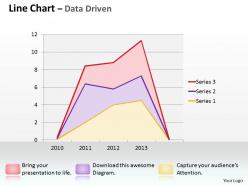 Data driven line chart shows revenue trends powerpoint slides
We are proud to present our data driven line chart shows revenue trends powerpoint slides. This PowerPoint diagram helps you chart the course of your presentation.This unique image makes your presentations professional and interactive. Deliver amazing presentations to mesmerize your audience.
-
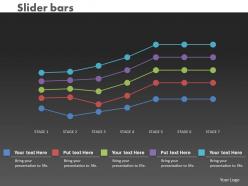 0414 dotted line business chart powerpoint graph
Presentable and easy to comprehend info graphic format. The presentation template can be downloaded and saved in any desired format. Privilege of insertion of logo and trademarks for more personalization. Adaptable to wide screen view without the problem of pixilation. Beneficial and productive insight for industry professionals, teachers, students, strategists and management planners.
-
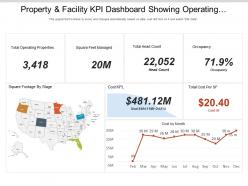 Property and facility kpi dashboard showing operating properties headcount and occupancy
Showing, property and facility KPI dashboard showing operating properties headcount and occupancy PowerPoint Presentation Slide. This Presentation has been designed under the keen supervision of professionals and is fully editable. You can have the feasibility to change the font size, font type, colors, and even the background. This Template is obedient with Google Slide and can be saved in JPG or PDF format without any fuss created during the saving process. Fast download at the click of the button provided below.
-
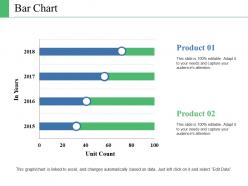 Bar chart ppt background graphics
Presenting a PowerPoint slide named Bar chart PPT background graphics. Use this completely customizable and easy-to-edit PPT slide to communicate your ideas in the presentation. You can format the font size, color and style of the slide. Background color can be altered too. Add your desired content anywhere in the slide. It’s compatibility with Google slides make it readily accessible. You can save it in PDF as well as JPG formats. This PPT template offers a simple and fresh design with lots of icons to choose from. This PPT slide is Excel-linked also. Have an engaging presentation ready in minutes with this PPT template.
-
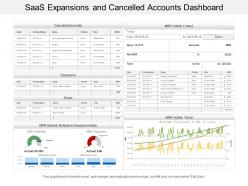 Saas expansions and cancelled accounts dashboard
Presenting Saas expansions and cancellation accounts dashboard PPT template. Download is quick and can be easily shared. Conveys a sense of change over time. Suitable for corporate leaders and business associates. Flexible PPT slide as can be used whenever required. PowerPoint design can be shared in Standard and Widescreen view. High quality graphics and visuals used in the PPT. Option to include business content i.e. name, logo and text. Effortless conversion into PDF/ JPG format. Can be easily merged with your ongoing presentation slides.
-
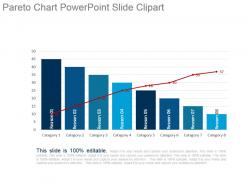 Pareto chart powerpoint slide clipart
Presenting pareto chart powerpoint slide clipart. This is a pareto chart powerpoint slide clipart. This is a eight stage process. The stages in this process are category, reason.
-
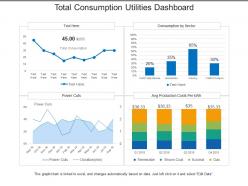 Total consumption utilities dashboard
Presenting this set of slides with name - Total Consumption Utilities Dashboard. This is a four stage process. The stages in this process are Utilities, Use, Advantage.
-
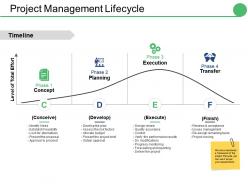 Project management lifecycle ppt gallery images
Presenting this set of slides with name - Project Management Lifecycle Ppt Gallery Images. This is a four stage process. The stages in this process are Concept, Planning, Execution, Transfer, Develop.
-
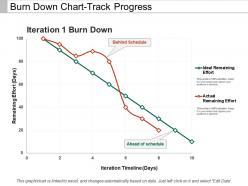 Burn down chart-track progress
Presenting this set of slides with name - Burn Down Chart-Track Progress. This is a two stage process. The stages in this process are Burn Down Chart, Agile Software Development Chart, Run Chart.
-
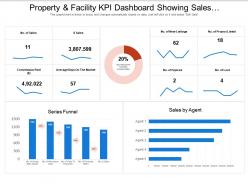 Property and facility kpi dashboard showing sales and properties listed
Presenting, property and facility KPI dashboard showing sales and properties listed PowerPoint Presentation Slide. This Presentation has been designed under the strict supervision of professionals and is fully editable. You can have access to play with the font size, font type, colors, and even the background. This Template is manageable with Google Slide and can be saved in JPG or PDF format without any hassle created during the saving process. Fast download at the click of the button shown below.
-
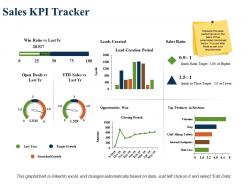 Sales kpi tracker lead creation period sales ratio
Presenting this set of slides with name - Sales Kpi Tracker Lead Creation Period Sales Ratio. This is a three stage process. The stages in this process are Leads Created, Sales Ratio, Top Products In Revenue, Opportunities Won, Stretched Growth.
-
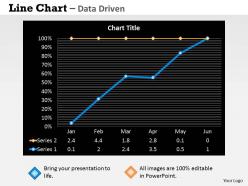 Data driven economic status line chart powerpoint slides
We are proud to present our data driven economic status line chart powerpoint slides. Kick Up A Storm With Our Data Driven Economic Status Line Chart Powerpoint Slides Power Point Templates. The Heads Of Your Listeners Will Swirl With Your Ideas. Ascend The Ladder Of Success With Ease. Our Data Driven Economic Status Line Chart Powerpoint Slides Power Point Templates Will Provide Strong And Sturdy Steps.
-
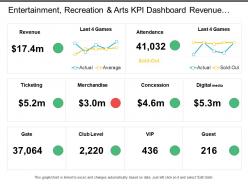 Entertainment recreation and arts kpi dashboard revenue ticketing merchandise vip and guest
Presenting this set of slides with name - Entertainment Recreation And Arts Kpi Dashboard Revenue Ticketing Merchandise Vip And Guest. This is a four stage process. The stages in this process are Entertainment, Recreation And Arts, Attractions, Culture, Entertainment.
-
 Insurance total claims per year and month dashboard
• Bright colors and clarity in graphics • Thoroughly editable slides • Ease of editing the slides with the help of instructions provided. • Easy to download • Comfortably customizable • Of much help to financial analysts, insurance company employees, students and teachers. • High resolution of slide visuals do not let the image pixelate when projected on wide screen • Compatible with latest software options and multiple format types.
-
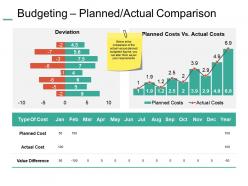 Budgeting planned actual comparison ppt summary example introduction
Presenting Budgeting Planned Actual Comparison PPT Summary Example Introduction. Customize it as per your presentation theme by changing its colors, font type, and font size. You are free to make alterations in the background as well. Convert and save it in JPG, PNG, PDF, and various other file formats. Present it in front of a large segment because of its splendid pixel quality. Its adaptability with the Google Slides makes it accessible at once.
-
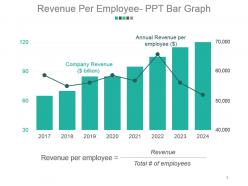 Revenue per employee ppt bar graph powerpoint slide background image
Presenting revenue per employee ppt bar graph powerpoint slide background image. This is a revenue per employee ppt bar graph powerpoint slide background image. This is a eight stage process. The stages in this process are annual revenue per employee, company revenue, revenue per employee, revenue, total number of employees.
-
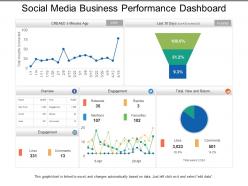 Social media business performance dashboard
Presenting, agile development showing product owner with iteration plan and planning meeting PPT template. This PPT slide can be used for agile development and sprint planning related presentations by experts, students or strategists. All the icons practiced here are 100% editable in PowerPoint software. You can change the color, size, and format of any icon to your liking. Insert your business logo in the PPT slide, which is also compatible with google slides.
-
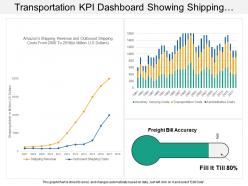 Transportation kpi dashboard showing shipping revenue and outbound shipping costs
Presenting transportation KPI dashboard showing shipping revenue and outbound shipping costs PPT slide. Simple data input like company logo, name or trademark. User can edit the data in linked excel sheet and graphs and charts gets customized accordingly .This PPT slide offers you plenty of space to put in titles and sub titles. High resolution based presentation layout, does not change the image even after resizing. This presentation icon is data driven and template can be downloaded via excel file to incorporate data.
-
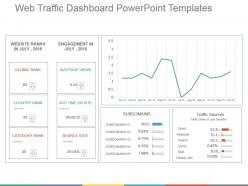 Web traffic dashboard powerpoint templates
Presenting to you web traffic dashboard template. This slide is fully customizable PowerPoint template to communicate your ideas clearly. You can easily edit the charts and graphs in excel sheet. This presentation slide is designed with elegant shapes and visuals. You can convert this slide into numerous format options like JPEG, JPG or PDF. This template is compatible with Google slides. It is easy to customize each graphics and text as per your need. You can download it easily at a click of a button.
-
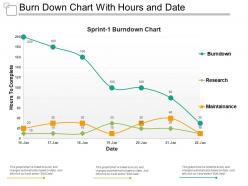 Burn down chart with hours and date
Presenting this set of slides with name - Burn Down Chart With Hours And Date. This is a three stage process. The stages in this process are Burn Down Chart, Agile Software Development Chart, Run Chart.
-
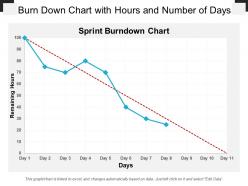 Burn down chart with hours and number of days
Presenting this set of slides with name - Burn Down Chart With Hours And Number Of Days. This is a one stage process. The stages in this process are Burn Down Chart, Agile Software Development Chart, Run Chart.
-
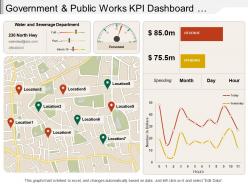 Government and public works kpi dashboard showing water sewerage department
Presenting the KPI dashboard PPT template. This KPI presentation layout is 100% modifiable and is designed professionally. You can edit the objects in this slide like font color and font size without going through any fuss. This presentation template is 100% compatible with Google Slide and can be saved in JPG or PDF file format hassle-free. To download this, click on the button below.
-
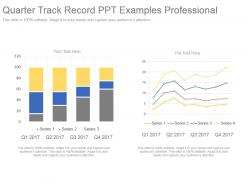 Quarter track record ppt examples professional
Presenting quarter track record ppt examples professional. This is a quarter track record ppt examples professional. This is a four stage process. The stages in this process are series.
-
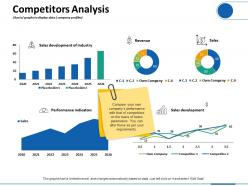 Competitors analysis charts graphs to display data company profiles
Presenting this set of slides with name - Competitors Analysis Charts Graphs To Display Data Company Profiles. This is a five stage process. The stages in this process are Revenue, Sales Development, Performance Indicators, Finance, Marketing.
-
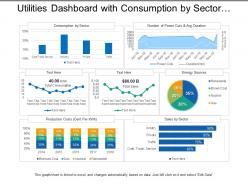 Utilities dashboard with consumption by sector and energy sources
Presenting this set of slides with name - Utilities Dashboard With Consumption By Sector And Energy Sources. This is a three stage process. The stages in this process are Utilities, Use, Advantage.
-
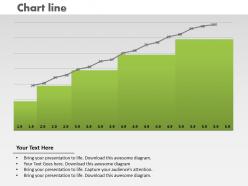 0414 column chart with growth line powerpoint graph
Multiple display option such as standard and widescreen view. Adjustable presentation background with remarkable pixel quality. Easy customization of presentation graphic and content. Proficiently transformable into numerous software options such as JPG or PDF. Provides a uniform approach to your PowerPoint illustration. Choice to insert company name, badge and label. Similar PPT designs accessible with different nodes and stages.
-
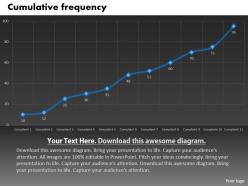 0414 cumulative frequency data line chart powerpoint graph
Presentation background can be amend easily as access to change color, text accessible. Astonishing PowerPoint visual accessible in standard and widescreen display. Far fetched picture quality as pixels don’t break. Merge well with online software tools i.e. JPG and PDF. Hundred percent compatible with Google slides. Pre-designed PPT infographic saves you valuable time. Modify the presentation slide with your company trademark, badge and design.
-
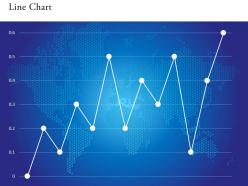 0514 unique pattern data driven line chart powerpoint slides
We are proud to present our 0514 unique pattern data driven line chart powerpoint slides. This Business Power Point template slide is designed with 3d graphic growth line chart. This template is crafted for financial growth display.
-
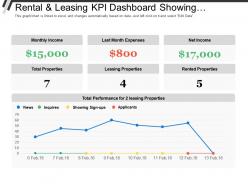 Rental and leasing kpi dashboard showing monthly income total properties net income
Presenting this set of slides with name - Rental And Leasing Kpi Dashboard Showing Monthly Income Total Properties Net Income. This is a three stage process. The stages in this process are Rental And Leasing, Dealing And Leasing, Rental And Engage.
-
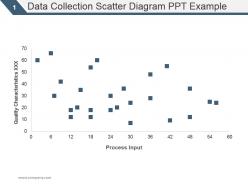 Data collection scatter diagram ppt example
Presenting data collection scatter diagram ppt example. This is a data collection scatter diagram ppt example. This is a one stage process. The stages in this process are dollar, profit in thousands.
-
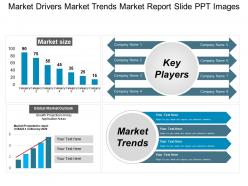 Market drivers market trends market report slide ppt images
Presenting market drivers market trends market report slide PPT images which is fully editable, data driven i.e. excel linked and fast to download. The presenter can customize and personalize this PPT slide it to meet his / her own specifications. This presentation has been designed by plethora of professional expertise. This PowerPoint shape is fully compatible with Google Slides, multiple software and format options. This slideshow can be saved as JPG and / or in PDF. For your kind assistance, editing instructions are also provided. Business analysts, business and sales managers and entrepreneurs picks this PPT.
-
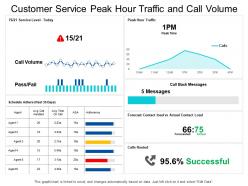 Customer service peak hour traffic and call volume dashboard
Showcasing customer service peak hour traffic and call volume dashboard PowerPoint template slide. This template slide is completely flexible with Google Slide. You can alter the hues, text style, font size of the slide data as per need. The slide is quick to download and can be saved in PDF, and JPEG formats. For guidance, additional educational slides are provided. Best quality graphics are utilized. The quality of the slide graphics does not blur when displayed on a broad screen. Dummy data can be added with other valuable content. You can personalize the slide by adding your organization name, and signature.
-
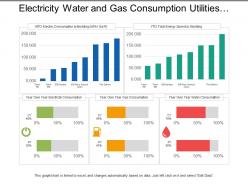 Electricity water and gas consumption utilities dashboard
Presenting this set of slides with name - Electricity Water And Gas Consumption Utilities Dashboard. This is a two stage process. The stages in this process are Utilities, Use, Advantage.
-
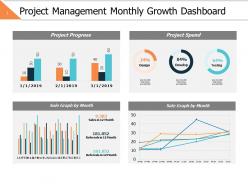 Project management monthly growth dashboard slide2 ppt powerpoint presentation file outfit
Presenting this set of slides with name - Project Management Monthly Growth Dashboard Slide2 Ppt Powerpoint Presentation File Outfit. This is a four stage process. The stages in this process are Business, Management, Strategy, Analysis, Finance.
-
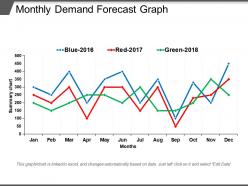 Monthly demand forecast graph ppt slides
Presenting Monthly Demand Forecast Graph PPT Slides. Make changes in this slide as per your needs. You are free to modify the colors, font type, font style, and background of the slide. Convert and save it in JPG, PNG, JPEG, and PDF file formats. It is made up of high-resolution graphics that do not infer the quality when viewed on widescreen. It can also be presented on a standard screen. It is compatible with Google Slides and the major Microsoft versions.
-
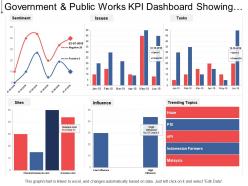 Government and public works kpi dashboard showing sentiment trending topics and issues
Presenting this set of slides with name - Government And Public Works Kpi Dashboard Showing Sentiment Trending Topics And Issues. This is a six stage process. The stages in this process are Government And Public Works, Government And Public Tasks.
-
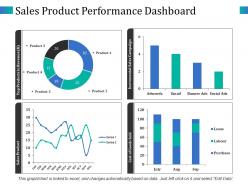 Sales product performance dashboard top products in revenue
Highlighting sales product performance dashboard top products in revenue PowerPoint slide. Easy and convenient downloading by following simple steps. No concession with the quality, once opened on wide screen. Modify and personalize the presentation by including the company name and logo. Guidance for executing the changes has been provided for assistance. Useful for sales leaders, marketers, business professionals, analysts, strategists, students, teachers, etc. Compatible with Microsoft office software and the Google Slides. Available to be saved in jpg or pdf format.
-
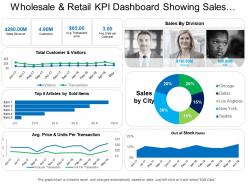 Wholesale and retail kpi dashboard showing sales revenue customers and out of stock items
Presenting the KPI dashboard presentation template. This PPT template is 100% customizable in MS PowerPoint and is designed under the strict supervision of professionals. The user can edit the objects in the slide like font size and font color without any hassle. This presentation template is 100% compatible with Google Slide and can be saved in JPG or PDF file format easily. Click on the download tab to download this presentation template.
-
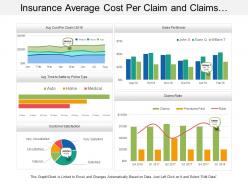 Insurance average cost per claim and claims ratio dashboard
Presenting this set of slides with name - Insurance Average Cost Per Claim And Claims Ratio Dashboard. This is a five stage process. The stages in this process are Assurance, Surety, Insurance.
-
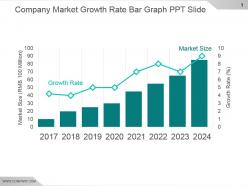 Company market growth rate bar graph ppt slide
Presenting company market growth rate bar graph ppt slide. This is a company market growth rate bar graph ppt slide. This is a eight stage process. The stages in this process are business, growth, marketing, strategy, success.
-
 Procurement suppliers defect rate and type dashboard
Presenting this set of slides with name - Procurement Suppliers Defect Rate And Type Dashboard. This is a six stage process. The stages in this process are Purchase, Procurement, Buy.
-
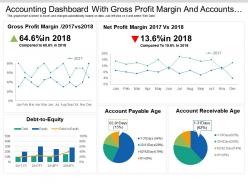 Accounting dashboard with gross profit margin and accounts payable
Offering accounting dashboard with gross profit margin and account payable PPT slideshow. Makes the information clear in the mind of the audience. Editable visuals, colors and charts. Easy to edit and customize as per your needs. Beneficial for industry professionals, technologists, managers, executives, researchers, sales people, etc. Flexible presentation designs can be presented in standard and widescreen view. Has a futuristic and realistic approach. Easy to download and save. Highly beneficial PowerPoint Slide for highlighting financial data.
-
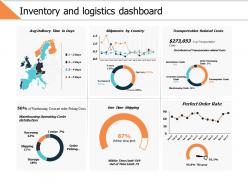 Inventory and logistics dashboard ppt powerpoint presentation file templates
Presenting this set of slides with name - Inventory And Logistics Dashboard Ppt Powerpoint Presentation File Templates. This is a six stage process. The stages in this process are Business, Management, Strategy, Analysis, Finance.
-
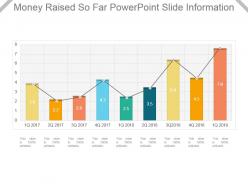 Money raised so far powerpoint slide information
Presenting money raised so far powerpoint slide information. This is a money raised so far powerpoint slide information. This is a nine stage process. The stages in this process are business, marketing, growth, rising, management.
-
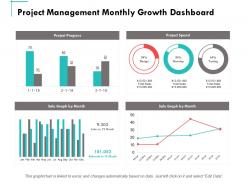 Project management monthly growth dashboard ppt powerpoint presentation summary slide
Presenting this set of slides with name - Project Management Monthly Growth Dashboard Ppt Powerpoint Presentation Summary Slide. This is a two stages process. The stages in this process are Finance, Marketing, Management, Investment, Analysis.
-
 Education and research kpi dashboard showing response timeline and researcher engagement
Presenting education and research KPI dashboard showing response timeline and researcher engagement PPT slide. The education report PPT slide designed by professional team of SlideTeam. The research grant KPI dashboard presentation template is customizable in PowerPoint. The student attendance rate KPI report PowerPoint slide is also compatible with Google Slide so a user can share this template with others. A user can make changes in the font size, font type, color as well as dimensions of the education finance metric dashboard template as per the requirement. You may edit the value in the education KPI dashboard PowerPoint template as the slide gets linked with the Excel sheet. .
-
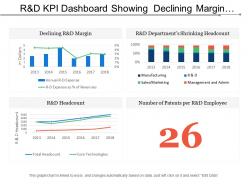 R and d kpi dashboard showing declining margin headcount and number of patents per employee
Presenting this set of slides with name - R And D Kpi Dashboard Showing Declining Margin Headcount And Number Of Patents Per Employee. This is a four stage process. The stages in this process are R And D, Research And Development, Research And Technological Development.
-
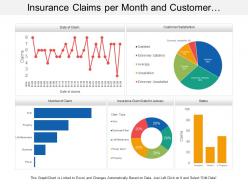 Insurance claims per month and customer satisfaction dashboard
Presenting this set of slides with name - Insurance Claims Per Month And Customer Satisfaction Dashboard. This is a five stage process. The stages in this process are Assurance, Surety, Insurance.
-
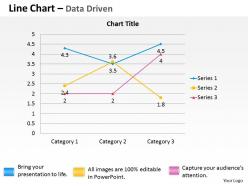 Data driven economic analysis line chart powerpoint slides
We are proud to present our data driven economic analysis line chart powerpoint slides. Set Pulses Racing With Our Data Driven Economic Analysis Line Chart Powerpoint Slides Power Point Templates. They Will Raise The Expectations Of Your Team. Our Data Driven Economic Analysis Line Chart Powerpoint Slides Power Point Templates Will Let Your Ideas Bloom. Create A Bed Of Roses For Your Audience.
-
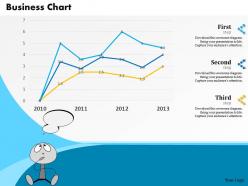 0514 annual business data driven chart powerpoint slides
We are proud to present our 0514 annual business data driven chart powerpoint slides. An annual based data driven chart graphic is used in this business power point template. This professional template is well crafted for various business presentations.


