- Sub Categories
-
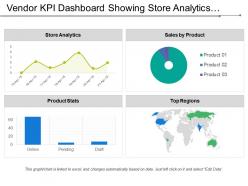 Vendor kpi dashboard showing store analytics sales by product and product stats
Presenting this set of slides with name - Vendor Kpi Dashboard Showing Store Analytics Sales By Product And Product Stats. This is a four stage process. The stages in this process are Vendor, Supplier, Retailer.
-
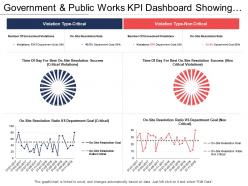 Government and public works kpi dashboard showing violation type and departmental goals
Presenting this set of slides with name - Government And Public Works Kpi Dashboard Showing Violation Type And Departmental Goals. This is a four stage process. The stages in this process are Government And Public Works, Government And Public Tasks.
-
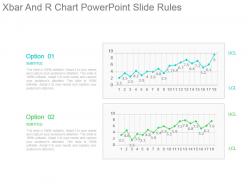 Xbar and r chart powerpoint slide rules
Presenting xbar and r chart powerpoint slide rules. This is a xbar and r chart powerpoint slide rules. This is a two stage process. The stages in this process are option, subtitle, ucl, lcl.
-
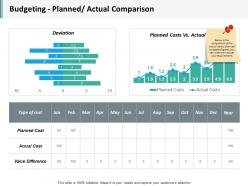 Budgeting planned actual comparison ppt infographics display
Presenting this set of slides with name - Budgeting Planned Actual Comparison Ppt Infographics Display. This is a two stage process. The stages in this process are Business, Management, Strategy, Analysis, Marketing.
-
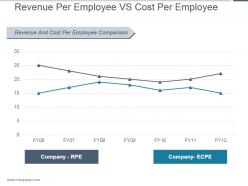 Revenue per employee vs cost per employee ppt templates
Presenting revenue per employee vs cost per employee ppt templates. This is a revenue per employee vs cost per employee ppt templates. This is a seven stage process. The stages in this process are revenue and cost per employee comparison, company rpe, company ecpe, fy.
-
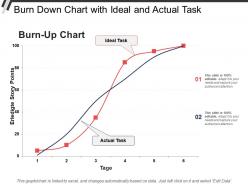 Burn down chart with ideal and actual task
Presenting this set of slides with name - Burn Down Chart With Ideal And Actual Task. This is a two stage process. The stages in this process are Burn Down Chart, Agile Software Development Chart, Run Chart.
-
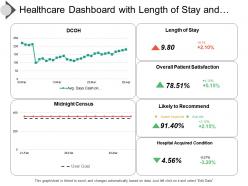 Healthcare dashboard with length of stay and hospital acquired condition
Presenting this set of slides with name - Healthcare Dashboard With Length Of Stay And Hospital Acquired Condition. This is a three stage process. The stages in this process are Healthcare, Health Improvement, Medical Care.
-
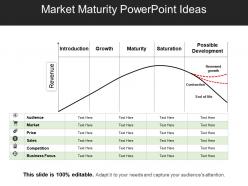 Market maturity powerpoint ideas
Presenting Market Maturity PowerPoint Ideas. It is a professionally designed PowerPoint template with relevant visuals and content. You can change the color, text and font size as per your need. You can add or delete the content wherever required. This slide is available in both standard and widescreen size. Its compatibility with Google Slides makes it easily available. Convert and save this PPT slide in both PDF and JPG format.
-
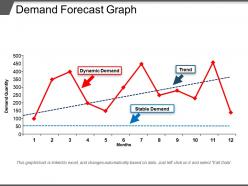 Demand forecast graph ppt image
Presenting Demand Forecast Graph PPT Image Template which is 100% editable. You can modify the colors, fonts, font size, and font types of the slide according to your requirements. It can also be changed into other formats such as PDF, JPG, and PNG. The template is readily available in both 4:3 and 16:9 aspect ratio. It is compatible with Google Slides too, which makes it accessible at once.
-
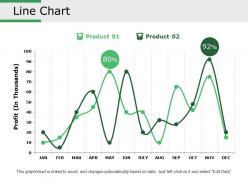 Line chart presentation visuals
Presenting this set of slides with name - Line Chart Presentation Visuals. This is a two stage process. The stages in this process are Line Chart, Finance, Marketing, Strategy, Growth, Business.
-
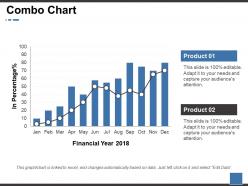 Combo chart ppt show template
Get a chance to go through the combo chart PowerPoint presentation slide. This presentation has been designed by professionals and is fully editable. You can remodel the font size, font type, colors, and even the background. This Template is practicable with Google Slide and can be saved in JPG or PDF format without any obstacle created during the process. Fast download at the click of the button provided below.
-
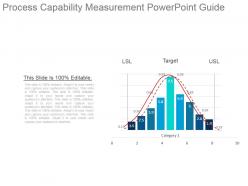 Process capability measurement powerpoint guide
Presenting process capability measurement powerpoint guide. This is a process capability measurement powerpoint guide. This is a nine stage process. The stages in this process are lsl, usl, category, target.
-
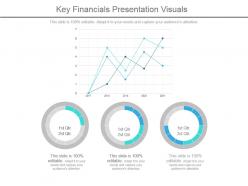 Key financials presentation visuals
Presenting key financials presentation visuals. This is a key financials presentation visuals. This is a three stage process. The stages in this process are business, marketing, measure, success, graph.
-
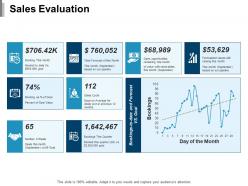 Sales evaluation ppt model infographic template
This is a eight stage process. The stages in this process are Product, Percentage, Marketing, Business.
-
 Inventory and logistics dashboard ppt powerpoint presentation example 2015
Presenting this set of slides with name - Inventory And Logistics Dashboard Ppt Powerpoint Presentation Example 2015. This is a eight stage process. The stages in this process are Finance, Analysis, Business, Investment, Marketing.
-
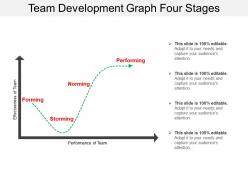 Team development graph four stages
Presenting Team Development Graph Four Stages PPT slideshow which is designed professionally for your convenience. This template is compatible with Google Slides which makes it easily accessible at once. Open your presentation and save it in various formats like PDF, JPG, and PNG. Customize the colors, fonts, font size, and font types of the slide as per your requirements. You can freely access the slide in both 4:3 and 16:9 aspect ratio.
-
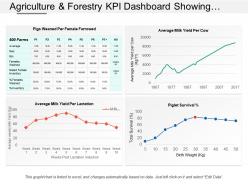 Agriculture and forestry kpi dashboard showing average milk yield per lactation
Exhibiting agriculture and forestry KPI dashboard showing average milk yield per lactation PPT design. Speedy download with easy to save options. Effortless to put in corporation name, logo and image. Presentation template can be shared with Google slides as easily merge with them. PowerPoint graphic can be showcased in standard and widescreen view. Preference to download and present with different nodes and stages. PPT diagram can be modify easily as some components are editable.
-
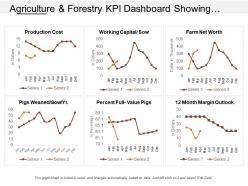 Agriculture and forestry kpi dashboard showing production cost and working capital sow
Presenting agriculture and forestry KPI dashboard showing production cost and working capital sow PPT slideshow. Easy and convenient downloading by following simple steps. They have an amazing view to grab the attention if the viewer. They are popular and in demand due to their easy use and accessibility. They maintain the professionalism of the presentation. Fully compatible with Google slides. Have the tendency to enhance the overall impact of your presentation. User friendly PPT templates. Presented to be saved in jpg or pdf format if required.
-
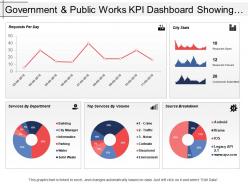 Government and public works kpi dashboard showing requests per day and city stats
Presenting this set of slides with name - Government And Public Works Kpi Dashboard Showing Requests Per Day And City Stats. This is a five stage process. The stages in this process are Government And Public Works, Government And Public Tasks.
-
 Property and facility kpi dashboard showing sold homes per available inventory ratio
Get a chance to go through, property and facility KPI dashboard showing sold homes per available inventory ratio PowerPoint Presentation Slide. This Presentation has been designed by professionals and is fully editable. You can have access to play with the font size, font type, colors, and even the background. This Template is attainable with Google Slide and can be saved in JPG or PDF format without any hurdles created during the saving process. Fast download at the click of the button.
-
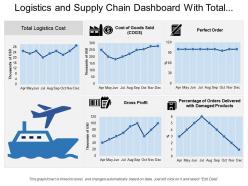 Logistics and supply chain dashboard with total logistics cost and perfect order
Presenting this set of slides with name - Logistics And Supply Chain Dashboard With Total Logistics Cost And Perfect Order. This is a six stage process. The stages in this process are Logistics Dashboard, Logistics Kpis, Logistics Performance.
-
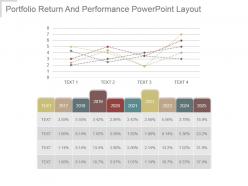 Portfolio return and performance powerpoint layout
Presenting portfolio return and performance powerpoint layout. This is a portfolio return and performance powerpoint layout. This is a nine stage process. The stages in this process are years, planning, business, finance, marketing.
-
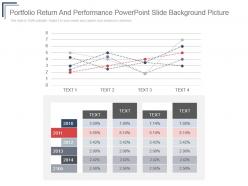 Portfolio return and performance powerpoint slide background picture
Presenting portfolio return and performance powerpoint slide background picture. This is a portfolio return and performance powerpoint slide background picture. This is a four stage process. The stages in this process are years, planning, presentation, business, marketing.
-
 Comparison stats trend line powerpoint templates
Presenting comparison stats trend line PowerPoint templates PPT slide. You can download the slide and save into JPG & PDF format and can also display in the standard & widescreen view. You may even do alteration in the slide such as color, text, font type, font size and aspect ratio. The template gets synced with Google Slides and editable in PowerPoint. You may share this slide with large segment because it has tremendous pixel quality. You can insert the relevant content in text placeholder of the template.
-
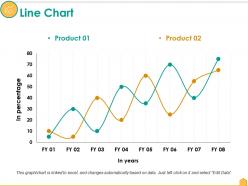 Line chart ppt file slide download
Presenting this set of slides with name - Line Chart Ppt File Slide Download. This is a two stage process. The stages in this process are Product, In Percentage, In Years, Growth, Success.
-
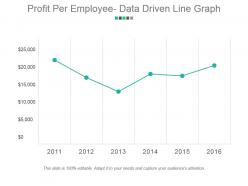 Profit per employee data driven line graph powerpoint slide background image
Presenting profit per employee data driven line graph powerpoint slide background image. This is a profit per employee data driven line graph powerpoint slide background image. This is a six stage process. The stages in this process are profit, employee, graph, line, growth.
-
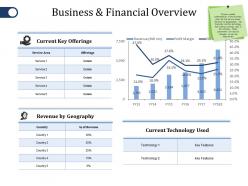 Business and financial overview ppt file model
Presenting this set of slides with name - Business And Financial Overview Ppt File Model. This is a four stage process. The stages in this process are Current Key Offerings, Revenue By Geography, Current Technology Used, Technology.
-
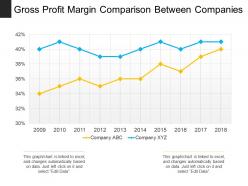 Gross profit margin comparison between companies
Presenting Gross Profit Margin Comparison Between Companies PPT theme which is fully customizable. This template is adaptable with Google Slides, which makes it accessible at once. You can change the colors, fonts, font size, and font types of the template as per the requirements. It can be converted into formats like PDF, JPG, and PNG. The slide is readily available in both 4:3 and 16:9 aspect ratio.
-
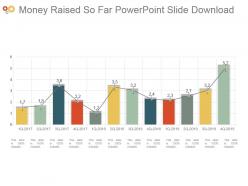 Money raised so far powerpoint slide download
Presenting money raised so far powerpoint slide download. This is a money raised so far powerpoint slide download. This is a twelve stage process. The stages in this process are business, marketing, growth, rising, management.
-
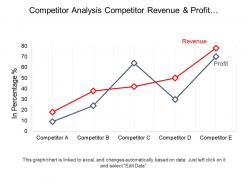 Competitor analysis competitor revenue and profit growth line graph ppt diagrams
Presenting competitor analysis PPT diagram. This PPT template is quite comfortable for business analysis, management students, business managers, and other professionals etc. The various features of this Presentation graphic are revamp able such as the fonts, font sizes, colors, designs, words etc. This PPT graphic can be easily structured into PDF or JPG formats. This is also well versant with Google Slides.
-
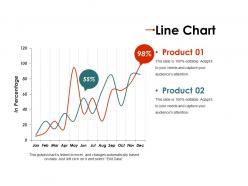 Line chart ppt presentation
Presenting Line Chart PPT Presentation. Customize the font type, size, background color, etc. according to your needs. It is available in both standard screen and widescreen ratio. The slide is compatible with Google Slides and can be saved in numerous formats such as JPG or document formats such as PDF without any problem.
-
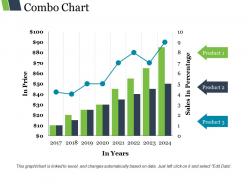 Combo chart ppt infographic template
Presenting combo chart ppt infographic template. This is a combo chart ppt infographic template. This is a eight stage process. The stages in this process are product, in years, bar graph, growth, in price.
-
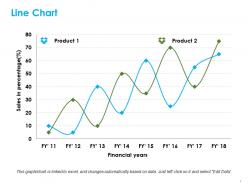 Line chart ppt summary templates
Presenting line chart PPT summary templates PPT slide. The line graph summary PowerPoint template designed by the professionals of SlideTeam to describe the huge amount of data. The run chart slide value gets edited as a user can link this slide with the Excel Sheet. The line chart summary slide is customizable in PowerPoint. The sale line graph example template is also compatible with Google Slide. A user can do modification such as font size, font type, color and dimensions in the run chart template to present the desired comparison between two things.
-
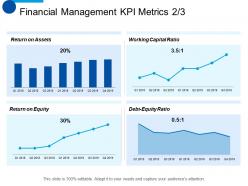 Financial management kpi metrics planning ppt summary background images
Presenting this set of slides with name - Financial Management KPI Metrics Planning Ppt Summary Background Images. This is a four stage process. The stages in this process are Return On Assets, Return On Equity, Working Capital Ratio, Finance, Planning.
-
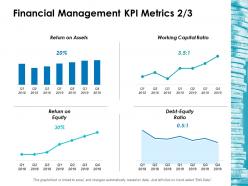 Financial management kpi metrics 2 3 ppt layouts deck
Presenting this set of slides with name - Financial Management Kpi Metrics 2 3 Ppt Layouts Deck. This is a four stage process. The stages in this process are Business, Management, Strategy, Analysis, Marketing.
-
 Sales kpi tracker ppt professional graphics download
Presenting this set of slides with name - Sales KPI Tracker Ppt Professional Graphics Download. This is a seven stage process. The stages in this process are Finance, Analysis, Business, Investment, Marketing.
-
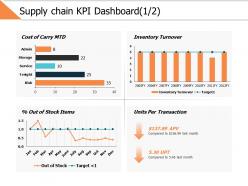 Supply chain kpi dashboard 1 2 ppt powerpoint presentation gallery slides
Presenting this set of slides with name - Supply Chain Kpi Dashboard 1 2 Ppt Powerpoint Presentation Gallery Slides. This is a four stage process. The stages in this process are Business, Management, Strategy, Analysis, Finance.
-
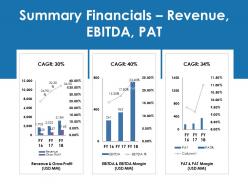 Summary financials revenue ebitda pat ppt model objects
Presenting this set of slides with name - Summary Financials Revenue Ebitda Pat Ppt Model Objects. This is a three stage process. The stages in this process are Revenue And Gross Profit, Pat And Pat Margin, Ebitda And Ebitda Margin.
-
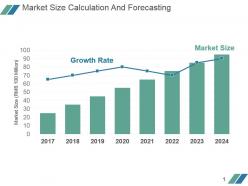 Market size calculation and forecasting powerpoint slide design ideas
Presenting market size calculation and forecasting powerpoint slide design ideas. This is a market size calculation and forecasting powerpoint slide design ideas. This is a eight stage process. The stages in this process are market size rmb, growth rate, market size.
-
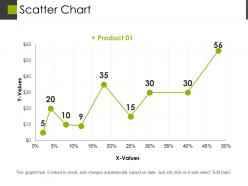 Scatter chart presentation outline
Presenting scatter chart presentation outline. This is a scatter chart presentation outline. This is a one stage process. The stages in this process are values, business, marketing, growth, strategy.
-
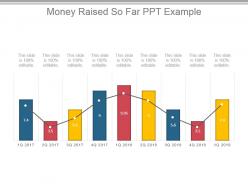 Money raised so far ppt example
Presenting money raised so far ppt example. This is a money raised so far ppt example. This is a nine stage process. The stages in this process are business, marketing, growth, rising, management.
-
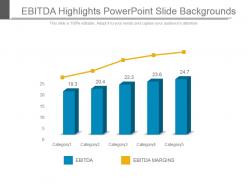 Ebitda highlights powerpoint slide backgrounds
Presenting ebitda highlights powerpoint slide backgrounds. This is a ebitda highlights powerpoint slide backgrounds. This is a five stage process. The stages in this process are ebitda, ebitda margins.
-
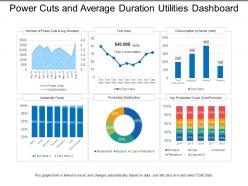 Power cuts and average duration utilities dashboard
Presenting this set of slides with name - Power Cuts And Average Duration Utilities Dashboard. This is a six stage process. The stages in this process are Utilities, Use, Advantage.
-
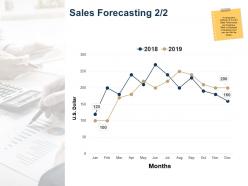 Sales forecasting ppt powerpoint presentation outline information
Presenting this set of slides with name - Sales Forecasting Ppt Powerpoint Presentation Outline Information. This is a two stages process. The stages in this process are Line Chart, Finance, Marketing, Business, Analysis.
-
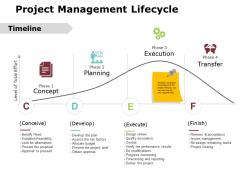 Project management lifecycle ppt powerpoint presentation gallery format
Presenting this set of slides with name - Project Management Lifecycle Ppt Powerpoint Presentation Gallery Format. This is a four stage process. The stages in this process are Business, Management, Strategy, Analysis, Icons.
-
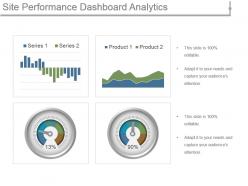 Site performance dashboard analytics ppt images gallery
Presenting site performance dashboard analytics ppt images gallery. This is a site performance dashboard analytics ppt images gallery. This is a four stage process. The stages in this process are site performance,dashboard,analytics,financial,product.
-
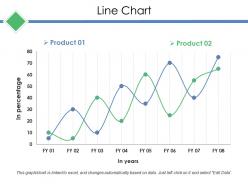 Line chart ppt shapes
Presenting this set of slides with name - Line Chart Ppt Shapes. This is a two stage process. The stages in this process are Line Chart, Growth, Business, Marketing, Strategy.
-
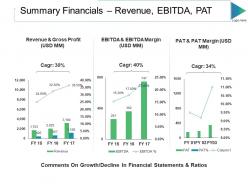 Summary financials revenue ebitda pat ppt slides gridlines
Presenting this set of slides with name - Summary Financials Revenue Ebitda Pat Ppt Slides Gridlines. This is a three stage process. The stages in this process are Revenue And Gross Profit, Ebitda And Ebitda Margin, Pat And Pat Margin, Comments On Growth.
-
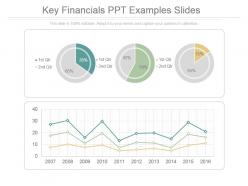 Key financials ppt examples slides
Presenting key financials ppt examples slides. This is a key financials ppt examples slides. This is a three stage process. The stages in this process are business, pie chart, finance, marketing, strategy, success.
-
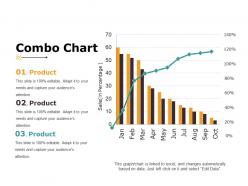 Combo chart presentation portfolio
Presenting combo chart presentation portfolio. This is a combo chart presentation portfolio. This is a ten stage process. The stages in this process are business, marketing, product, sales in percentage, percentage.
-
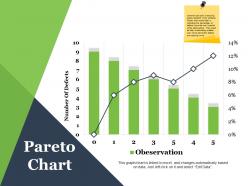 Pareto chart powerpoint slide images
Presenting pareto chart powerpoint slide images. This is a pareto chart powerpoint slide images. This is a seven stage process. The stages in this process are number of defects, observation, graph, finance, business.
-
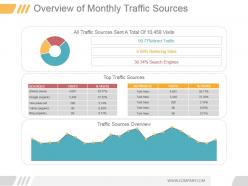 Overview of monthly traffic sources powerpoint graphics
Presenting overview of monthly traffic sources powerpoint graphics. This is a overview of monthly traffic sources powerpoint graphics. This is a three stage process. The stages in this process are all traffic sources sent a total of 10 458 visits, 50 77 percentage direct traffic, 9 89 percentage referring sites, 39 34 percentage search engines, sources, visits, direct none, google organic, vine press net, yahoo organic, bing organic, top traffic sources, keywords, visits, traffic source overview.
-
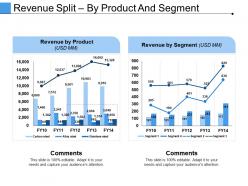 Revenue split by product and segment ppt examples slides
Presenting this set of slides with name - Revenue Split By Product And Segment Ppt Examples Slides. This is a two stage process. The stages in this process are Finance, Marketing, Bar, Planning, Growth.
-
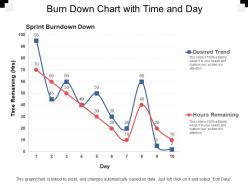 Burn down chart with time and day
Presenting this set of slides with name - Burn Down Chart With Time And Day. This is a two stage process. The stages in this process are Burn Down Chart, Agile Software Development Chart, Run Chart.
-
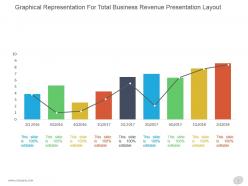 Graphical representation for total business revenue presentation layout
Presenting graphical representation for total business revenue presentation layout. This is a graphical representation for total business revenue presentation layout. This is a nine stage process. The stages in this process are graph, success, business, marketing, growth, management.
-
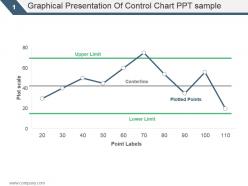 Graphical presentation of control chart ppt sample
Presenting graphical presentation of control chart ppt sample. This is a graphical presentation of control chart ppt sample. This is a three stage process. The stages in this process are upper limit, centerline, plotted points, lower limit, plot scale.
-
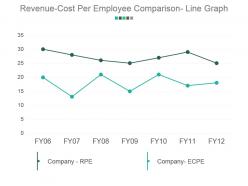 Revenue cost per employee comparison line graph powerpoint slide background picture
Presenting revenue cost per employee comparison line graph powerpoint slide background picture. This is a revenue cost per employee comparison line graph powerpoint slide background picture. This is a seven stage process. The stages in this process are company rpe, company ecpe.
-
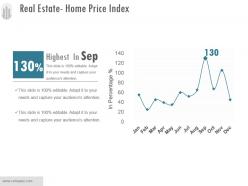 Real estate home price index powerpoint layout
Presenting real estate home price index powerpoint layout. This is a real estate home price index powerpoint layout. This is a one stage process. The stages in this process are marketing, graph, line, finance, business.
-
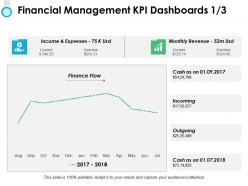 Financial management kpi dashboards ppt powerpoint presentation file deck
Presenting this set of slides with name - Financial Management Kpi Dashboards Ppt Powerpoint Presentation File Deck. This is a two stage process. The stages in this process are Percentage, Product, Business, Management, Marketing.
-
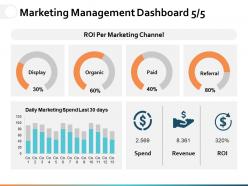 Marketing management dashboard snapshot ppt powerpoint presentation file graphics pictures
Presenting this set of slides with name - Marketing Management Dashboard Snapshot Ppt Powerpoint Presentation File Graphics Pictures. This is a three stage process. The stages in this process are Percentage, Product, Business, Management, Marketing.


