- Sub Categories
-
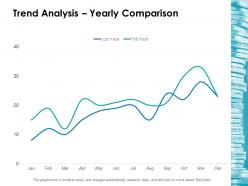 Trend analysis yearly comparison ppt layouts guide
Presenting this set of slides with name - Trend Analysis Yearly Comparison Ppt Layouts Guide. This is a two stage process. The stages in this process are Business, Management, Strategy, Analysis, Marketing.
-
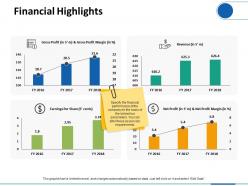 Financial highlights finance ppt visual aids infographic template
Presenting this set of slides with name - Financial Highlights Finance Ppt Visual Aids Infographic Template. This is a four stage process. The stages in this process are Finance, Analysis, Business, Investment, Marketing.
-
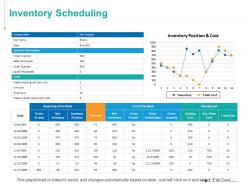 Inventory scheduling finance ppt powerpoint presentation ideas
Presenting this set of slides with name - Inventory Scheduling Finance Ppt Powerpoint Presentation Ideas. This is a four stage process. The stages in this process are System Parameters, Inventory, Inventory Position, Marketing, Finance.
-
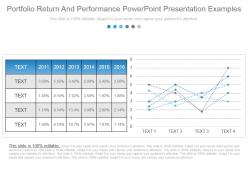 Portfolio return and performance powerpoint presentation examples
Presenting portfolio return and performance powerpoint presentation examples. This is a portfolio return and performance powerpoint presentation examples. This is a two stage process. The stages in this process are business, management, success, strategy, marketing.
-
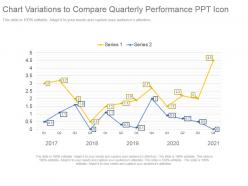 Chart variations to compare quarterly performance ppt icon
Presenting chart variations to compare quarterly performance ppt icon. This is a chart variations to compare quarterly performance ppt icon. This is a two stage process. The stages in this process are series.
-
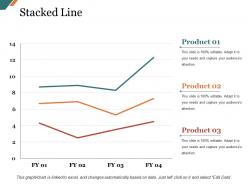 Stacked line presentation graphics
Presenting this set of slides with name - Stacked Line Presentation Graphics. This is a three stage process. The stages in this process are Business, Marketing, Line Graph, Finance, Strategy.
-
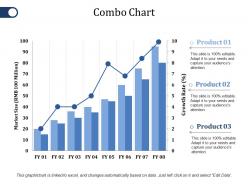 Combo chart ppt file summary
Presenting this set of slides with name - Combo Chart Ppt File Summary. This is a three stage process. The stages in this process are Product, Market Size, Growth Rate, Success, Bar Graph.
-
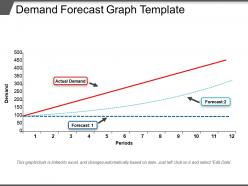 Demand forecast graph template ppt icon
Presenting Demand Forecast Graph Template PPT Icon which is designed by our professionals for your convenience. Open and save your presentation into formats like PDF, PNG, and JPG. The slide is available in both 4:3 and 16:9 aspect ratio. The template is adaptable with Google Slides, which makes it easily accessible. You can also change the color, fonts, font size, and font types of the template as per the requirement.
-
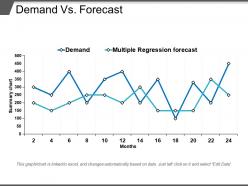 Demand vs forecast ppt samples
Presenting Demand Vs Forecast PPT Samples PowerPoint template. This presentation diagram is 100% editable in PowerPoint software. This will allow you to modify the font type, size, and colors of the slide, etc. according to the situation. The slide is compatible with Google Slides and can be saved in popular image formats such as JPG or PDF. High-quality graphics and icons ensure that there is no distortion in the quality even when these are viewed in fullscreen.
-
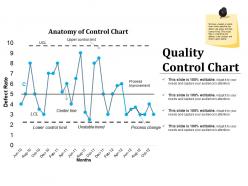 Quality control chart powerpoint graphics
Presenting quality control chart powerpoint graphics. This is a quality control chart powerpoint graphics. This is a one stage process. The stages in this process are center line, lower control limit, unstable trend, process change.
-
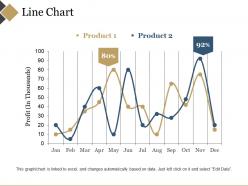 Line chart powerpoint templates
Presenting Line Chart PowerPoint Templates. You can alter the font size, font type, font color, and shape used according to your needs as this PPT layout is 100% customizable. This PowerPoint template is Google Slides compatible and is easily accessible. This easy to download PPT theme can be easily opened and saved in various formats like JPG, PDF, and PNG.
-
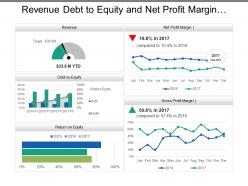 Revenue debt to equity and net profit margin sales dashboard
Presenting this set of slides with name - Revenue Debt To Equity And Net Profit Margin Sales Dashboard. This is a five stage process. The stages in this process are Sales Dashboard, Sales Kpis, Sales Performance.
-
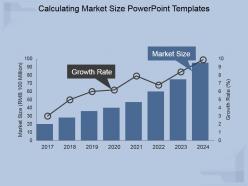 Calculating market size powerpoint templates
Presenting calculating market size powerpoint templates. This is a calculating market size powerpoint templates. This is a eight stage process. The stages in this process are growth rate, market size.
-
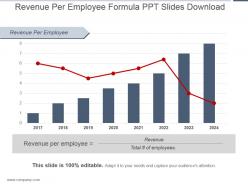 Revenue per employee formula ppt slides download
Presenting revenue per employee formula ppt slides download. This is a revenue per employee formula ppt slides download. This is a eight stage process. The stages in this process are revenue per employee, revenue, total of employees.
-
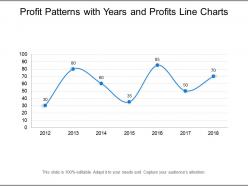 Profit patterns with years and profits line charts
Presenting this set of slides with name - Profit Patterns With Years And Profits Line Charts. This is a one stage process. The stages in this process are Profit Pattern, Profit Design, Profit Order.
-
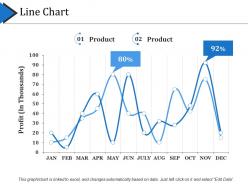 Line chart presentation powerpoint
Presenting this set of slides with name - Line Chart Presentation Powerpoint. This is a two stage process. The stages in this process are Business, Marketing, Percentage, Profit, Line Chart.
-
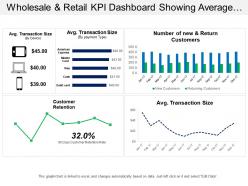 Wholesale and retail kpi dashboard showing average transaction size and customer retention
Presenting this set of slides with name - Wholesale And Retail Kpi Dashboard Showing Average Transaction Size And Customer Retention. This is a four stage process. The stages in this process are Wholesale And Retail, Extensive And Retail, Wholesale And Distribute.
-
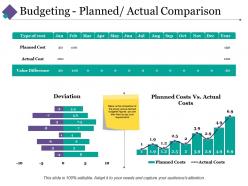 Budgeting planned actual comparison ppt pictures clipart images
Providing budgeting planned actual comparison PPT pictures clipart images. Presentation design can be shared in standard and widescreen view. High resolution ensures no pixel break even when shared with large viewers. PowerPoint template can be amended as required and transform into JPG and PDF format. Fully adjustable design with Google Slides as merge well. Ideas to share business communication effectively Easy to adapt and download with different nodes and stages.
-
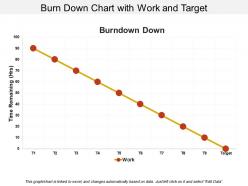 Burn down chart with work and target
Presenting this set of slides with name - Burn Down Chart With Work And Target. This is a one stage process. The stages in this process are Burn Down Chart, Agile Software Development Chart, Run Chart.
-
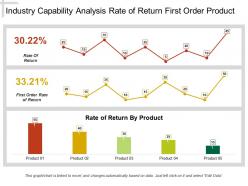 Industry capability analysis rate of return first order product
The biggest advantage of this industry capability slideshow is it’s linking to excel; you can put your business figures into excel sheet and it will automatically get changed in the charts on PPT design. The design slide is 100% editable; you can modify and personalize the design according to your business needs. The slides are compatible with Google Slides and MS PowerPoint software. Slides are fully supported on full screen and standard view.
-
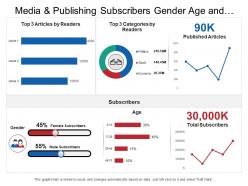 Media and publishing subscribers gender age and categories dashboard
Presenting this set of slides with name - Media And Publishing Subscribers Gender Age And Categories Dashboard. This is a six stage process. The stages in this process are Media And Publishing, Media Communication.
-
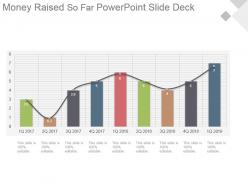 Money raised so far powerpoint slide deck
Presenting money raised so far powerpoint slide deck. This is a money raised so far powerpoint slide deck. This is a nine stage process. The stages in this process are business, marketing, growth, rising, management.
-
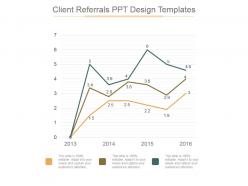 Client referrals ppt design templates
Presenting client referrals ppt design templates. This is a client referrals ppt design templates. This is a three stage process. The stages in this process are client, referrals, design, strategy, marketing.
-
 Line chart ppt slides
Presenting this set of slides with name - Line Chart Ppt Slides. This is a two stage process. The stages in this process are Line Chart, Growth, Business, Marketing, Planning.
-
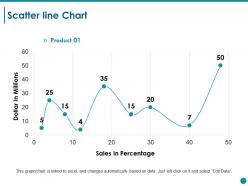 Scatter line chart ppt styles graphics download
Presenting this set of slides with name - Scatter Line Chart Ppt Styles Graphics Download. This is a one stage process. The stages in this process are Business, Marketing, Strategy, Finance, Dollar In Millions, Sales In Percentage.
-
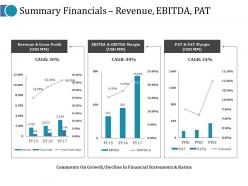 Summary financials revenue ebitda pat ppt pictures design inspiration
Presenting this set of slides with name - Summary Financials Revenue Ebitda Pat Ppt Pictures Design Inspiration. This is a three stage process. The stages in this process are Revenue And Gross Profit, Comments On Growth, Ebitda, Column.
-
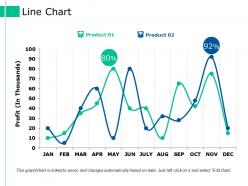 Line chart ppt styles visual aids
Presenting this set of slides with name - Line Chart Ppt Styles Visual Aids. This is a two stage process. The stages in this process are Product, Profit, Percentage, Finance, Line Chart.
-
 Revenue split by product and segment ppt icon aids
Presenting this set of slides with name - Revenue Split By Product And Segment Ppt Icon Aids. This is a two stage process. The stages in this process are Revenue By Product, Revenue By Segment, Alloy Steal, Stainless Steal, Carbon Steal.
-
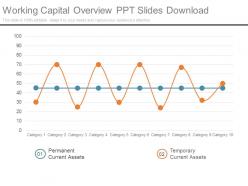 Working capital overview ppt slides download
Presenting working capital overview ppt slides download. This is a working capital overview ppt slides download. This is a two stage process. The stages in this process are business, strategy, line chart, success, management.
-
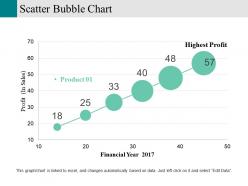 Scatter bubble chart powerpoint slide themes
Presenting Scatter Bubble Chart PowerPoint Slide Themes template. The slide is compatible with MS PowerPoint and other related software. Modify the font type, size, diagram or background color, etc. according to your need. The layout is also compatible with Google Slides and can be saved in numerous images or document formats including JPEG and PDF. Moreover, the slide supports both standard screen (4:3) and widescreen ratios so that the original quality is retained.
-
 Line chart ppt samples
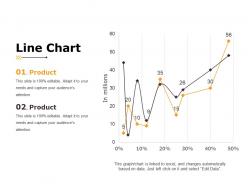
Presenting Line Chart PPT Samples. Alter the font color, size, and style. The color of the diagram and background can be formatted. Save your time with an easily available, completely editable PPT slide. You can add or edit text anywhere in the PowerPoint template. Its compatibility with Google Slides makes it accessible at once. You can customize and save the slide in PDF and JPG formats as well. Can be viewed on standard screen and full screen as well.
-
 Line chart good ppt example
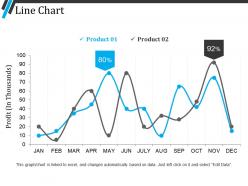
Presenting line chart good ppt example. This is a line chart good ppt example. This is a two stage process. The stages in this process are line chart, finance, growth, analysis, business.
-
 Labour effectiveness dashboard snapshot ppt slides graphics download
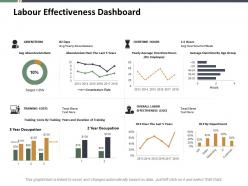
Presenting this set of slides with name - Labour Effectiveness Dashboard Snapshot Ppt Slides Graphics Download. This is a four stage process. The stages in this process are Percentage, Product, Business, Management, Marketing.
-
 Progress comparison chart powerpoint slide backgrounds
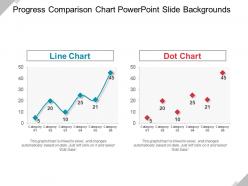
Presenting a PowerPoint slide named Progress comparison chart PowerPoint slide backgrounds. This template with high-quality graphics is completely editable and professionally designed. With an option to change the size, style and color of the font, this slide is ready to use. You can customize the text and color of the diagram as well as the background as per your discretion. The PPT slide is compatible with Google Slides which make it easily accessible. You can customize and save the file as JPG or PDF formats. Once the graph is linked to excel, it automatically changes based on the data. Download this ready to use template.
-
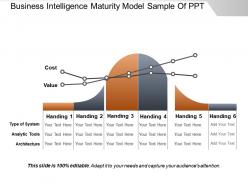 Business intelligence maturity model sample of ppt
Presenting business intelligence maturity model sample of PPT design. PPT can be downloaded and converted into JPEG and PDF formats. You can view the slideshow on normal and full screen design previews. The biggest advantage of downloading this PPT design is that it is fully editable. You can change the font type, color, size, shape, background according to your business preferences. PPT is compatible with multiple software e.g. Google Slides and Microsoft PowerPoint.
-
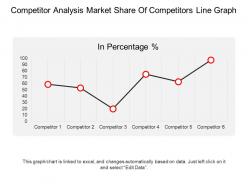 Competitor analysis market share of competitors line graph ppt infographics
Presenting competitor analysis market share of competitors line graph PPT infographics PPT slide. Ease of customization. Replace any words, picture or number provided in the template with your own content and use it for the presentation. You may even incorporate your own company’s name and logo in the presentation for personalization. The visuals used are of high resolution, therefore no issue of image pixelation if projected on a wide screen. Moreover, the presentation is compatible with numerous format and software options. Widely used by every business researcher, analyst, company owner, marketer, consultant, academician, and more.
-
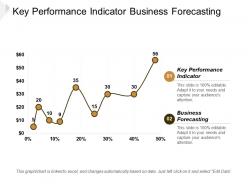 Key performance indicator business forecasting nist risk management cpb
This is an editable one stages graphic that deals with topics like Key Performance Indicator, Business Forecasting, Nist Risk Management to help convey your message better graphically. This product is a premium product available for immediate download, and is 100 percent editable in Powerpoint. Download this now and use it in your presentations to impress your audience.
-
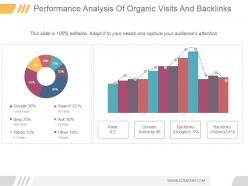 Performance analysis of organic visits and backlinks powerpoint guide
Presenting performance analysis of organic visits and backlinks powerpoint guide. This is a performance analysis of organic visits and backlinks powerpoint guide. This is a two stage process. The stages in this process are rank, domain authority, backlinks google, backlinks yahoo, google, bing, yahoo, search, ask, other.
-
 Web traffic management example of ppt
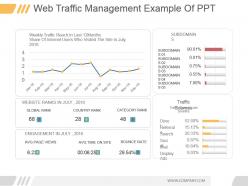
Presenting web traffic management example of ppt. This is a web traffic management example of ppt. This is a four stage process. The stages in this process are website ranks in july, weekly, traffic reach in last 12 months share of internet users who visited the site in july 2016, jan feb, mar, apr, may, jun, jul, aug, sep, oct, nov, dec, website ranks in july, global rank, country rank, category rank, engagement in july, avg page views, avg time on site, bounce rate, subdomains, traffic, traffic share in last 3months, direct, referral, search, soci, mail, display, ads.
-
 Money raised so far powerpoint shapes
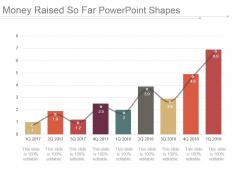
Presenting money raised so far powerpoint shapes. This is a money raised so far powerpoint shapes. This is a nine stage process. The stages in this process are business, marketing, growth, rising, management.
-
 Engineering procurement and construction kpi showing production volume and quantity ordered
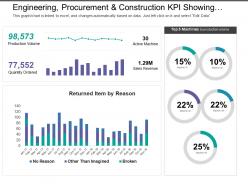
Presenting this set of slides with name - Engineering Procurement And Construction Kpi Showing Production Volume And Quantity Ordered. This is a four stage process. The stages in this process are Engineering, Procurement And Construction, Construction Management, Engineering, Purchasing And Construction .
-
 Line chart presentation graphics
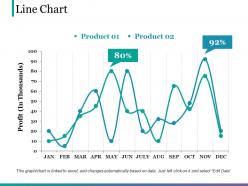
Presenting this set of slides with name - Line Chart Presentation Graphics. This is a two stage process. The stages in this process are Business, Marketing, Finance, Profit, Percentage.
-
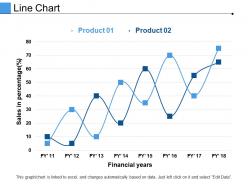 Line chart presentation ideas
Presenting this set of slides with name - Line Chart Presentation Ideas. This is a two stage process. The stages in this process are Finance, Marketing, Bar, Planning, Growth.
-
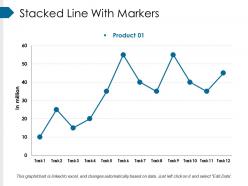 Stacked line with markers ppt background
Presenting this set of slides with name - Stacked Line With Markers Ppt Background. This is a one stage process. The stages in this process are Business, Marketing, Finance, In Million, Graph.
-
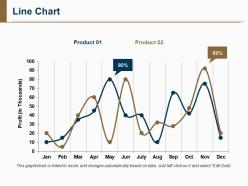 Line chart example ppt presentation
Presenting line chart example PPT presentation PPT slide. The line chart creator PPT template designed by the designers of SlideTeam to illustrate relation between two variables. The line comparison graph chart presentation slide is fully editable in PowerPoint. The line chart axis slide is also compatible with Google Slide and gets linked with Excel data sheet. You can make changes in the font size, font type, color as well as dimensions of the charts in line chart comparison presentation template as per the requirement.
-
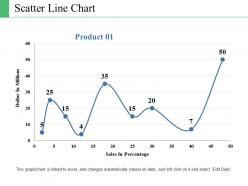 Scatter line chart powerpoint slide graphics
Presenting scatter line chart PowerPoint slide graphics PPT slide. The scatter plot behavior chart presentation slide designed by the professionals of SlideTeam to illustrate combination of all different values. The scatter plot diagram PPT template is fully editable in PowerPoint. The scatter chart analysis presentation slide also compatible with Google Slide and you can share with others as well. A user can make changes in the font size, font type, color as well as dimensions of the charts in scatter plot chart example PPT template as per his requirement.
-
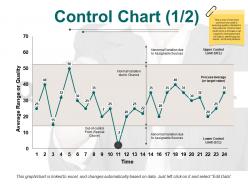 Control chart ppt pictures infographic template
Presenting this set of slides with name - Control Chart Ppt Pictures Infographic Template. This is a two stage process. The stages in this process are Line Chart, Marketing, Strategy, Planning, Finance.
-
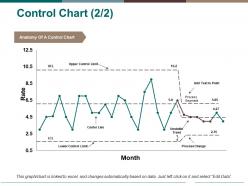 Control chart ppt pictures inspiration
Presenting this set of slides with name - Control Chart Ppt Pictures Inspiration. This is a two stage process. The stages in this process are Line Chart, Marketing, Strategy, Planning, Finance.
-
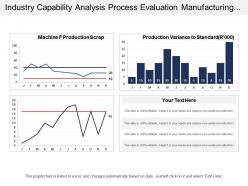 Industry capability analysis process evaluation manufacturing approach 1
The best feature of this slide is that it’s 100% editable; you can modify and customize the design the way you want, all the design elements are editable. Also, the slide is linked with excel, just put your business figures on excel and it will automatically get changed on PPT design charts. The design is 100% downloadable; you can download it as JPEG or PDF formats in a single click. Design can be opened with Google Slides and MS PowerPoint software.
-
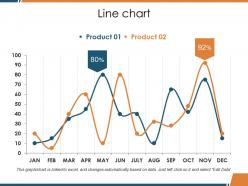 Line chart ppt slide download
Presenting this set of slides with name - Line Chart Ppt Slide Download. This is a two stage process. The stages in this process are Financial, Percentage, Business, Marketing, Chart.
-
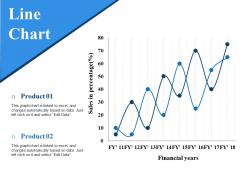 Line chart ppt model
Presenting this set of slides with name - Line Chart Ppt Model. This is a two stage process. The stages in this process are Line Chart, Management, Business, Marketing, Strategy.
-
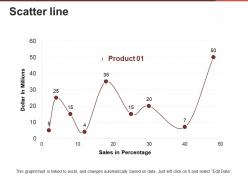 Scatter line presentation powerpoint
Presenting this set of slides with name - Scatter Line Presentation Powerpoint. This is a one stage process. The stages in this process are Scatter line, Finance, Marketing, Analysis, Growth, Business.
-
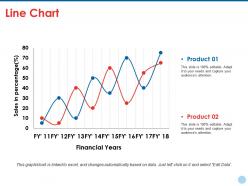 Line chart ppt styles icons
Presenting this set of slides with name - Line Chart Ppt Styles Icons. This is a two stage process. The stages in this process are Business, Marketing, Sales In Percentage, Financial Years, Chart.
-
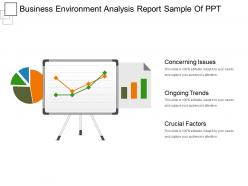 Business environment analysis report sample of ppt
Presenting Business Environment Analysis Report Sample Of PPT. New content such as charts and graphs can be added to the presentation. This PowerPoint template supports both widescreen (16:9) and standard screen aspect ratio(4:3) which is an added advantage. The slide is even compatible with Google Slides. This slide can be saved into image formats such as JPEG, PNG or document formats such as PDF.
-
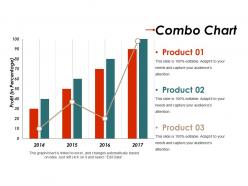 Combo chart good ppt example
Presenting combo chart good ppt example. This is a combo chart good ppt example. This is a three stage process. The stages in this process are product, profit, business, bar graph, success.
-
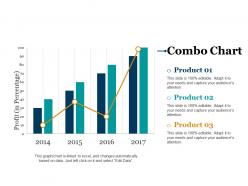 Combo chart powerpoint slide influencers
Presenting combo chart powerpoint slide influencers. This is a combo chart powerpoint slide influencers. This is a four stage process. The stages in this process are profit, combo chart, product.
-
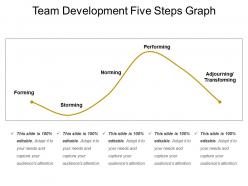 Team development five steps graph
Presenting the Team Development Five Steps Graph PowerPoint layout which is designed by our professionals for your convenience. This template is compatible with Google Slides which makes it easily accessible at once. You can save your presentation and open it in various formats like PDF, JPG, and PNG. Alter the colors, fonts, font size, and font types of the slide as per your requirements. You can freely access the slide in both 4:3 and 16:9 aspect ratio.
-
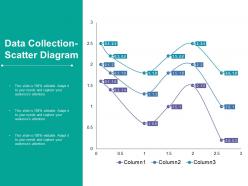 Data collection scatter diagram ppt styles infographics
Presenting this set of slides with name - Data Collection Scatter Diagram Ppt Styles Infographics. This is a three stage process. The stages in this process are Business, Management, Strategy, Analysis, Marketing.
-
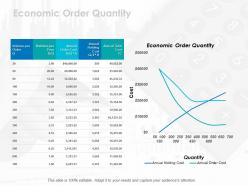 Economic order quantity ppt icon brochure
Presenting this set of slides with name - Economic Order Quantity Ppt Icon Brochure. This is a three stage process. The stages in this process are Business, Management, Strategy, Analysis, Icons.
-
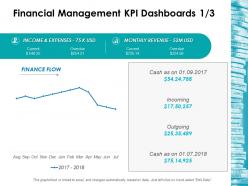 Financial management kpi dashboards 1 3 ppt inspiration structure
Presenting this set of slides with name - Financial Management Kpi Dashboards 1 3 Ppt Inspiration Structure. This is a four stage process. The stages in this process are Business, Management, Strategy, Analysis, Marketing.


