Powerpoint Templates and Google slides for Occupation
Save Your Time and attract your audience with our fully editable PPT Templates and Slides.
-
 Manual For Occupational Health And Safety Powerpoint Presentation Slides
This complete presentation has PPT slides on wide range of topics highlighting the core areas of your business needs. It has professionally designed templates with relevant visuals and subject driven content. This presentation deck has total of fifty seven slides. Get access to the customizable templates. Our designers have created editable templates for your convenience. You can edit the color, text and font size as per your need. You can add or delete the content if required. You are just a click to away to have this ready-made presentation. Click the download button now.
-
 Occupational Stress Management Strategies Powerpoint Presentation Slides
Enthrall your audience with this Occupational Stress Management Strategies Powerpoint Presentation Slides. Increase your presentation threshold by deploying this well-crafted template. It acts as a great communication tool due to its well-researched content. It also contains stylized icons, graphics, visuals etc, which make it an immediate attention-grabber. Comprising fourty eight slides, this complete deck is all you need to get noticed. All the slides and their content can be altered to suit your unique business setting. Not only that, other components and graphics can also be modified to add personal touches to this prefabricated set.
-
 Annual report for occupational therapy pdf doc ppt document report template
This PowerPoint presentation covers Annual Reports and Financial Information of Occupational Therapy institute. This report ppt summarises data relating to the occupational therapy profession such as assessment and intervention to create recover or sustain meaningful individual group or community activities or occupations. This PowerPoint presentation also covers Occupational Therapy financial summary report including end of year financial results reflection on the balance sheet sustainability and revenue growth. This annual report includes financial highlights covering operating profit current assets total equity current ratio revenue streams and membership income. This PowerPoint one pager annual report includes Statement of Profit or Loss and Other Comprehensive Income Statement of Financial Position Statement of Changes in Equity Statement of Cash Flows company details and directors declaration etc. Download our 100 percent editable and customizable template which is also compatible with google slides.
-
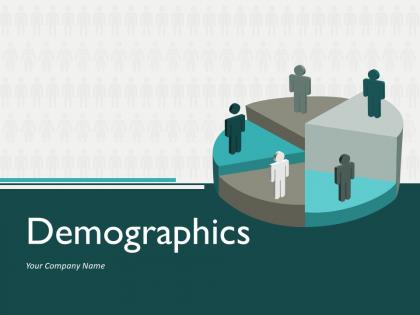 Demographics occupation education marital status expenditures income mobility
Presenting this set of slides with name - Demographics Occupation Education Marital Status Expenditures Income Mobility. It covers all the important concepts and has relevant templates which cater to your business needs. This complete deck has PPT slides on Demographics Occupation Education Marital Status Expenditures Income Mobility with well suited graphics and subject driven content. This deck consists of total of twelve slides. All templates are completely editable for your convenience. You can change the colour, text and font size of these slides. You can add or delete the content as per your requirement. Get access to this professionally designed complete deck presentation by clicking the download button below.
-
 Audit Report Qualified Opinion Adverse Opinion Occupation Health And Safety
Enhance your audiences knowledge with this well researched complete deck. Showcase all the important features of the deck with perfect visuals. This deck comprises of total of twelve slides with each slide explained in detail. Each template comprises of professional diagrams and layouts. Our professional PowerPoint experts have also included icons, graphs and charts for your convenience. All you have to do is DOWNLOAD the deck. Make changes as per the requirement. Yes, these PPT slides are completely customizable. Edit the colour, text and font size. Add or delete the content from the slide. And leave your audience awestruck with the professionally designed Audit Report Qualified Opinion Adverse Opinion Occupation Health And Safety complete deck.
-
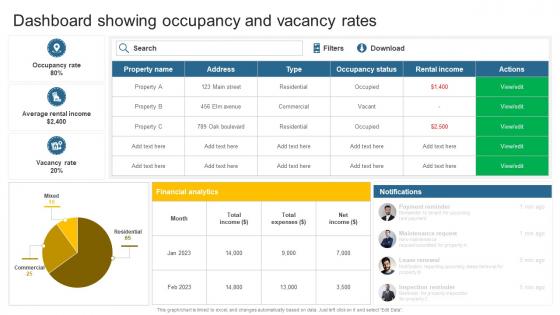 Dashboard Showing Occupancy And Vacancy Leveraging Effective CRM Tool In Real Estate Company
Deliver an outstanding presentation on the topic using this Dashboard Showing Occupancy And Vacancy Leveraging Effective CRM Tool In Real Estate Company. Dispense information and present a thorough explanation of Average Rental Income, Occupancy Rate, Vacancy Rate using the slides given. This template can be altered and personalized to fit your needs. It is also available for immediate download. So grab it now.
-
 Business occupation tax ppt powerpoint presentation ideas graphics design cpb
Presenting our Business Occupation Tax Ppt Powerpoint Presentation Ideas Graphics Design Cpb PowerPoint template design. This PowerPoint slide showcases three stages. It is useful to share insightful information on Business Occupation Tax This PPT slide can be easily accessed in standard screen and widescreen aspect ratios. It is also available in various formats like PDF, PNG, and JPG. Not only this, the PowerPoint slideshow is completely editable and you can effortlessly modify the font size, font type, and shapes according to your wish. Our PPT layout is compatible with Google Slides as well, so download and edit it as per your knowledge.
-
 Six Different Occupations In Powerpoint And Google Slides Cpb
Presenting our Six Different Occupations In Powerpoint And Google Slides Cpb PowerPoint template design. This PowerPoint slide showcases six stages. It is useful to share insightful information on Six Different Occupations This PPT slide can be easily accessed in standard screen and widescreen aspect ratios. It is also available in various formats like PDF, PNG, and JPG. Not only this, the PowerPoint slideshow is completely editable and you can effortlessly modify the font size, font type, and shapes according to your wish. Our PPT layout is compatible with Google Slides as well, so download and edit it as per your knowledge.
-
 Problem Solving Occupations In Powerpoint And Google Slides Cpb
Presenting Problem Solving Occupations In Powerpoint And Google Slides Cpb slide which is completely adaptable. The graphics in this PowerPoint slide showcase Three stages that will help you succinctly convey the information. In addition, you can alternate the color, font size, font type, and shapes of this PPT layout according to your content. This PPT presentation can be accessed with Google Slides and is available in both standard screen and widescreen aspect ratios. It is also a useful set to elucidate topics like Problem Solving Occupations This well-structured design can be downloaded in different formats like PDF, JPG, and PNG. So, without any delay, click on the download button now.
-
 Occupation Worker In Powerpoint And Google Slides Cpb
Presenting our Occupation Worker In Powerpoint And Google Slides Cpb PowerPoint template design. This PowerPoint slide showcases four stages. It is useful to share insightful information on Occupation Worker. This PPT slide can be easily accessed in standard screen and widescreen aspect ratios. It is also available in various formats like PDF, PNG, and JPG. Not only this, the PowerPoint slideshow is completely editable and you can effortlessly modify the font size, font type, and shapes according to your wish. Our PPT layout is compatible with Google Slides as well, so download and edit it as per your knowledge.
-
 Work Occupation Plan In Powerpoint And Google Slides Cpb
Presenting our Work Occupation Plan In Powerpoint And Google Slides Cpb PowerPoint template design. This PowerPoint slide showcases four stages. It is useful to share insightful information on Work Occupation Plan. This PPT slide can be easily accessed in standard screen and widescreen aspect ratios. It is also available in various formats like PDF, PNG, and JPG. Not only this, the PowerPoint slideshow is completely editable and you can effortlessly modify the font size, font type, and shapes according to your wish. Our PPT layout is compatible with Google Slides as well, so download and edit it as per your knowledge.
-
 Salary Averages Occupation In Powerpoint And Google Slides Cpb
Presenting our Salary Averages Occupation In Powerpoint And Google Slides Cpb PowerPoint template design. This PowerPoint slide showcases four stages. It is useful to share insightful information on Salary Averages Occupation. This PPT slide can be easily accessed in standard screen and widescreen aspect ratios. It is also available in various formats like PDF, PNG, and JPG. Not only this, the PowerPoint slideshow is completely editable and you can effortlessly modify the font size, font type, and shapes according to your wish. Our PPT layout is compatible with Google Slides as well, so download and edit it as per your knowledge.
-
 Community Integration Occupational In Powerpoint And Google Slides Cpb
Presenting Community Integration Occupational In Powerpoint And Google Slides Cpb slide which is completely adaptable. The graphics in this PowerPoint slide showcase Two stages that will help you succinctly convey the information. In addition, you can alternate the color, font size, font type, and shapes of this PPT layout according to your content. This PPT presentation can be accessed with Google Slides and is available in both standard screen and widescreen aspect ratios. It is also a useful set to elucidate topics like Community Integration Occupational. This well-structured design can be downloaded in different formats like PDF, JPG, and PNG. So, without any delay, click on the download button now.
-
 Personal Context Occupational Therapy In Powerpoint And Google Slides Cpb
Presenting our Personal Context Occupational Therapy In Powerpoint And Google Slides Cpb PowerPoint template design. This PowerPoint slide showcases four stages. It is useful to share insightful information on Personal Context Occupational Therapy This PPT slide can be easily accessed in standard screen and widescreen aspect ratios. It is also available in various formats like PDF, PNG, and JPG. Not only this, the PowerPoint slideshow is completely editable and you can effortlessly modify the font size, font type, and shapes according to your wish. Our PPT layout is compatible with Google Slides as well, so download and edit it as per your knowledge.
-
 Occupational Disabilities Workplace In Powerpoint And Google Slides Cpb
Presenting our Occupational Disabilities Workplace In Powerpoint And Google Slides Cpb PowerPoint template design. This PowerPoint slide showcases six stages. It is useful to share insightful information on Occupational Disabilities Workplace. This PPT slide can be easily accessed in standard screen and widescreen aspect ratios. It is also available in various formats like PDF, PNG, and JPG. Not only this, the PowerPoint slideshow is completely editable and you can effortlessly modify the font size, font type, and shapes according to your wish. Our PPT layout is compatible with Google Slides as well, so download and edit it as per your knowledge.
-
 Occupancy Cost Ratio Retail In Powerpoint And Google Slides Cpb
Presenting Occupancy Cost Ratio Retail In Powerpoint And Google Slides Cpb slide which is completely adaptable. The graphics in this PowerPoint slide showcase three stages that will help you succinctly convey the information. In addition, you can alternate the color, font size, font type, and shapes of this PPT layout according to your content. This PPT presentation can be accessed with Google Slides and is available in both standard screen and widescreen aspect ratios. It is also a useful set to elucidate topics like Occupancy Cost Ratio Retail. This well-structured design can be downloaded in different formats like PDF, JPG, and PNG. So, without any delay, click on the download button now.
-
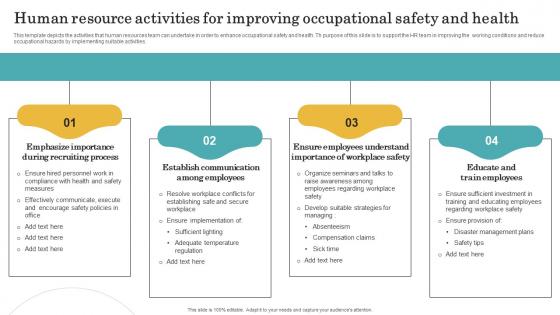 Human Resource Activities For Improving Occupational Safety And Health
This template depicts the activities that human resources team can undertake in order to enhance occupational safety and health. Th purpose of this slide is to support the HR team in improving the working conditions and reduce occupational hazards by implementing suitable activities. Presenting our set of slides with Human Resource Activities For Improving Occupational Safety And Health. This exhibits information on four stages of the process. This is an easy to edit and innovatively designed PowerPoint template. So download immediately and highlight information on Emphasize, Employees, Safety.
-
 Occupational Travels AI Image PowerPoint Presentation PPT ECS
Introducing a Visual PPT on Occupational Travels. Each PowerPoint Slide has been crafted by our Presentation Specialists. Easily update content to your liking, by adding or removing details. Also, the PPT Template is adaptable to all screen sizes and monitors and is even compatible with Google Slides. Download the PPT, add or delete content, and showcase it with assurance.
-
 Occupational Expeditions AI Image PowerPoint Presentation PPT ECS
Introducing a Visual PPT on Occupational Expeditions. Our Presentation Specialists have taken great care in designing each slide in this PowerPoint. Feel free to tailor the content. The PPT Template fits well with any screen size, and its also compatible with Google Slides. Download the PPT, and present it confidently.
-
 Occupational Shortfalls AI Image PowerPoint Presentation PPT ECS
Introducing a Visual PPT on Occupational Shortfalls. Each PowerPoint Slide has been crafted by our Presentation Specialists. Easily update content to your liking, by adding or removing details. Also, the PPT Template is adaptable to all screen sizes and monitors and is even compatible with Google Slides. Download the PPT, add or delete content, and showcase it with assurance.
-
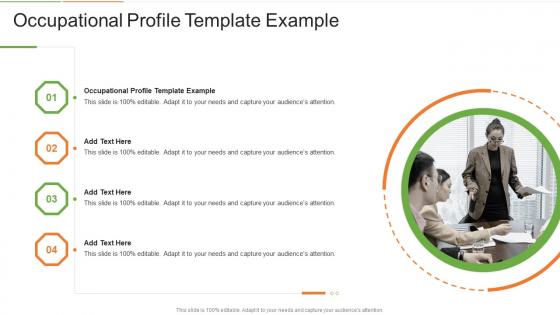 Occupational Profile Template Example In Powerpoint And Google Slides Cpb
Presenting Occupational Profile Template Example In Powerpoint And Google Slides Cpb slide which is completely adaptable. The graphics in this PowerPoint slide showcase four stages that will help you succinctly convey the information. In addition, you can alternate the color, font size, font type, and shapes of this PPT layout according to your content. This PPT presentation can be accessed with Google Slides and is available in both standard screen and widescreen aspect ratios. It is also a useful set to elucidate topics like Occupational Profile Template Example. This well structured design can be downloaded in different formats like PDF, JPG, and PNG. So, without any delay, click on the download button now.
-
 Occupational Health News In Powerpoint And Google Slides Cpb
Presenting Occupational Health News In Powerpoint And Google Slides Cpb slide which is completely adaptable. The graphics in this PowerPoint slide showcase six stages that will help you succinctly convey the information. In addition, you can alternate the color, font size, font type, and shapes of this PPT layout according to your content. This PPT presentation can be accessed with Google Slides and is available in both standard screen and widescreen aspect ratios. It is also a useful set to elucidate topics like Occupational Health News. This well structured design can be downloaded in different formats like PDF, JPG, and PNG. So, without any delay, click on the download button now.
-
 Average Certain Occupation In Powerpoint And Google Slides Cpb
Presenting Average Certain Occupation In Powerpoint And Google Slides Cpb slide which is completely adaptable. The graphics in this PowerPoint slide showcase four stages that will help you succinctly convey the information. In addition, you can alternate the color, font size, font type, and shapes of this PPT layout according to your content. This PPT presentation can be accessed with Google Slides and is available in both standard screen and widescreen aspect ratios. It is also a useful set to elucidate topics like Average Certain Occupation. This well structured design can be downloaded in different formats like PDF, JPG, and PNG. So, without any delay, click on the download button now.
-
 Occupational Proficiencies AI Image PowerPoint Presentation PPT ECS
Introducing a Visual PPT on Occupational Proficiencies. Each PPT Slide is a testament to the expertise of our Design Teams Craftsmen. Personalize the Google Slides compatible PowerPoint Slide with ease. Download the PPT, modify as you desire, and showcase it with poise.
-
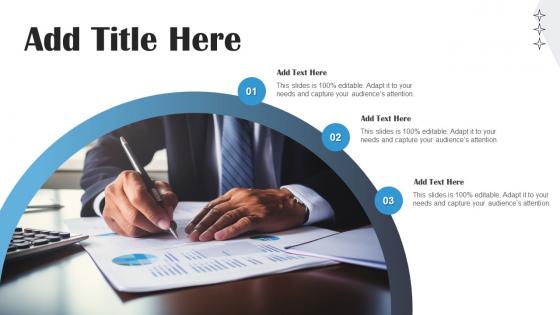 Occupational Qualifications AI Image PowerPoint Presentation PPT ECS
Introducing a Visual PPT on Occupational Qualifications. Each PPT Slide is a testament to the expertise of our Design Teams Craftsmen. Personalize the Google Slides compatible PowerPoint Slide with ease. Download the PPT, modify as you desire, and showcase it with poise.
-
 Occupation Dominican In Powerpoint And Google Slides Cpb
Presenting our Occupation Dominican In Powerpoint And Google Slides Cpb PowerPoint template design. This PowerPoint slide showcases four stages. It is useful to share insightful information on Occupation Dominican This PPT slide can be easily accessed in standard screen and widescreen aspect ratios. It is also available in various formats like PDF, PNG, and JPG. Not only this, the PowerPoint slideshow is completely editable and you can effortlessly modify the font size, font type, and shapes according to your wish. Our PPT layout is compatible with Google Slides as well, so download and edit it as per your knowledge.
-
 Salary Rates Occupation In Powerpoint And Google Slides Cpb
Presenting Salary Rates Occupation In Powerpoint And Google Slides Cpb slide which is completely adaptable. The graphics in this PowerPoint slide showcase four stages that will help you succinctly convey the information. In addition, you can alternate the color, font size, font type, and shapes of this PPT layout according to your content. This PPT presentation can be accessed with Google Slides and is available in both standard screen and widescreen aspect ratios. It is also a useful set to elucidate topics like Salary Rates Occupation. This well-structured design can be downloaded in different formats like PDF, JPG, and PNG. So, without any delay, click on the download button now.
-
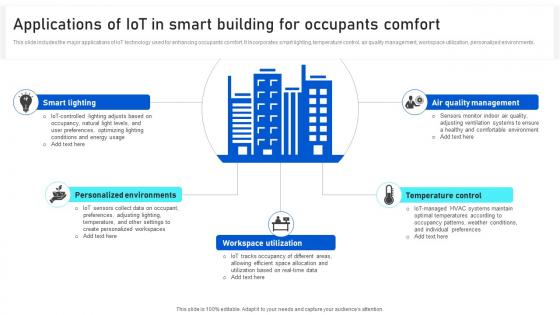 Analyzing IoTs Smart Building Applications Of IoT In Smart Building For Occupants IoT SS
This slide includes the major applications of IoT technology used for enhancing occupants comfort. It incorporates smart lighting, temperature control, air quality management, workspace utilization, personalized environments. Increase audience engagement and knowledge by dispensing information using Analyzing IoTs Smart Building Applications Of IoT In Smart Building For Occupants IoT SS. This template helps you present information on five stages. You can also present information on Personalized, Workspace, Temperature using this PPT design. This layout is completely editable so personaize it now to meet your audiences expectations.
-
 Headache Occupational Health In Powerpoint And Google Slides Cpb
Presenting our Headache Occupational Health In Powerpoint And Google Slides Cpb PowerPoint template design. This PowerPoint slide showcases four stages. It is useful to share insightful information on Headache Occupational Health This PPT slide can be easily accessed in standard screen and widescreen aspect ratios. It is also available in various formats like PDF, PNG, and JPG. Not only this, the PowerPoint slideshow is completely editable and you can effortlessly modify the font size, font type, and shapes according to your wish. Our PPT layout is compatible with Google Slides as well, so download and edit it as per your knowledge.
-
 Physical Occupational Therapy In Powerpoint And Google Slides Cpb
Presenting our Physical Occupational Therapy In Powerpoint And Google Slides Cpb PowerPoint template design. This PowerPoint slide showcases four stages. It is useful to share insightful information on Physical Occupational Therapy. This PPT slide can be easily accessed in standard screen and widescreen aspect ratios. It is also available in various formats like PDF, PNG, and JPG. Not only this, the PowerPoint slideshow is completely editable and you can effortlessly modify the font size, font type, and shapes according to your wish. Our PPT layout is compatible with Google Slides as well, so download and edit it as per your knowledge.
-
 Lungs Occupational Health Types In Powerpoint And Google Slides Cpb
Presenting Lungs Occupational Health Types In Powerpoint And Google Slides Cpb slide which is completely adaptable. The graphics in this PowerPoint slide showcase four stages that will help you succinctly convey the information. In addition, you can alternate the color, font size, font type, and shapes of this PPT layout according to your content. This PPT presentation can be accessed with Google Slides and is available in both standard screen and widescreen aspect ratios. It is also a useful set to elucidate topics like Lungs Occupational Health Types. This well structured design can be downloaded in different formats like PDF, JPG, and PNG. So, without any delay, click on the download button now.
-
 Spider Bites Occupational Health In Powerpoint And Google Slides Cpb
Presenting Spider Bites Occupational Health In Powerpoint And Google Slides Cpb slide which is completely adaptable. The graphics in this PowerPoint slide showcase three stages that will help you succinctly convey the information. In addition, you can alternate the color, font size, font type, and shapes of this PPT layout according to your content. This PPT presentation can be accessed with Google Slides and is available in both standard screen and widescreen aspect ratios. It is also a useful set to elucidate topics like Spider Bites Occupational Health This well structured design can be downloaded in different formats like PDF, JPG, and PNG. So, without any delay, click on the download button now.
-
 Carpal Tunnel Occupational Chart In Powerpoint And Google Slides Cpb
Presenting our Carpal Tunnel Occupational Chart In Powerpoint And Google Slides Cpb PowerPoint template design. This PowerPoint slide showcases three stages. It is useful to share insightful information on Carpal Tunnel Occupational Chart This PPT slide can be easily accessed in standard screen and widescreen aspect ratios. It is also available in various formats like PDF, PNG, and JPG. Not only this, the PowerPoint slideshow is completely editable and you can effortlessly modify the font size, font type, and shapes according to your wish. Our PPT layout is compatible with Google Slides as well, so download and edit it as per your knowledge.
-
 Income Education Occupation Dimensions In Powerpoint And Google Slides Cpb
Presenting our Income Education Occupation Dimensions In Powerpoint And Google Slides Cpb PowerPoint template design. This PowerPoint slide showcases three stages. It is useful to share insightful information on Income Education Occupation Dimensions This PPT slide can be easily accessed in standard screen and widescreen aspect ratios. It is also available in various formats like PDF, PNG, and JPG. Not only this, the PowerPoint slideshow is completely editable and you can effortlessly modify the font size, font type, and shapes according to your wish. Our PPT layout is compatible with Google Slides as well, so download and edit it as per your knowledge.
-
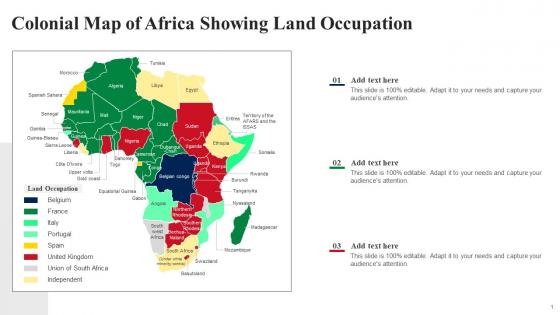 Colonial Map Of Africa Showing Land Occupation
Introducing our premium set of slides with Colonial Map Of Africa Showing Land Occupation. Ellicudate the three stages and present information using this PPT slide. This is a completely adaptable PowerPoint template design that can be used to interpret topics like Colonial Presence In Africa, Colonialization Of Africa, African Colonial Languages, Colonial Land Occupation In Africa. So download instantly and tailor it with your information.
-
 Malingering Occupational In Powerpoint And Google Slides Cpb
Presenting our Malingering Occupational In Powerpoint And Google Slides Cpb PowerPoint template design. This PowerPoint slide showcases five stages. It is useful to share insightful information on Malingering Occupational. This PPT slide can be easily accessed in standard screen and widescreen aspect ratios. It is also available in various formats like PDF, PNG, and JPG. Not only this, the PowerPoint slideshow is completely editable and you can effortlessly modify the font size, font type, and shapes according to your wish. Our PPT layout is compatible with Google Slides as well, so download and edit it as per your knowledge.
-
 Occupational Therapy Self Care Goals In Powerpoint And Google Slides Cpb
Presenting our Occupational Therapy Self Care Goals In Powerpoint And Google Slides Cpb PowerPoint template design. This PowerPoint slide showcases four stages. It is useful to share insightful information on Occupational Therapy Self Care Goals This PPT slide can be easily accessed in standard screen and widescreen aspect ratios. It is also available in various formats like PDF, PNG, and JPG. Not only this, the PowerPoint slideshow is completely editable and you can effortlessly modify the font size, font type, and shapes according to your wish. Our PPT layout is compatible with Google Slides as well, so download and edit it as per your knowledge.
-
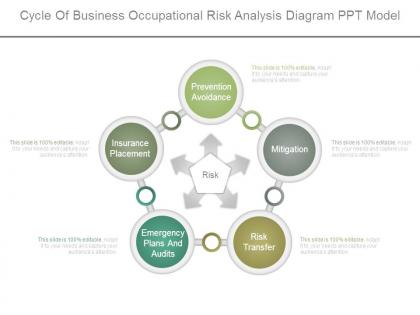 Cycle of business occupational risk analysis diagram ppt model
Presenting cycle of business occupational risk analysis diagram ppt model. This is a cycle of business occupational risk analysis diagram ppt model. This is a five stage process. The stages in this process are prevention avoidance, mitigation, risk transfer, emergency plans and audits, insurance placement.
-
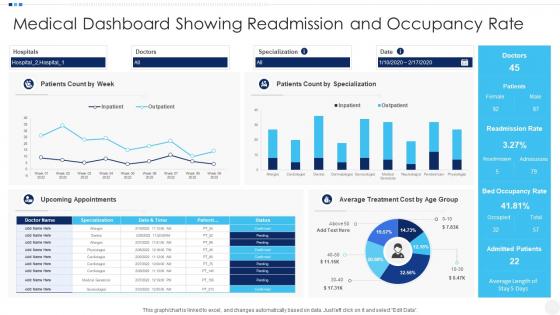 Medical Dashboard Showing Readmission And Occupancy Rate
Presenting our well structured Medical Dashboard Showing Readmission And Occupancy Rate. The topics discussed in this slide are Medical Dashboard Showing Readmission And Occupancy Rate. This is an instantly available PowerPoint presentation that can be edited conveniently. Download it right away and captivate your audience.
-
 Occupational Stress Management Organizational Change And Stress
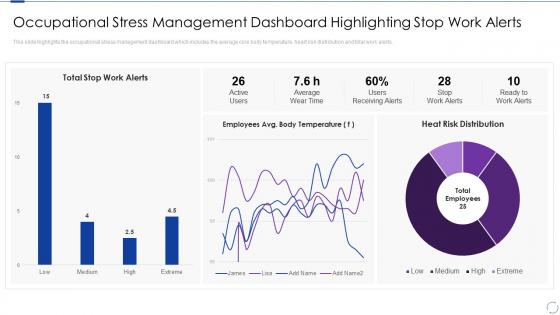
This slide highlights the occupational stress management dashboard which includes the average core body temperature, heart risk distribution and total work alerts. Deliver an outstanding presentation on the topic using this Occupational Stress Management Organizational Change And Stress. Dispense information and present a thorough explanation of Occupational Stress Management Dashboard Highlighting Stop Work Alerts using the slides given. This template can be altered and personalized to fit your needs. It is also available for immediate download. So grab it now.
-
 Occupational Stress Management Dashboard Occupational Stress Management Strategies
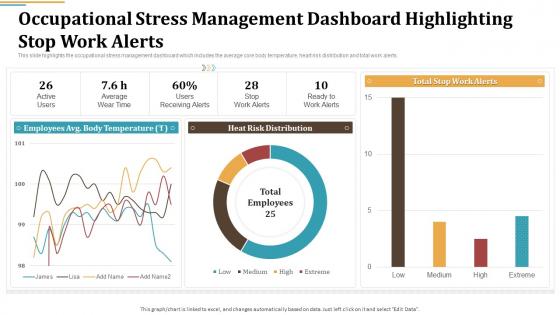
This slide highlights the occupational stress management dashboard which includes the average core body temperature, heart risk distribution and total work alerts. Deliver an outstanding presentation on the topic using this Occupational Stress Management Dashboard Occupational Stress Management Strategies. Dispense information and present a thorough explanation of Occupational Stress Management Dashboard Highlighting Stop Work Alerts using the slides given. This template can be altered and personalized to fit your needs. It is also available for immediate download. So grab it now.
-
 Occupational Stress Management Strategies Consequences From Work Related Stress
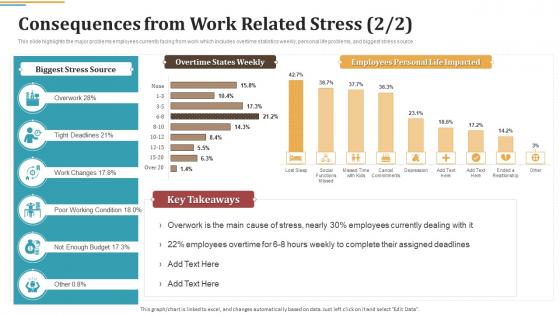
This slide highlights the major problems employees currently facing from work which includes overtime statistics weekly, personal life problems, and biggest stress source. Deliver an outstanding presentation on the topic using this Occupational Stress Management Strategies Consequences From Work Related Stress. Dispense information and present a thorough explanation of Consequences From Work Related Stress using the slides given. This template can be altered and personalized to fit your needs. It is also available for immediate download. So grab it now.
-
 Stress Management Dashboard With Occupational Stress Management Strategies
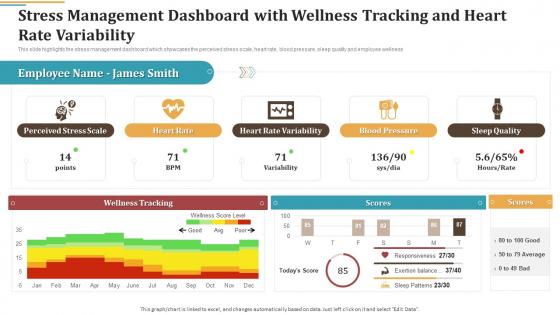
This slide highlights the stress management dashboard which showcases the perceived stress scale, heart rate, blood pressure, sleep quality and employee wellness. Present the topic in a bit more detail with this Stress Management Dashboard With Occupational Stress Management Strategies. Use it as a tool for discussion and navigation on Stress Management Dashboard With Wellness Tracking And Heart Rate Variability. This template is free to edit as deemed fit for your organization. Therefore download it now.
-
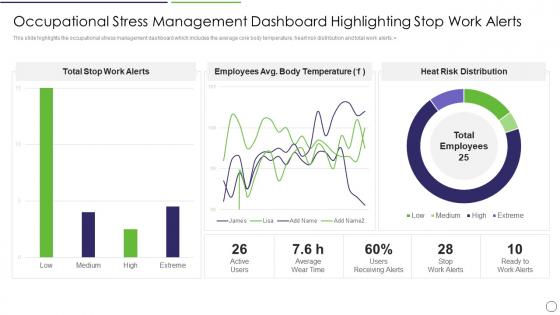 Workplace Stress Management Strategies Occupational Stress Management Dashboard
This slide highlights the occupational stress management dashboard which includes the average core body temperature, heart risk distribution and total work alerts. Deliver an outstanding presentation on the topic using this Workplace Stress Management Strategies Occupational Stress Management Dashboard. Dispense information and present a thorough explanation of Occupational Stress Management Dashboard Highlighting Stop Work Alerts using the slides given. This template can be altered and personalized to fit your needs. It is also available for immediate download. So grab it now.
-
 Real Estate Management System Dashboard With Occupancy Rate
This slide represents the dashboard of the real estate management system. It includes details related to net income, occupancy rate, talent acquisition cost, tenant turn over, loss due to vacancy etc. Introducing our Real Estate Management System Dashboard With Occupancy Rate set of slides. The topics discussed in these slides are Real Estate Management System Dashboard With Occupancy Rate. This is an immediately available PowerPoint presentation that can be conveniently customized. Download it and convince your audience.
-
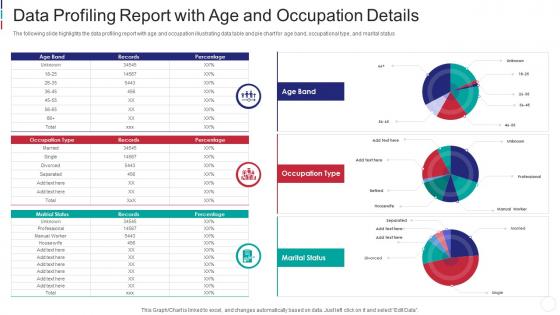 Data profiling report with age and occupation details
The following slide highlights the data profiling report with age and occupation illustrating data table and pie chart for age band, occupational type, and marital status. Introducing our Data Profiling Report With Age And Occupation Details set of slides. The topics discussed in these slides are Data Profiling Report With Age And Occupation Details. This is an immediately available PowerPoint presentation that can be conveniently customized. Download it and convince your audience.
-
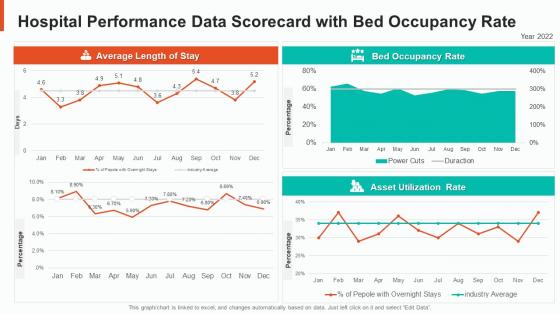 Hospital performance data scorecard with bed occupancy rate
Present the topic in a bit more detail with this Hospital Performance Data Scorecard With Bed Occupancy Rate. Use it as a tool for discussion and navigation on Scorecard, Occupancy, Performance. This template is free to edit as deemed fit for your organization. Therefore download it now.
-
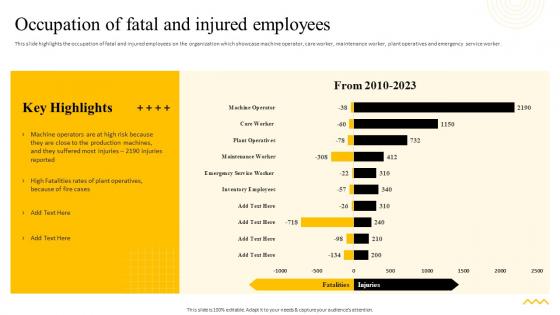 Recommended Practices For Workplace Safety Occupation Of Fatal And Injured Employees
This slide highlights the occupation of fatal and injured employees on the organization which showcase machine operator, care worker, maintenance worker, plant operatives and emergency service worker. Present the topic in a bit more detail with this Recommended Practices For Workplace Safety Occupation Of Fatal And Injured Employees. Use it as a tool for discussion and navigation on Occupation, Fatal And Injured Employees, Plant Operatives. This template is free to edit as deemed fit for your organization. Therefore download it now.
-
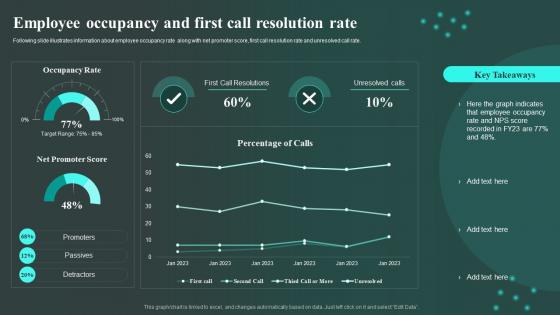 Employee Occupancy And First Call Resolution Rate Workplace Innovation And Technological
Following slide illustrates information about employee occupancy rate along with net promoter score, first call resolution rate and unresolved call rate. Deliver an outstanding presentation on the topic using this Employee Occupancy And First Call Resolution Rate Workplace Innovation And Technological. Dispense information and present a thorough explanation of Occupancy Rate, Promoter Score, Employee using the slides given. This template can be altered and personalized to fit your needs. It is also available for immediate download. So grab it now.
-
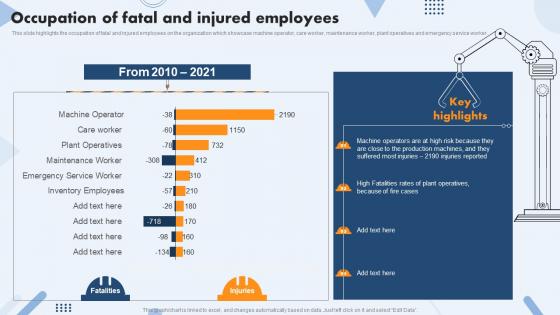 Occupation Of Fatal And Injured Employees Safety Operations And Procedures
This slide highlights the occupation of fatal and injured employees on the organization which showcase machine operator, care worker, maintenance worker, plant operatives and emergency service worker. Present the topic in a bit more detail with this Occupation Of Fatal And Injured Employees Safety Operations And Procedures. Use it as a tool for discussion and navigation on Occupation, Injured Employees, Fatal And Injured. This template is free to edit as deemed fit for your organization. Therefore download it now.
-
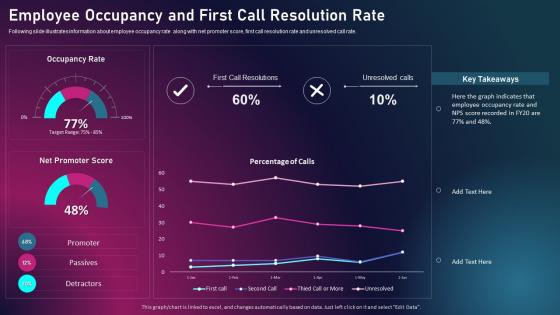 Enhancing Business Performance Through Technological Employee Occupancy And First Call Resolution
Following slide illustrates information about employee occupancy rate along with net promoter score, first call resolution rate and unresolved call rate. Deliver an outstanding presentation on the topic using this Enhancing Business Performance Through Technological Employee Occupancy And First Call Resolution. Dispense information and present a thorough explanation of Employee Occupancy, First Call, Resolution Rate using the slides given. This template can be altered and personalized to fit your needs. It is also available for immediate download. So grab it now.
-
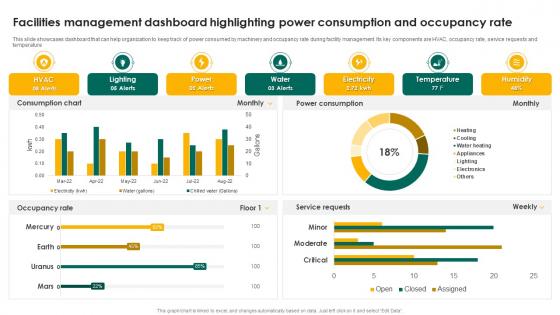 Facilities Management Dashboard Highlighting Power Consumption And Occupancy Rate
This slide showcases dashboard that can help organization to keep track of power consumed by machinery and occupancy rate during facility management. Its key components are HVAC, occupancy rate, service requests and temperature. Presenting our well structured Facilities Management Dashboard Highlighting Power Consumption And Occupancy Rate. The topics discussed in this slide are Consumption Chart, Power Consumption, Occupancy Rate. This is an instantly available PowerPoint presentation that can be edited conveniently. Download it right away and captivate your audience.
-
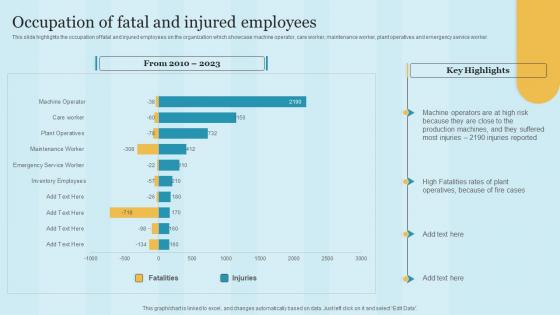 Occupation Of Fatal And Injured Employees Maintaining Health And Safety
This slide highlights the occupation of fatal and injured employees on the organization which showcase machine operator, care worker, maintenance worker, plant operatives and emergency service worker. Present the topic in a bit more detail with this Occupation Of Fatal And Injured Employees Maintaining Health And Safety. Use it as a tool for discussion and navigation on Occupation, injured employees. This template is free to edit as deemed fit for your organization. Therefore download it now.
-
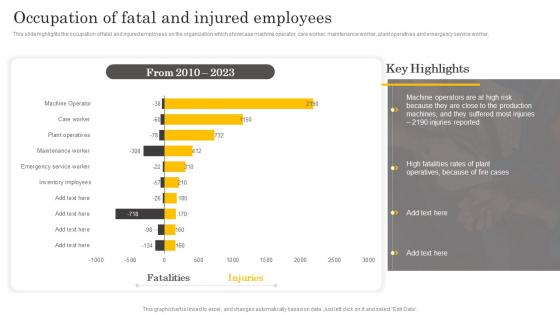 Occupation Of Fatal And Injured Employees Manual For Occupational Health And Safety
This slide highlights the occupation of fatal and injured employees on the organization which showcase machine operator, care worker, maintenance worker, plant operatives and emergency service worker. Present the topic in a bit more detail with this Occupation Of Fatal And Injured Employees Manual For Occupational Health And Safety. Use it as a tool for discussion and navigation on Occupation, Injured Employees. This template is free to edit as deemed fit for your organization. Therefore download it now.
-
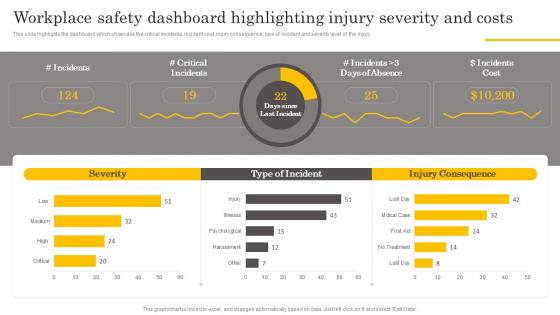 Workplace Safety Dashboard Highlighting Injury Manual For Occupational Health And Safety
This slide highlights the dashboard which showcase the critical incidents, incident cost, injury consequence, type of incident and severity level of the injury. Deliver an outstanding presentation on the topic using this Workplace Safety Dashboard Highlighting Injury Manual For Occupational Health And Safety. Dispense information and present a thorough explanation of Critical Incidents, Workplace Safety, Dashboard using the slides given. This template can be altered and personalized to fit your needs. It is also available for immediate download. So grab it now.
-
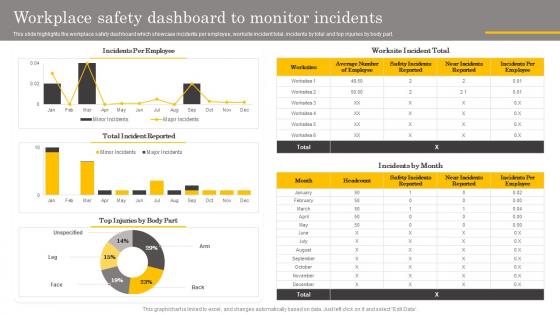 Workplace Safety Dashboard To Monitor Incidents Manual For Occupational Health And Safety
This slide highlights the workplace safety dashboard which showcase incidents per employee, worksite incident total, incidents by total and top injuries by body part. Present the topic in a bit more detail with this Workplace Safety Dashboard To Monitor Incidents Manual For Occupational Health And Safety. Use it as a tool for discussion and navigation on Workplace Safety, Dashboard, Monitor Incidents. This template is free to edit as deemed fit for your organization. Therefore download it now.
-
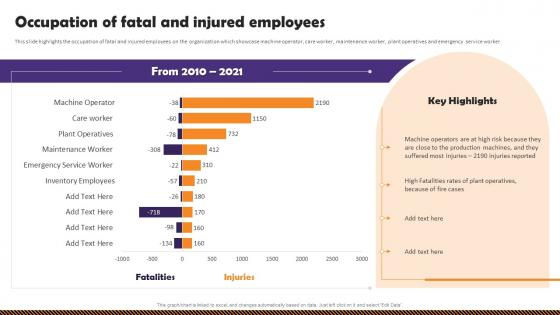 Health And Safety Of Employees Occupation Of Fatal And Injured Employees
This slide highlights the occupation of fatal and injured employees on the organization which showcase machine operator, care worker, maintenance worker, plant operatives and emergency service worker. Present the topic in a bit more detail with this Health And Safety Of Employees Occupation Of Fatal And Injured Employees. Use it as a tool for discussion and navigation on Occupation, Fatal And Injured Employees, Production Machines. This template is free to edit as deemed fit for your organization. Therefore download it now.
-
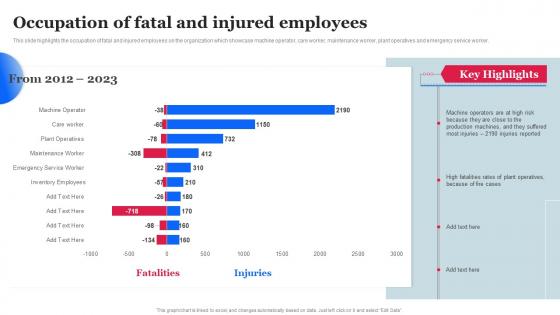 Occupation Of Fatal And Injured Employees Workplace Safety Management Hazard
This slide highlights the occupation of fatal and injured employees on the organization which showcase machine operator, care worker, maintenance worker, plant operatives and emergency service worker. Present the topic in a bit more detail with this Occupation Of Fatal And Injured Employees Workplace Safety Management Hazard. Use it as a tool for discussion and navigation on Occupation, Injured Employees. This template is free to edit as deemed fit for your organization. Therefore download it now.
-
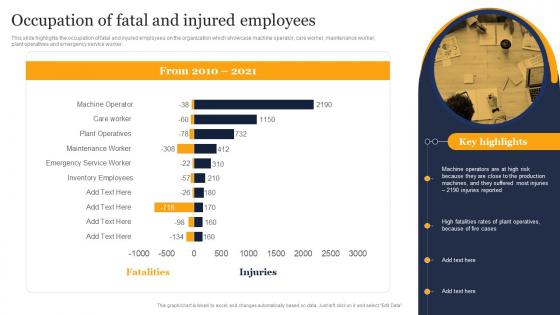 Occupation Of Fatal And Injured Employees Guidelines And Standards For Workplace
This slide highlights the occupation of fatal and injured employees on the organization which showcase machine operator, care worker, maintenance worker, plant operatives and emergency service worker.Present the topic in a bit more detail with this Occupation Of Fatal And Injured Employees Guidelines And Standards For Workplace. Use it as a tool for discussion and navigation on Inventory Employees, Emergency Service, Maintenance Worker. This template is free to edit as deemed fit for your organization. Therefore download it now.
-
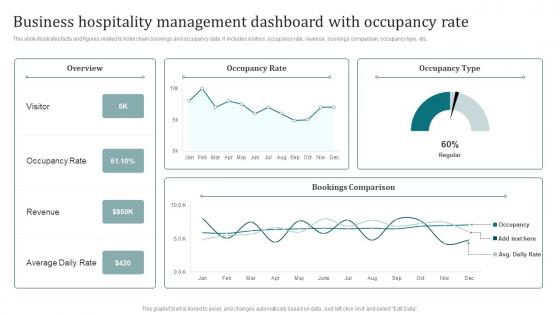 Business Hospitality Management Dashboard With Occupancy Rate
This slide illustrates facts and figures related to hotel chain bookings and occupancy data. It includes visitors, occupancy rate, revenue, bookings comparison, occupancy type, etc. Introducing our Business Hospitality Management Dashboard With Occupancy Rate set of slides. The topics discussed in these slides are Occupancy Rate, Occupancy Type, Bookings Comparison. This is an immediately available PowerPoint presentation that can be conveniently customized. Download it and convince your audience.


