You make an expat friend who needs help in moving around in the city. Because you are already familiar with the rideshares available, you’ll recommend them the best one. If these cab services are priced differently, you’ll also suggest the one suited to your friend’s budget. After a while, when your expat friend forms the same opinion as yours, the rideshare company will have gained a new user and a rise in their Net Promoter Score (NPS).
Suppose for some reason, this company suffers a setback and it impacts user experience. If your expat friend, unknown to this, recommends the same service to another person, a genuine bad experience that is irreparable will now bring down the NPS. Firstly, the company will lose a newly acquired customer, and secondly, this customer will now become the detractor, preventing any new prospect from becoming this cab service’s new user.
Thus, an NPS deduced from customer experiences will help a service provider track their likeability among its users. But NPS isn’t just a theoretical concept, rather survey forms, customer satisfaction metrics, and questionnaires distributed among the test subjects or audiences help businesses determine their NPS.
With NPS being a determiner of customer behavior, it needs to be monitored and the score shared with relevant team members to take remedial actions. In this blog, we have put together 10 of the most-sought, 100% editable, and PowerPoint-compatible NPS dashboard templates for diligent monitoring.
Track how preferable your business is among potential customers and rate their inclination to recommend your service and products to others with our NPS dashboard templates.
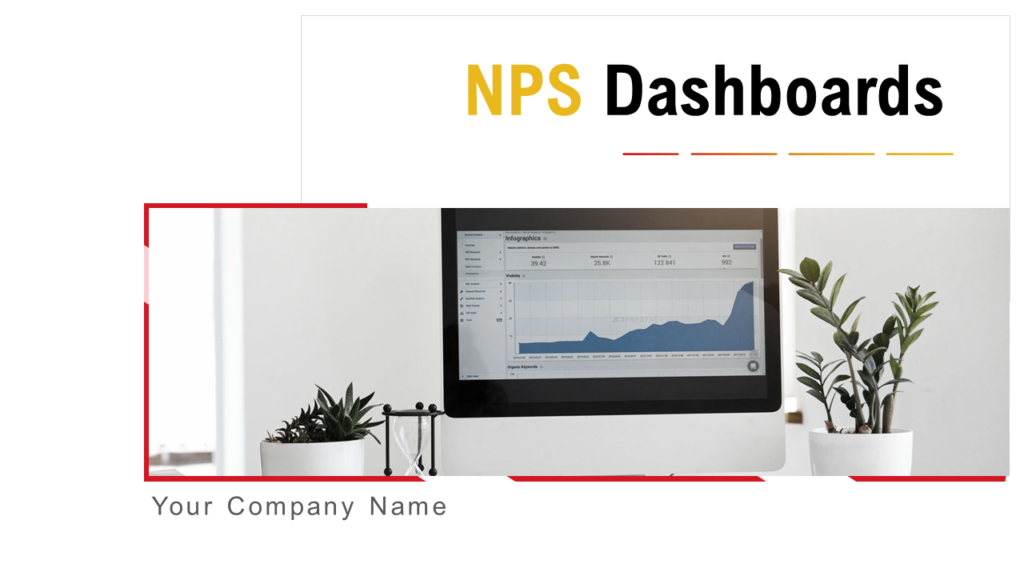
Template 1: NPS Dashboards PowerPoint Presentation
Invest in our dedicated NPS dashboard templates and showcase the likeability for your business among customers. Track preference levels of your customers in referring your business to their peers. Differentiate the total number of test subjects into promoters, detractors, and passives to anticipate customer growth over time. Base your evaluation on survey reports and questionnaires distributed via emails or social media channels. Grab this ready to use complete deck now!
Template 2: Annual NPS Trend and Key Insights
Use this NPS dashboard template to record and compare ratios of promoters, detractors,and passive customers for the entire year on a monthly basis. Use bar graphs to represent this variation. Next, you can compare the net promoter score trend to identify if your business favorability has been improving over the months. Based on these graphs, share key insights that marketers, and product/service developers can use to improve customer experience. Grab this Excel-linked PPT Dashboard now!
Template 3: Quarterly Customer NPS Score Dashboard With Segment Details
Perform a quarterly NPS evaluation of your business and compare scores for different quarters with this dashboard design. Denote the clear number of promoters, detractors, and passives and track their number for different quarters and the overall NPS rating. Use a mix of graphs, area charts, and infographics to emphasize on individual and overall NPS scores for all quarters as shown in the PPT Slide. Get it now from the link below.
Template 4: Complaint Analysis Dashboard With NPS and Customer Retention
Maintain this NPS dashboard to deduce business likeability and track customer experience. Use this dashboard tablet as a part of complaint analysis to the customer retention as you get a clear picture of promoters and their percentage. Monitor these statistics for the same date in different months of the year and deduce where your business is headed in terms of customer experience. Download now.
Template 5: NPS Score Dashboard With Key Drivers of Customer Dissatisfaction
Compare and monitor the customer dissatisfaction by rating your business products with NPS value as shown in this dashboard template. Use this content-ready dashboard design to present company NPS and product NPS. Use the embedded, Excel-linked graphs and charts to project this data. With this dashboard design, you can also showcase the average customer spend by product and the average customer spend and point out whether the trend is upward, downward or constant for a given quarter. Without any ado, grab this ready to use presentation layout now!
Template 6: Churn Analysis Dashboard With NPS and Probability Score
This NPS dashboard is designed to tally and monitor the churn rate for your business. Create this data sheet for prominent customers of your business to compare their tenure days, transaction usage, and NPS using this churn analysis dashboard. Using this data, define their churn probability and prediction to design remedial actions in retaining them as your customers. Grab this premium PPT Layout now to perform this analysis.
Template 7: Net Promoter Score Diagram Template
Signify the NPS for your business and business products by drawing the lines between promoters, detractors, and passives. Indicate the correct span for these categories on a scale between 0-10. Use this NPS diagram to correlate promoters, detractors and net customer acquisition as directed in this PPT Layout. Use color coding to identify the safe and risky scores as you highlight the good NPS score from the troubling ones. Download now.
Template 8: Net Promoter Score Tracker Template
Keep track of the net promoter score and help your evaluators know the fine line of passives between the detractors and the promoters. Perform this analysis for the entire collection in your business inventory and create an overall analysis based on NPS ratings received from customers and their frequency. For more clarity, refer to the NPS dashboard link today.
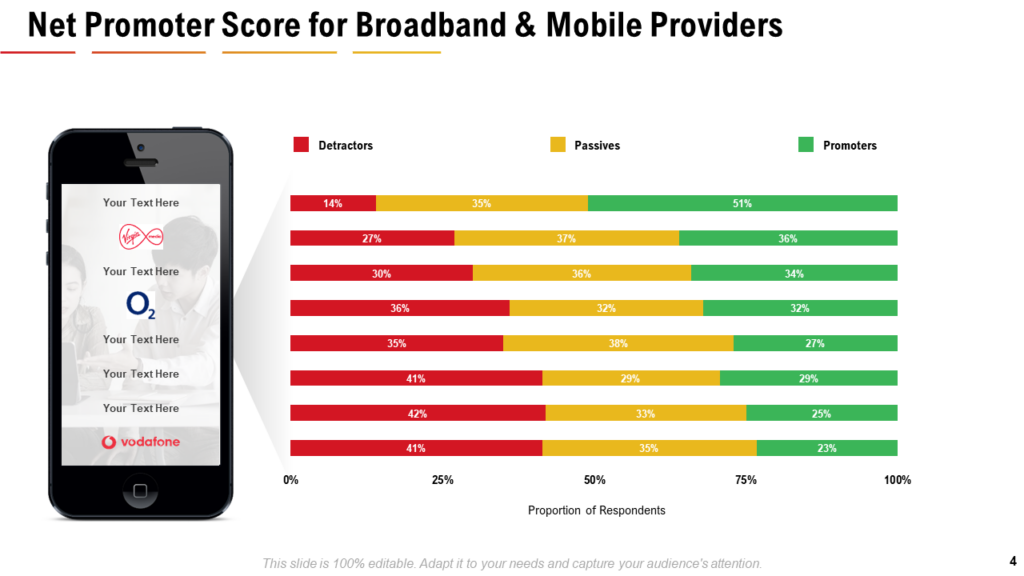
Template 9: NPS score for Broadband and Mobile Network Providers
If you want to draw a comparison of preference between service providers such as internet providers, this NPS dashboard reporter will do. Perform the NPS analysis between available mobile network and broadband service providers to know which has the maximum promoters and minimum detractors. This dashboard design is especially handy when planning to step into this business to identify the profit hotspot. Download it now!
Template 10: Net Promoter Score Dashboard Template
Evaluate all your business stores with this NPS dashboard to identify which has the maximum promoters and those with the maximum detractors. Use this information to then find the NPS value of your stores(NPS= Promoter%-Detractor%) which can be further helpful in creating growth strategies. Use this readymade layout to perform these evaluations now!
Make customers your brand ambassdors and bring potential customer and your business strategies on the same wavelength using our NPS dashboard templates.
PS: Using NPS as a starting point, proceed with identifying the cash cows, or stars of your business with our ready to use BCG matrix templates of this blog.


 Customer Reviews


![Top 10 Product Specification Templates With Samples and Examples [Free PDF Attached]](https://www.slideteam.net/wp/wp-content/uploads/2022/11/product-specification-templates-1013x441.jpg)


