In a world where data has grown faster than the speed of light, where over 70% of all the existing data has sprouted in just the past few years, how do you figure out what it represents? How do you make sense of it and listen to the many stories it is telling you?
That's where SlideTeam’s Results Dashboard Templates come in, almost like superheroes of the data world. They make sense of all those jumbled numbers and convert them into clear, meaningful business stories showing you the full picture of your performance. This is why understanding your business becomes simpler, more intuitive, and genuinely insightful with these dashboards.
But where can you find these invaluable tools?
Look no further than SlideTeam, home to an extensive collection of results dashboard templates that go beyond the ordinary. These templates are expert guides in the world of data, helping you navigate the intricate landscape and extract meaningful insights that can drive your business forward.
With SlideTeam's readymade templates, you can access a powerful resource that empowers you to visualize, analyze, and comprehend your data effortlessly. They are not just tools; they are your compass in the journey towards better decision-making and success.
Want to impress your audience with a clear and concise presentation of survey results? Check out these top 10 survey templates with samples and examples.
So, why wait? Explore SlideTeam's gallery of results dashboard templates and unlock the potential of your data today!
Feeling lost in the goal jungle? Conquer them with proven OKR strategies! Download templates and watch your objectives blossom. Click to learn more!
Template 1: Survey Results Dashboard Infographic
Elevate your survey analysis with our exclusive template bundle. Designed for optimal clarity and maximum impact, it transforms your data into a compelling visual narrative, showcasing vital information such as response rates, positive responses, neutral responses and more. It also capitalizes on the visual representation of product campaign survey results, the company’s net promoter score, immigration stats with aspects like attitude, respondent profile, and more. Whether it's presenting groundbreaking market research findings, unlocking the potential of employee feedback, or dazzling your audience with customer satisfaction survey results, this template is your trusted ally for business meetings and academic presentations.
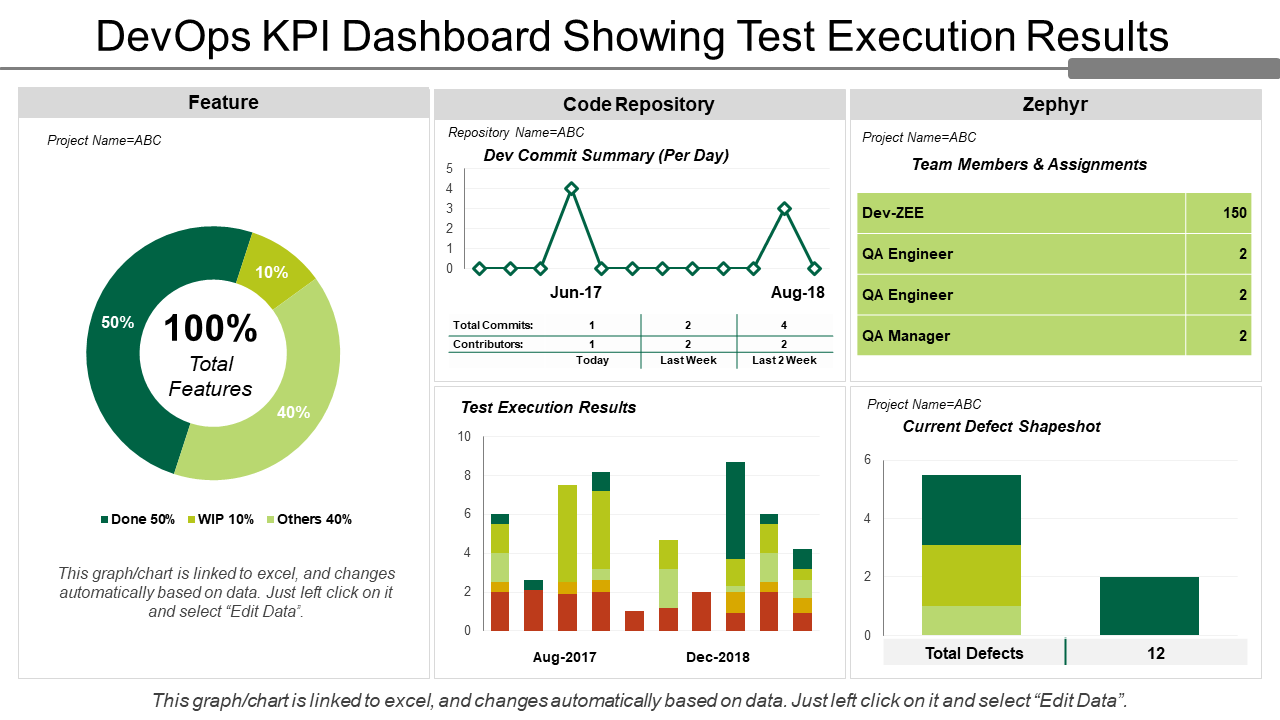
Template 2: DevOps KPI Dashboard Showing Test Execution Results
In the IT world, precision is paramount. Our KPI Dashboard is your secret weapon as it offers an immersive view of your software development health. With a laser focus on metrics like test execution results, code repository status, and defect trends, our dashboard layout enables DevOps teams to pinpoint issues in branch testing and code development swiftly. The result? A streamlined continuous integration and deployment process that redefines efficiency, quality, and performance in software development projects. So grab it now!
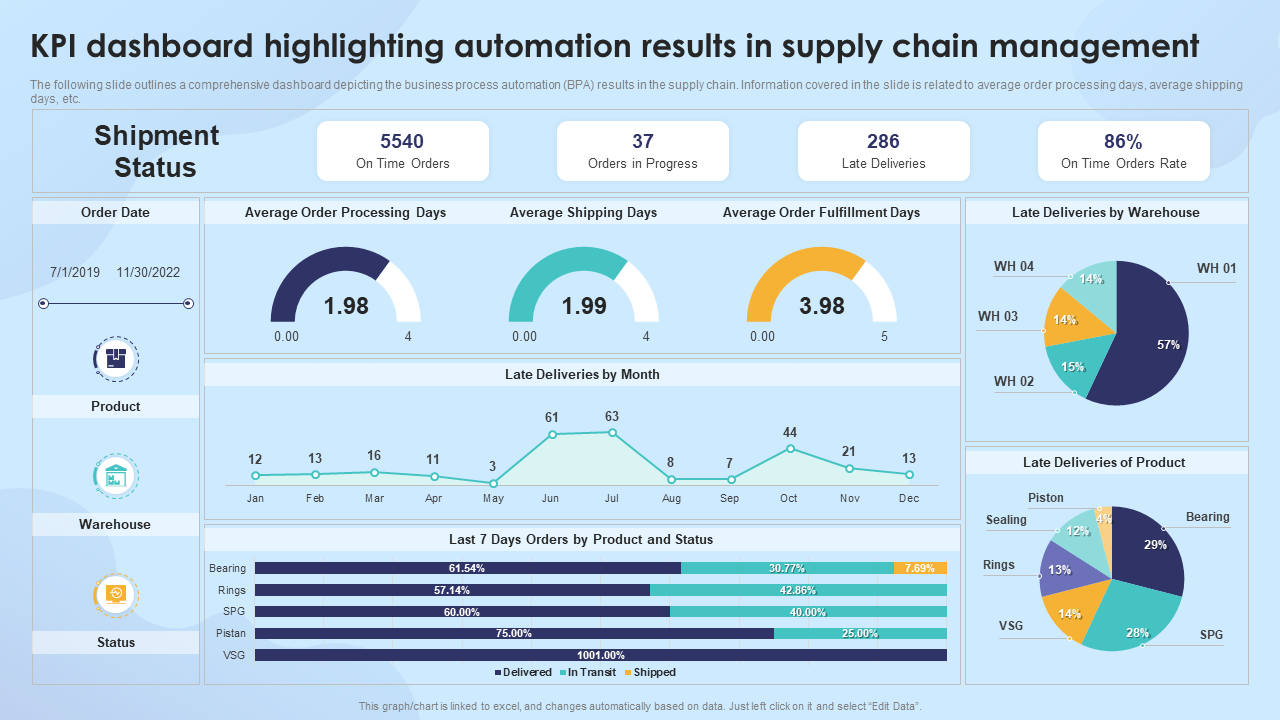
Template 3: KPI Dashboard Highlighting Automation Results
Supercharge your supply chain optimization journey with our dynamic KPI Dashboard PowerPoint template. It's not just about data; it's about insights that matter. Our template highlights critical automation results such as average order processing time, shipment status, and delivery efficiency. Visualize these KPIs, and you empower supply chain managers to assess automation's impact on operational efficiency and process enhancement. This template is more than just a presentation; it's your compass for strategic decision-making and stakeholder engagement in supply chain management. Get a hold of it now!
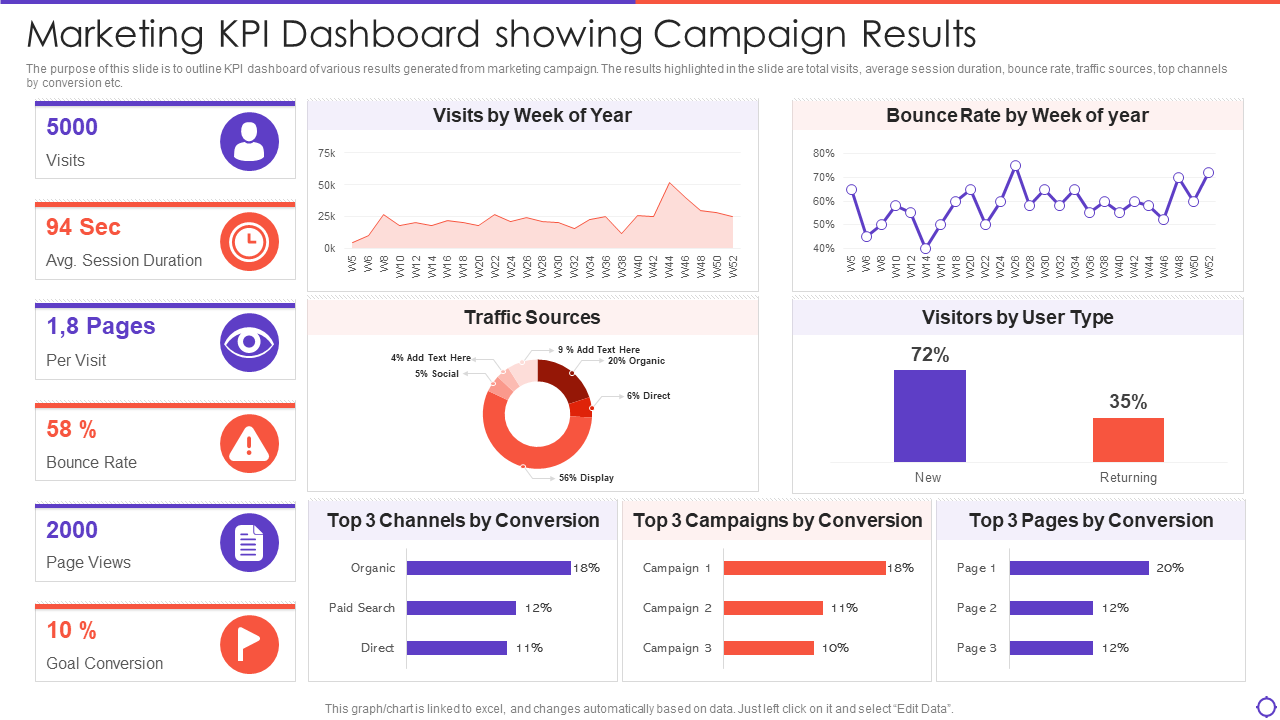
Template 4: Marketing KPI Dashboard Showcasing Campaign Results
Your marketing endeavors deserve more than just numbers; they deserve a stage. Our marketing KPI dashboard design acts as that stage that doesn't just display metrics but crafts a narrative. From traffic types to total spend, conversion rates, and bounce rates, it offers a panoramic view of your campaign's performance. Not only this you can also tailor the dashboard to focus on KPIs that align with your unique strategy. This makes it seamless to evaluate success and plot the course for future campaigns. Grab it now.
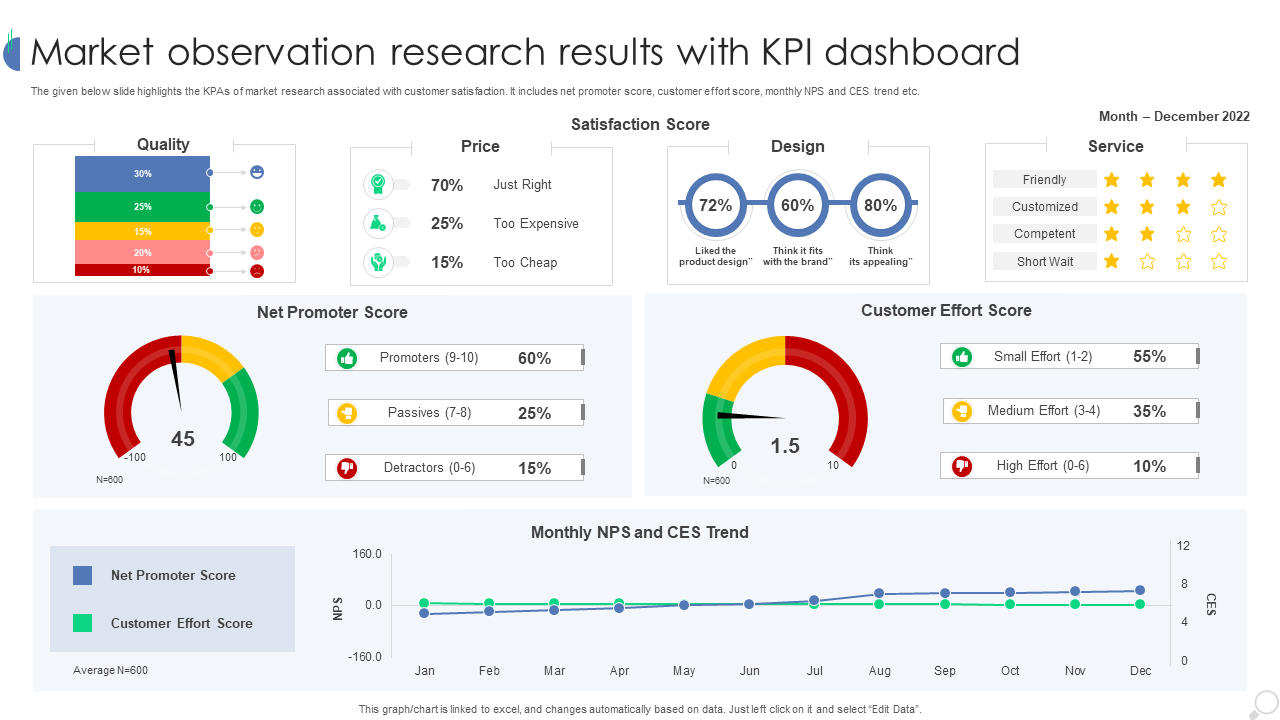
Template 5: Market Observation Research Results KPI Dashboard
In market research, insights are the currency of success. Our PowerPoint Template is your golden ticket to transform mundane data into a digestible format that spotlights key trends, consumer satisfaction scores, net promoter scores, and competitive analysis. But here's the game-changer: a KPI dashboard that simplifies comparing diverse market metrics, supercharging your strategic planning and decision-making. This template isn't just a tool; it's your compass for market analysts, business strategists, and marketing teams navigating the seas of market intelligence. Make it yours today.
Template 6: KPI Dashboard Highlighting Results of HR Management Training
For HR professionals, success isn't just a goal; it's a journey. This dashboard PowerPoint template turns that journey into a visual triumph. It doesn't just present training outcomes, but also training budget, employee engagement, and satisfaction scores; it crafts a compelling narrative. With its dashboard format, HR managers can track training program effectiveness, employee development, and overall HR strategies. Here's the magic: it's not just a presentation tool; it's your key to communicating results effectively and discovering opportunities for HR excellence. Download now from the link below.
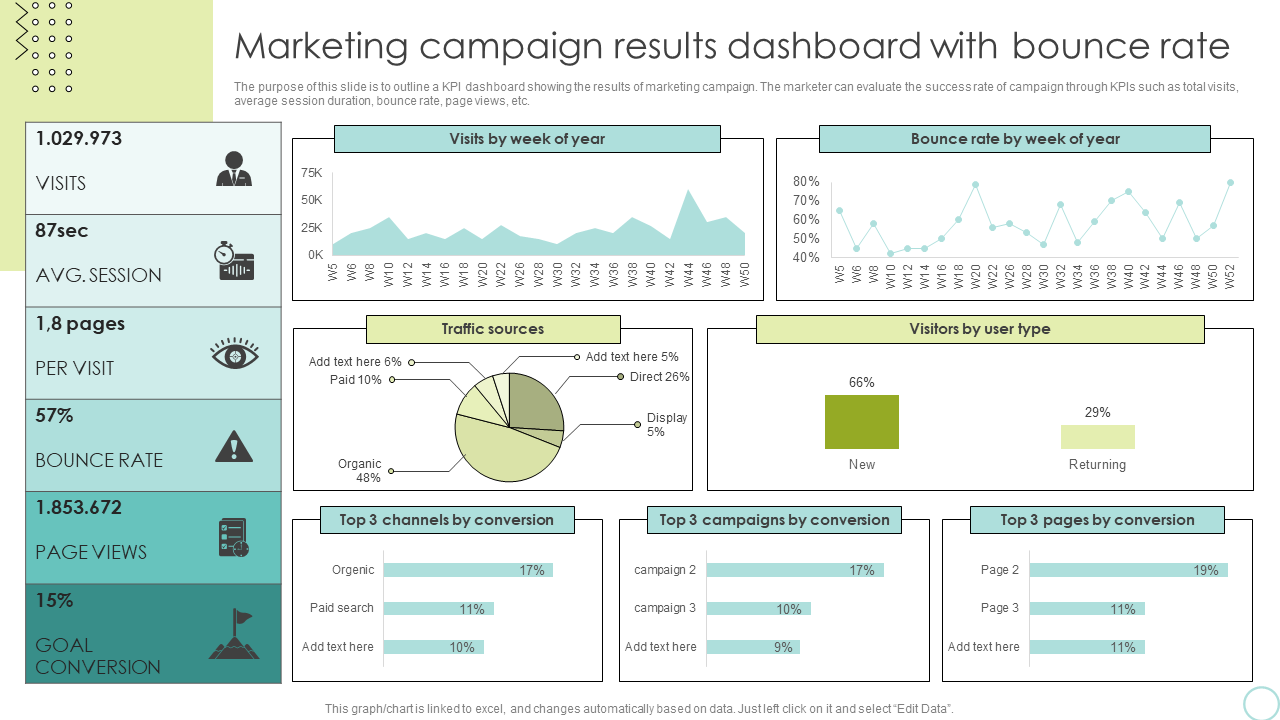
Template 7: Marketing Campaign Results Dashboard with Bounce Rate
Digital marketing isn't just about campaigns; it's about impact. This results dashboard PowerPoint template takes you through the heart of digital marketing success. From traffic types to bounce rates and total spend, it comprehensively analyses your digital campaigns. Customizable to your strategy, it simplifies the evaluation of different campaigns, revealing the true impact of marketing strategies on customer engagement and conversion. Therefore, grab it now to master your next campaign.
Template 8: KPI Dashboard Highlighting Results of SEO Campaign
In the ever-evolving SEO landscape, precision is power. This template isn't just a dashboard; it's your arsenal for SEO supremacy. It tracks essential metrics like organic traffic, keyword rankings, and backlink quality, transforming data into insights that drive action. Whether you're optimizing SEO tactics or enhancing search engine visibility, this template does it all. So, call it your compass for SEO and digital marketing shaping the future of online visibility.
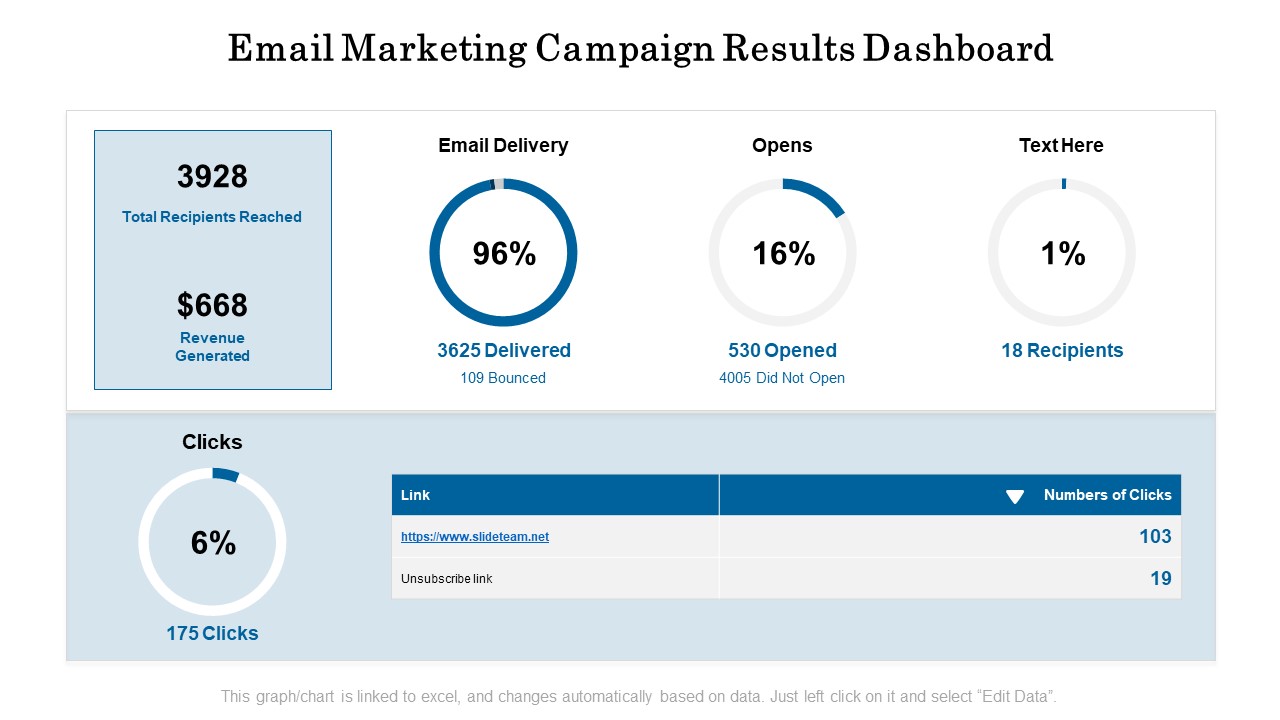
Template 9: Email Marketing Campaign Results Dashboard
In the world of email marketing, engagement is the king. And this PowerPoint template is your royal scepter that guides you toward the path of email marketing mastery. From open rates to click-through rates and subscriber growth, it offers a clear view of your email campaign performance. With insights at your fingertips, it's the perfect tool to optimize content and strategy for enhanced engagement and conversions. So take advantage of this dashboard design by grabbing it now!
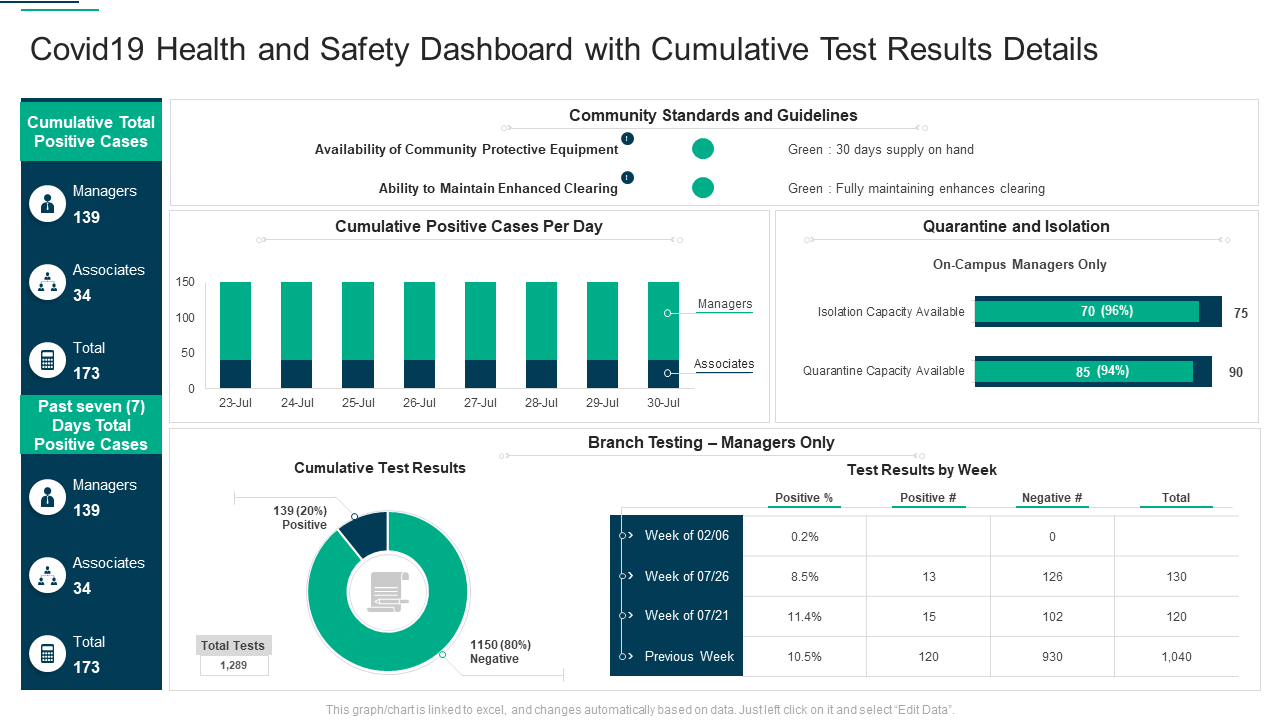
Template 10: COVID-19 Health and Safety Dashboard
This Template design doesn't just talk about numbers but shows you a real-time window into the vital information you need. This includes vaccine progress, test results, infection rates, etc. Healthcare leaders, public health officials, and organizations can use it to monitor and respond effectively to the pandemic. With this dashboard, you also easily spot trends, regional differences, and data for specific groups, to make informed decisions about public safety and health policies. It even predicts future outbreaks, helping you stay prepared for what's to come. So, pick this design in these challenging times to protect yourself and your community.
Template 11: Monthly Results Dashboard for Multiple Campaigns
The Monthly Results Dashboard is a key tool in marketing. It goes beyond just a PowerPoint template and becomes an essential portal for analyzing marketing efforts. It's designed for marketing managers and teams, making it easy to track, analyze, and compare multiple campaigns. You can look at important metrics like website traffic, lead generation, and customer engagement. The user-friendly interface and customizable data presentation, with interactive charts and graphs, offer clear insights for making strategic decisions. It helps predict trends, optimize resource allocation, and guide future marketing strategies by analyzing past and current campaign data. Download it now to leverage it!
Taking the Right Step at the Right Time
The samples and examples we've explored demonstrate how effectively organized data can narrate the story of your business, project, or research in a compelling and easily digestible way. Whatever your role, data analyst in a large company, a small business owner, or an independent researcher, there's a template out there to make your raw data actionable.
So choose wisely, customize creatively, and watch as your data opens doors to new understandings and opportunities.
P.S. Need a presentation template to track your results and make data-driven decisions? This blog has you covered! Explore various templates for tracking survey results, marketing campaign results, and more!


 Customer Reviews


