Machines might never be as imaginative as people and we might never be able to handle as much information as computers. Here is where Augmented Analytics Templates will be quite useful. It helps people take raw data to actionable insights by harmoniously and combining human creativity and computer intelligence. However, how does one find these PowerPoint Presentations?
However, when it comes to data analytics, finding the right template is like striking gold in a sea of raw information. No need to worry however; we have combed the website and found the five Best Augmented Analytics Templates that are sure to unlock the full potential of your data.
But wait, there's more where that came from! Think of the possibilities if you could access these stunning designs from SlideTeam, the Picasso of PowerPoint templates. And you can! SlideTeam's creative and meticulously designed templates breathe new life into your data. Is an extraordinary adventure something you're up for? Let's explore the world of augmented analytics templates, where ordinary data may provide remarkable insights. Here we go!
Template 1: Augmented Analytics IT PowerPoint Presentation Slides
As author Mark Twain stated, "The secret of getting ahead is getting started." And that is precisely the purpose of this template.
In today's data-driven society, it's more important than ever for companies to use advanced and trendy data analytics. And in this template, everything is ready, from business challenges encountered to the implementation strategy and the post-implementation environment. You'll see its transformational potential clearly as you learn about its mutually beneficial relationships with machine learning, automation, and business intelligence.
The template exceeds expectations by covering such additional ground as implementation tactics, training needs, and financial constraints. You will get a roadmap, a data visualization dashboard, and a 30-60-90-day strategy to assist you in confidently making your way through the augmented analytics process. Take heart; the hardest part is just getting started. So, download to start now.
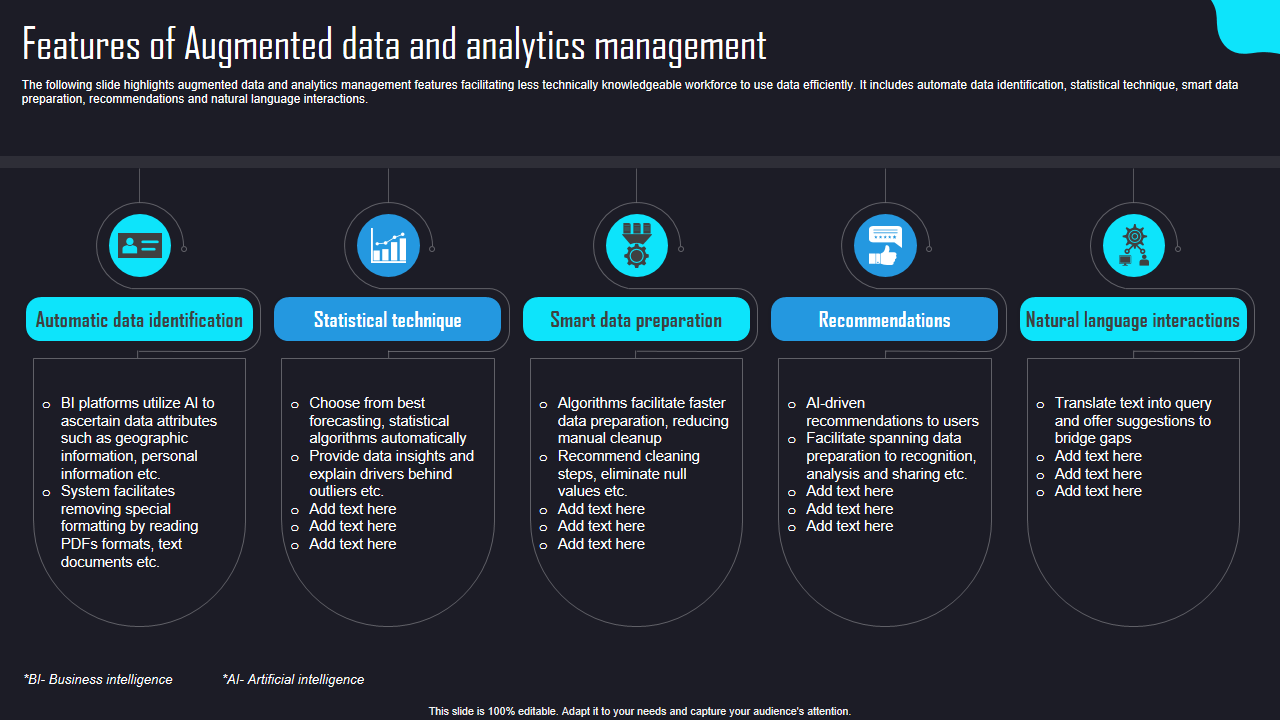
Template 2: Features of Augmented Data and Analytics Management
Within this PPT Template, you get everything right from data identification to automation. It acts as a compass when in a huge data environment. Further, statistical methods are used to reveal previously hidden patterns and tendencies. The template bridges the gap between people and computers with our enhanced data and analytics management, which include both suggestions and natural language interactions.
The premium deck of slides is packed to the gills with information on the benefits of using augmented data and analytics management. Information identification, democratized Bi, statistical methods, and planning are just a few areas this template covers. Let's set out on an adventure by downloading it.
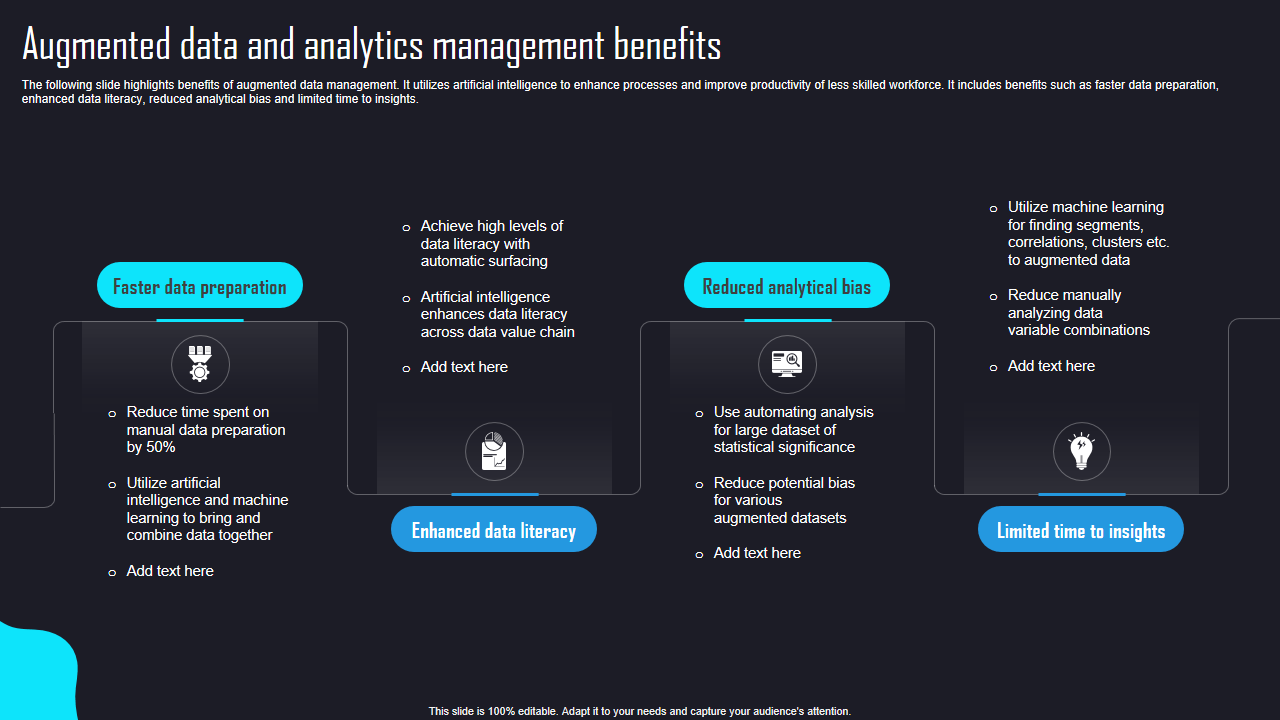
Template 3: Augmented Data and Analytics Management Benefits
The capacity to efficiently handle and analyze data is crucial in today's information-driven environment. And this carefully crafted series of slides highlight the advantages of augmented data and analytics management. Planning, analysis, literacy, and more are needed to get ahead.
This template simplifies the process, so you can focus where your attention is needed: on drawing useful conclusions. Additionally, this template improves data literacy and data visualization across the organization, allowing more people to make data-driven choices.
However, these aren't the only advantages. To further guarantee that choices are based on objective data interpretations, it also tackles the problem of analytical bias. Get the most out of your data and dominate the market with this template.
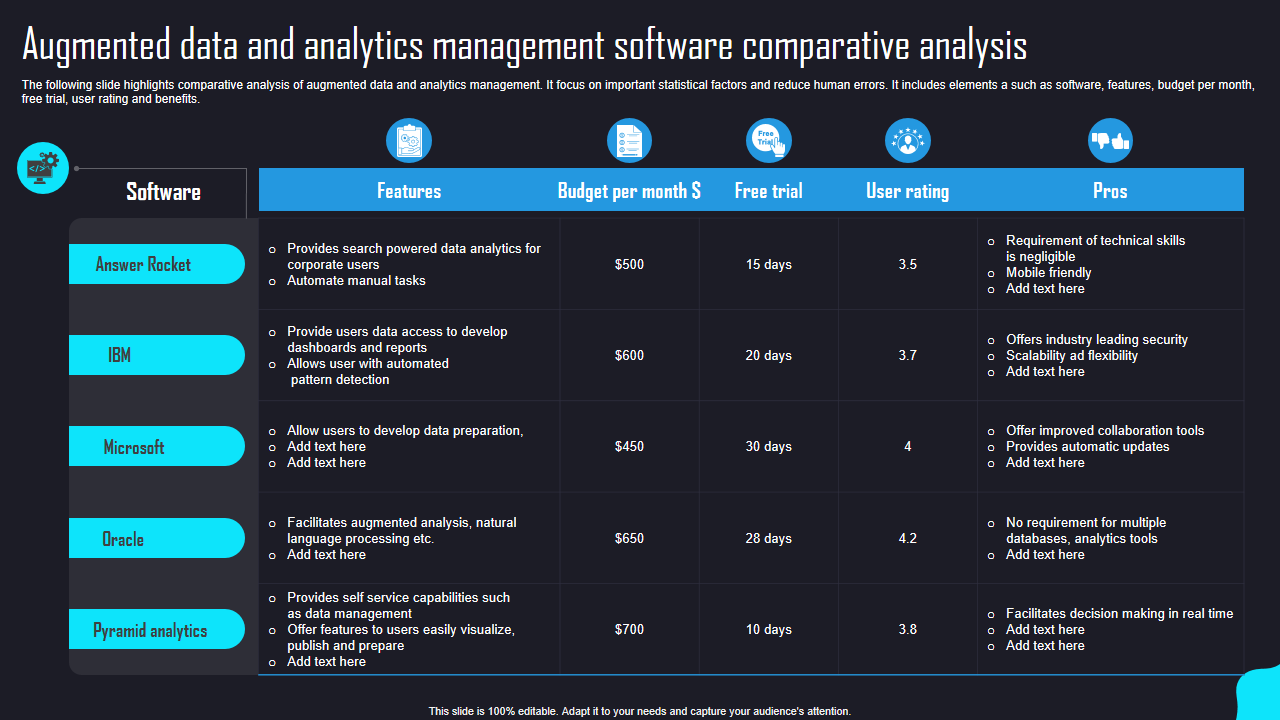
Template 4: Augmented Data and Analytics Management Software Comparative Analysis
Are you prepared to dive into analytics management software that uses augmented data? You need to look out for these comparative analysis slides and templates, whether you are a firm, individual data scientist, etc.
It focuses on crucial statistical considerations for reliability and error prevention. It has every facet of the available software, including its features, the monthly price, the availability of a free trial, the ratings it has received from users, and the wonderful advantages it may provide.
You can easily discuss topics like features, Microsoft, and Pyramid Analytics. This PowerPoint presentation is your ticket to persuading your audience and making a well-informed choice. Download this PPT Slide, unleash data's potential, and pave the route for data-driven greatness in your company.
Template 5: Essential Elements of Augmented Data Management and Analytics
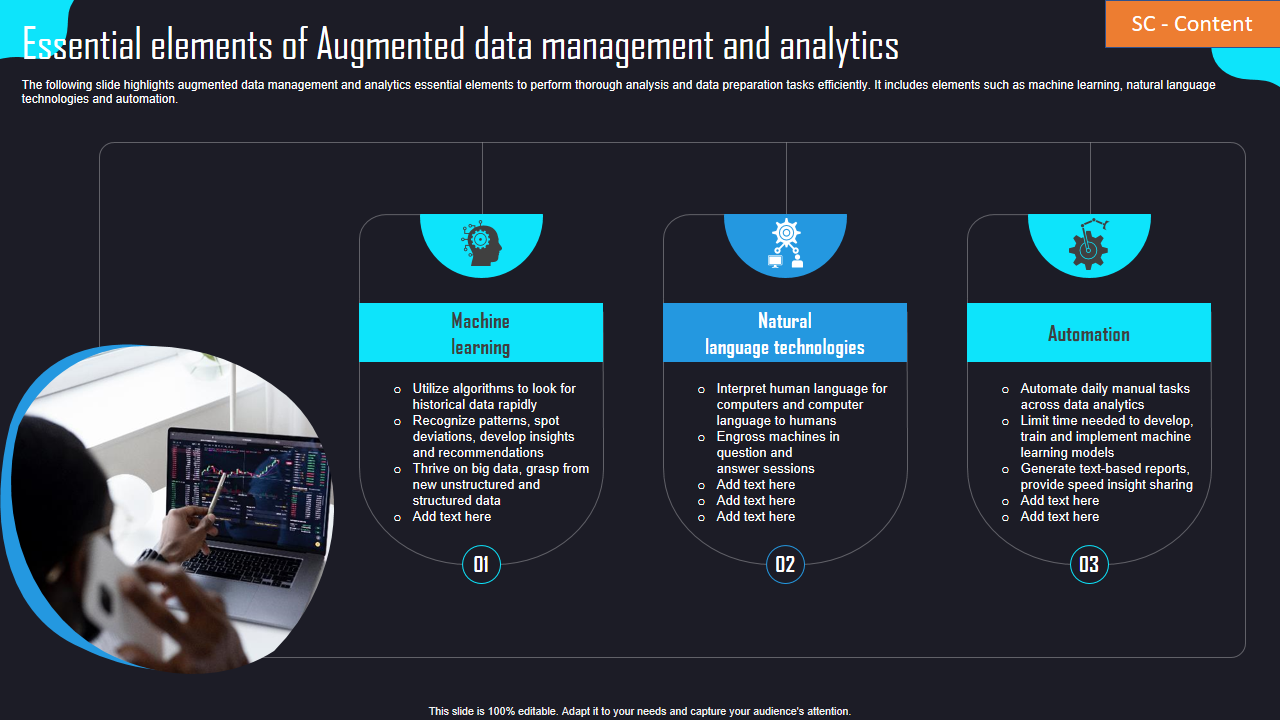
You have entered the realm of enhanced data management and analytics, where you need to start with effective analysis and comprehensive data preparation. And this template will help you as a business in realizing the full potential of your data.
You will learn about machine learning, where computers may learn and adapt to unearth previously unseen patterns and insights. Secondly, natural language technology to level the playing field between people and robots, and facilitate more natural and straightforward interactions with data. And the usefulness of automation in eliminating mundane duties and providing more time for in-depth research. This template revolutionizes your data management and analytics strategy with no effort on your part.
Get our slides and start your journey into automation, natural language processing, and machine learning.
An exciting adventure awaits you!
When the power of SlideTeam templates combines with augmented analytics, you can change how you think about analytics and realize the full potential of your data. These templates are like a lighthouse leading you through the maze of complex data and digital transformation, since they are carefully crafted to turn raw data into relevant tales.
Still, there's more to come! These templates combine state-of-the-art technology with straightforward interfaces to improve your analytical data accuracy skills while saving time. Get ready to be mesmerized as the magic of their inventions captures the essence of your data and turns it into a compelling visual narrative.
FAQs on Augmented Analytics
Why augmented analytics?
Because of its many advantages, augmented analytics rapidly becomes the standard in data analysis. Here is why:
- More Accurate Insights into Your Data: It uses cutting-edge algorithms and machine learning to unearth previously unseen patterns and trends in your data.
- Enhanced efficiency: Automated data preparation is one-way augmented analytics boosts productivity by freeing up analysts.
- Data democratization: It enables people of varied technical abilities to access and analyze data efficiently, removing roadblocks and spreading data literacy across the business.
- Reduced Bias: Augmented analytics reduces the potential for human bias by using data-driven algorithms to make decisions.
- Predictive Modelling and Forecasting: These features of augmented analytics help companies look ahead and make well-informed choices.
Where is augmented analytics used?
Some typical applications of augmented analytics are listed below:
- Business Intelligence: With the help of augmented analytics, firms may acquire a more in-depth understanding of their operations, consumer behavior, and market trends.
- Marketing and sales: Marketers and salespeople may use augmented analytics to understand their clientele, spot trends better, and tailor their strategies to each individual.
- Healthcare: Augmented analytics helps analyze patient data, spot illness trends, forecast results, and fine-tune treatment strategies in the healthcare sector.
- Banking and Finance: The banking and finance industries employ augmented analytics for fraud detection, risk evaluation, and predictive modelling tasks.
- Logistics & Supply Chain: Big data analysis of inventory, demand, and logistics processes is made more efficient using augmented analytics.
What is the difference between predictive analytics and augmented analytics?
Predictive and enhanced analytics are potent tools in the data analysis toolbox, but they vary significantly in methodology and scope.
Predictive analytics aims to foresee potential events using past data and statistical modelling. The process entails looking for regularities in data, using them to construct models, and then using those predictions to guide future actions. On the other hand, augmented analytics improves upon traditional data analysis by using the strengths of machine learning, NLP, and automation.
Although predictive analytics is under the umbrella of augmented analytics, the latter is distinguished from its subset by its focus on the big picture. Not only can it forecast outcomes, but it also equips users with automatic data preparation, enhanced insights, and intelligent suggestions.
How is machine learning related to data analytics?
Data analytics and machine learning go hand in hand, with machine learning functioning as a highly effective subfield of data analytics. Machine learning is a branch of artificial intelligence that uses algorithms and statistical models to help computers learn and improve autonomously from data. It's a branch of AI that analyses data for repeating patterns so that it may conclude.
On the other hand, data analytics is a broad term for a collection of methods used to analyze data to draw conclusions and act upon them. Because of its ability to automate data analysis, pattern recognition, and predictive modelling, machine learning plays a crucial role in data analytics. It aids in the detection of outliers, the identification of trends and patterns in huge datasets, and the development of reliable forecasts based on experience.




 Customer Reviews

