Data Driven Miscellaneous Measuring Graphics diagrams slides and templates
- Sub Categories
-
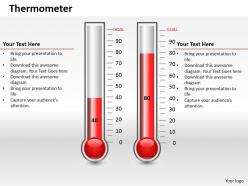 0414 column chart in thermometer style powerpoint graph
PowerPoint infographic fully adaptable with Google slides. Adaptable to wide screen view without the problem of pixilation. Modifiable color, text and font as per the trade requirement. Easy to download and can be turned into JPG and PDF format. Accessibility of addition of logo and trademarks for personalization. Awesome use of colors and innovatively designed. Corresponding designs accessible with different nodes and stages.
-
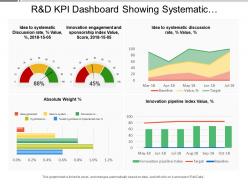 R and d kpi dashboard showing systematic discussion rate innovation engagement and sponsorship index
Presenting this set of slides with name - R And D Kpi Dashboard Showing Systematic Discussion Rate Innovation Engagement And Sponsorship Index. This is a four stage process. The stages in this process are R And D, Research And Development, Research And Technological Development.
-
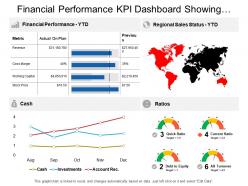 Financial performance kpi dashboard showing regional sales status cash and ratios
Presenting this set of slides with name - Financial Performance Kpi Dashboard Showing Regional Sales Status Cash And Ratios. This is a four stage process. The stages in this process are Financial Performance, Financial Report, Financial Review.
-
 1214 battery icon with power icons energy technology powerpoint slide
We are proud to present our 1214 battery icon with power icons energy technology powerpoint slide. Graphic of battery icons are used to craft this power point template. This PPT slide contains the concept of energy technology. Use this PPT slide and build an innovative presentation for your viewers.
-
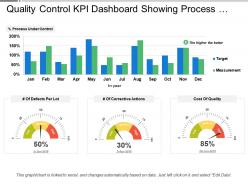 Quality control kpi dashboard showing process under control and cost of quality
Presenting this set of slides with name - Quality Control Kpi Dashboard Showing Process Under Control And Cost Of Quality. This is a four stage process. The stages in this process are Quality Management, Quality Control, Quality Assurance.
-
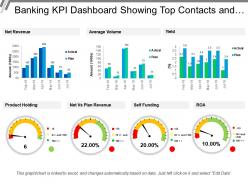 Banking kpi dashboard showing top contacts and client value
Presenting this set of slides with name - Banking Kpi Dashboard Showing Top Contacts And Client Value. This is a three stage process. The stages in this process are Banking, Finance, Money.
-
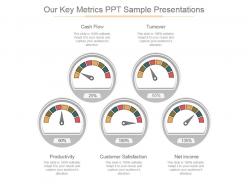 Our key metrics ppt sample presentations
Presenting our key metrics ppt sample presentations. This is a our key metrics ppt sample presentations. This is a five stage process. The stages in this process are cash flow, turnover, net income, customer satisfaction, productivity.
-
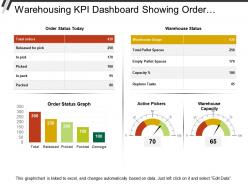 Warehousing kpi dashboard showing order status and active pickers
The design template is compatible with Google Slides and MS PowerPoint software. You can download this design into various formats such as JPEG or PDF format. The warehouse KPI dashboard PPT design template is 100% editable; you can modify and personalize the design according to your business requirements. Design is fully supported on standard and full screen view; no change in design quality on full screen view.
-
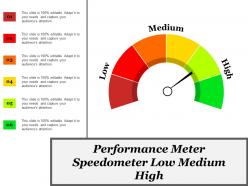 Performance meter speedometer low medium high
Presenting, the performance meter speedometer PowerPoint Presentation Slide. This Presentation has been designed professionally and is fully editable. You can personalize font size, font type, colors, and even the background. This Template is obedient with Google Slide and can be saved in JPG or PDF format without any hassle. Fast download at the click of the button.
-
 Financial ratio kpi dashboard showing liquidity ratio analysis current ratio and quick ratio
Presenting this set of slides with name - Financial Ratio Kpi Dashboard Showing Liquidity Ratio Analysis Current Ratio And Quick Ratio. This is a three stage process. The stages in this process are Accounting Ratio, Financial Statement, Financial Ratio.
-
 Metrics icon powerpoint ideas
Presenting Metrics Icon PowerPoint Ideas which is completely editable. Can be changed into formats like PDF, JPG, and PNG. The slide is readily available in both 4:3 and 16:9 aspect ratio. The template is compatible with Google Slides, which makes it accessible at once. Modify the colors, fonts, font size, and font types of the template as per the requirements.
-
 Fuel gauge three colored speedometer
Presenting this set of slides with name - Fuel Gauge Three Colored Speedometer. This is a three stage process. The stages in this process are Fuel Gauge, Gas Gauge, Fuel Containers.
-
 0414 percentage increase champagne bottle column chart powerpoint graph
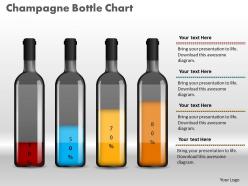
Proofing and editing can be done with ease in PPT design. Smooth functioning is ensured by the presentation slide show on all software’s. Color, style and position can be standardized, supports font size which can be read from a distance. When projected on the wide screen the PPT layout does not sacrifice on pixels or color resolution.
-
 Financial performance kpi dashboard showing revenue quick ratio short term assets
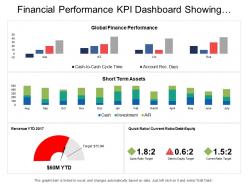
Presenting this set of slides with name - Financial Performance Kpi Dashboard Showing Revenue Quick Ratio Short Term Assets. This is a four stage process. The stages in this process are Financial Performance, Financial Report, Financial Review.
-
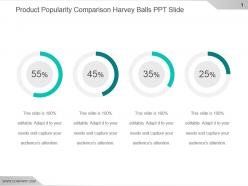 Product popularity comparison harvey balls ppt slide
Presenting product popularity comparison harvey balls ppt slide. This is a product popularity comparison harvey balls ppt slide. This is a four stage process. The stages in this process are business, percentage, finance, marketing, strategy, success.
-
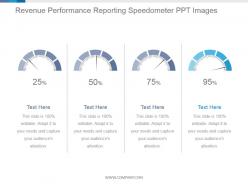 Revenue performance reporting speedometer ppt images
Presenting revenue performance reporting speedometer ppt images. This is a revenue performance reporting speedometer ppt images. This is a four stage process. The stages in this process are dashboard, measure, percentage, business, marketing.
-
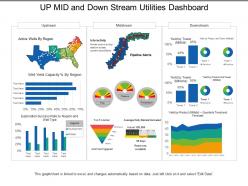 Up mid and down stream utilities dashboard
Presenting this set of slides with name - Up Mid And Down Stream Utilities Dashboard. This is a three stage process. The stages in this process are Utilities, Use, Advantage.
-
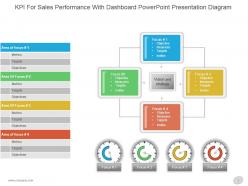 Kpi for sales performance with dashboard powerpoint presentation diagram
Presenting kpi for sales performance with dashboard powerpoint presentation diagram. This is a kpi for sales performance with dashboard powerpoint presentation diagram. This is a four stage process. The stages in this process are area of focus, metrics, objectives, focus, objective, measures, targets, invites, vision and strategy.
-
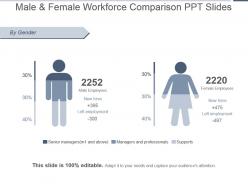 Male and female workforce comparison ppt slides
Presenting male and female workforce comparison ppt slides. This is a male and female workforce comparison ppt slides. This is a two stage process. The stages in this process are by gender, male employees, new hires, left employment, female employees, senior managers m1 and above, managers and professionals, supports.
-
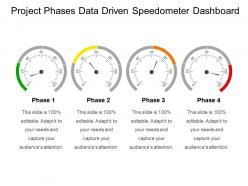 Project phases data driven speedometer dashboard snapshot
Presenting project phases data driven speedometer dashboard. This is a project phases data driven speedometer dashboard snapshot. This is a four stage process. The stages in this process are project phases templates, project steps, project methods.
-
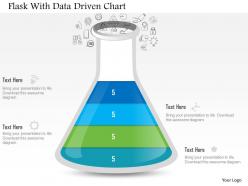 1214 flask with data driven chart powerpoint slide
We are proud to present our 1214 flask with data driven chart powerpoint slide. This power point template slide has been designed with graphic of flask and data driven chart. This PPT slide contains the concept of data analysis for different measurement. Use this PPT and build quality presentation for your viewers.
-
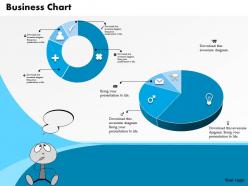 0514 business analysis growth data driven chart powerpoint slides
Businessmen, micro, small and medium enterprises can use the PPT visual as a master slide. PowerPoint presentation supports filling background in a different color from the text. All images are 100% editable in the presentation slide. Text can be differentiated form the background by the handy features provided by PPT layout. There is no space constrain in the PowerPoint design, thus enabling easy addition or edition of data. Offers high resolution is offered by PPT slide show.
-
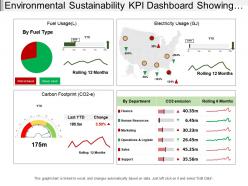 Environmental sustainability kpi dashboard showing carbon footprint and electricity usage
Presenting the environmental sustainability KPI dashboard PowerPoint slide. This presentation slide is fully editable in PowerPoint. It is customizable according to your requirement. The font color, style, size, diagram color and background color of slide can be changed as per your requirement. You can conveniently replace the sample content in text placeholders with your presentation content. This template is suitable for use with Google Slides. It can be saved in JPG or PDF formats. It is available in both standard size and wide screen size. Download it quickly at the click of a button.
-
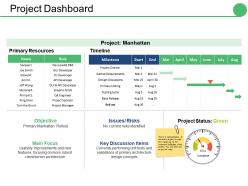 Project dashboard ppt gallery slides
Presenting this set of slides with name - Project Dashboard Ppt Gallery Slides. This is a two stage process. The stages in this process are Milestone, Project, Objective, Main Focus, Key Discussion Items.
-
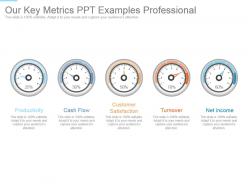 Our key metrics ppt examples professional
Presenting our key metrics ppt examples professional. This is a our key metrics ppt examples professional. This is a five stage process. The stages in this process are productivity, cash flow, customer satisfaction, turnover, net income.
-
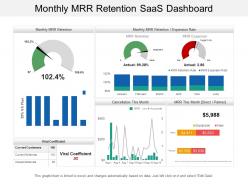 Monthly mrr retention saas dashboard
Offering monthly MRR retention Saas dashboard PPT template. Access to convert the presentation design into JPG and PDF. Offer 100% access to change the values, size and style of the slides once downloaded and saved in the desired format. High quality charts, images and visuals used in the designing process. Choice to get presentation slide in standard or in widescreen view. Easy to convert in JPEG and PDF document. Compatible with Google slides. Easy and hassle free downloading process.
-
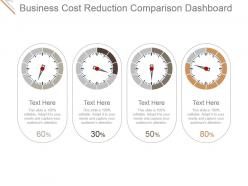 Business cost reduction comparison dashboard snapshot ppt ideas
Presenting business cost reduction comparison dashboard ppt ideas. This is a business cost reduction comparison dashboard snapshot ppt ideas. This is a four stage process. The stages in this process are business, meter, measure, reduction, cost.
-
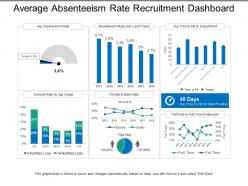 Average absenteeism rate recruitment dashboard
Presenting this set of slides with name - Average Absenteeism Rate Recruitment Dashboard. This is a six stage process. The stages in this process are Staffing Plan, Recruitment, Staff Management.
-
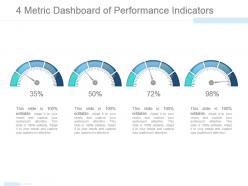 4 metric dashboard of performance indicators example of ppt
Presenting 4 metric dashboard of performance indicators example of ppt. This is a 4 metric dashboard of performance indicators example of ppt. This is a four stage process. The stages in this process are dashboard, finance, percentage, business, marketing.
-
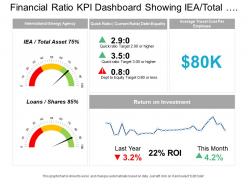 Financial ratio kpi dashboard showing iea total assets and return on investment
Presenting this set of slides with name - Financial Ratio Kpi Dashboard Showing Iea Total Assets And Return On Investment. This is a three stage process. The stages in this process are Accounting Ratio, Financial Statement, Financial Ratio.
-
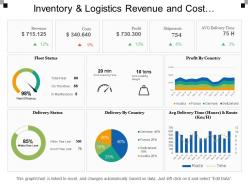 Inventory and logistics revenue and cost dashboards
Presenting this set of slides with name - Inventory And Logistics Revenue And Cost Dashboards. This is a three stage process. The stages in this process are Inventory And Logistics, Inventory Management, Warehousing And Inventory Management.
-
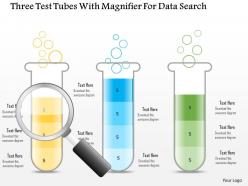 1214 three test tubes with magnifier for data search powerpoint slide
We are proud to present our 1214 three test tubes with magnifier for data search powerpoint slide. Three test tubes and magnifier are used to craft this power point template slide. This PPT slide contains the concept of data search. This PPT slide can be used for data related presentation.
-
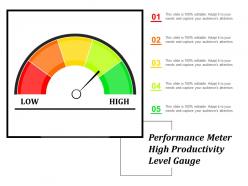 Performance meter high productivity level gauge
Presenting, the performance meter PowerPoint Presentation Slide. This Presentation has been designed professionally and is fully editable. You can customize the font size, font type, colors, and even the background. This Template is obedient with Google Slide and can be saved in JPG or PDF format without any hassle. Fast download at the click of the button.
-
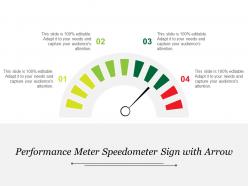 Performance meter speedometer sign with arrow
This highly versatile, innovative design is completely editable; you can modify the design the way you want. Slides are fully compatible with Google Slides and MS PowerPoint software. Instant and quick downloading available; you can save the design into your system into various formats such as JPEG or PDF. Both standard and wide screen view are available; no effect on design quality when opened on wide screen view.
-
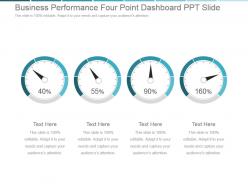 Business performance four point dashboard snapshot ppt slide
Presenting business performance four point dashboard snapshot ppt slide. This is a business performance four point dashboard ppt slide. This is a four stage process. The stages in this process are business, success, dashboard, finance, strategy.
-
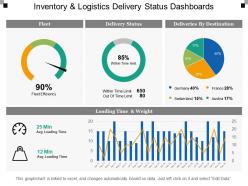 Inventory and logistics delivery status dashboards
Presenting this set of slides with name - Inventory And Logistics Delivery Status Dashboards. This is a four stage process. The stages in this process are Inventory And Logistics, Inventory Management, Warehousing And Inventory Management.
-
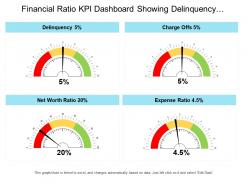 Financial ratio kpi dashboard snapshot showing delinquency charge offs and net worth ratio
Presenting this set of slides with name - Financial Ratio Kpi Dashboard Snapshot Showing Delinquency Charge Offs And Net Worth Ratio. This is a four stage process. The stages in this process are Accounting Ratio, Financial Statement, Financial Ratio.
-
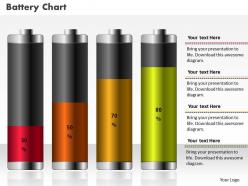 0414 percentage increase in battery column chart powerpoint graph
Useful for professionals working in corporates and college going students studying finance. Easily convertible into JPEG and PDF. High resolution graphics will not pixilate on bigger or wider screen. Customisable PPT layout in terms of orientation, design, color and text. Add titles and sub-titles as it has ample space. Compatible with Google slides and runs with all softwares. Company’s name, logo and trademark can be added conveniently. Easy to download due to small size.
-
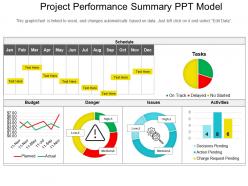 Project performance summary ppt model
Presenting a PPT template named Project performance Summary PPT Model. It is a professionally designed template with relevant visuals and subject driven content. Get easy access to the customizable slide which is linked with the Excel sheet. You can edit the colour, text and font size as per your need. You can add or delete the content if required. The slide is compatible with Google Slides and can be exported in both PDF as well as JPG formats. You can avail this PPT slide both in standard as well as widescreen size.
-
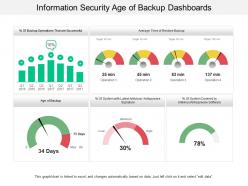 Information security age of backup dashboards
Presenting this set of slides with name - Information Security Age Of Backup Dashboards. This is a five stage process. The stages in this process are Information Security Strategy, Information Security Plan, Information Protection Strategy.
-
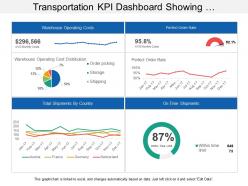 Transportation kpi dashboard showing warehouse operating costs perfect order rate
Presenting transportation KPI dashboard showing warehouse operating costs perfect order rate PPT slide. This layout is fully compatible with Google slides and data driven. User can edit the data in linked excel sheet and graphs and charts gets customized accordingly. Easy to put in company logo, trademark or name; accommodate words to support the key points. Images do no distort out even when they are projected on large screen. Adjust colors, text and fonts as per your business requirements.
-
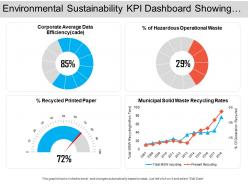 Environmental sustainability kpi dashboard showing corporate average data efficiency
Presenting this set of slides with name - Environmental Sustainability Kpi Dashboard Showing Corporate Average Data Efficiency. This is a four stage process. The stages in this process are Environment Sustainability, Environment Continual, Environment Feasibility.
-
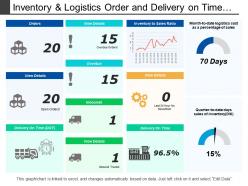 Inventory and logistics order and delivery on time dashboards
Presenting this set of slides with name - Inventory And Logistics Order And Delivery On Time Dashboards. This is a four stage process. The stages in this process are Inventory And Logistics, Inventory Management, Warehousing And Inventory Management.
-
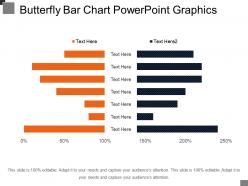 Butterfly bar chart powerpoint graphics
Presenting a PPT template named Butterfly Bar Chart PowerPoint Graphics. Get easy access to our professionally designed customizable template. You can change the color, text and font size as per your need. You can add or delete the content wherever required. This PPT slide is data driven and is linked to an Excel sheet. Its compatibility with Google Slides makes it easily available. Convert and save this PPT slide in PDF, JPEG or JPG formats. Download to prepare an impressive PowerPoint presentation in less time.
-
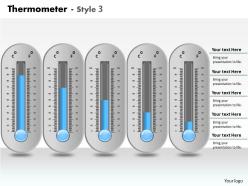 0414 thermometer data driven column chart powerpoint graph
We are proud to present our 0414 thermometer data driven column chart powerpoint graph. Channelise the thoughts of your team with our Thermometer Data Driven Column Chart Powerpoint Graph Powerpoint Templates. Urge them to focus on the goals you have set. Give impetus to the hopes of your colleagues. Our Thermometer Data Driven Column Chart Powerpoint Graph Powerpoint Templates will aid you in winning their trust.
-
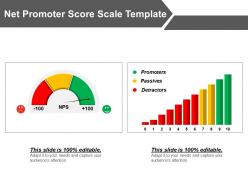 Net promoter score scale template powerpoint graphics
Presenting net promoter score scale PPT template. This Presentation graphic is eloquent and beneficial for the students, researchers, specialists from various fields. The composition features of this PowerPoint image allow you to modify the appearance and layout. This PPT design has enough scope to insert the title or subtitles respectively. The impeccable Presentation design is well acquainted with all Google Slides. They also provide an option to add your business logo too.
-
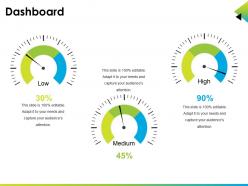 Dashboard Snapshot ppt infographic template
Presenting dashboard ppt infographic template. This is a dashboard snapshot ppt infographic template. This is a three stage process. The stages in this process are dashboard, low, high, medium.
-
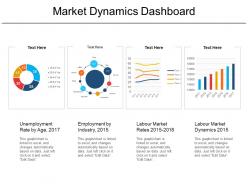 Market dynamics dashboard
Introducing the Market Dynamics Dashboard PowerPoint slide which is easily editable and can be downloaded in various formats like PNG, JPG and PDF. Compatible with Google Slides, it is easily accessible at one click. PPT template is available in both 4:3 and 16:9 aspect ratios. As per your requirements, modify font type, size and color. Used by business and market analysts.
-
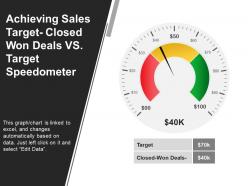 Achieving sales target closed won deals vs target speedometer ppt design
This sales target achievement presentation PPT template can be downloaded and converted into JPEG and PDF formats. You can change font type, size, color, shape, style, background according to your business preferences. Design allows full editing. PPT is fully compatible with Google Slides and MS PowerPoint software. Both normal and full screen design views are available. No change in the design quality even when viewed in full screen.
-
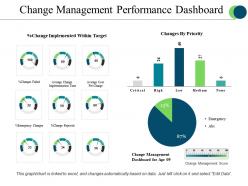 Change management performance dashboard powerpoint slide designs
Presenting change management performance dashboard powerpoint slide designs. This is a change management performance dashboard powerpoint slide designs. This is a three stage process. The stages in this process are critical, high, low, medium, none.
-
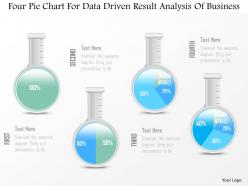 1214 four pie chart for data driven result analysis of business powerpoint slide
We are proud to present our 1214 four pie chart for data driven result analysis of business powerpoint slide. This Power Point template has been crafted with graphic of four pie charts. This PPT slide contains the concept of data driven result analysis. Use this PPT slide for your business and marketing related presentations.
-
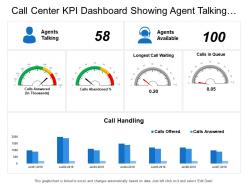 Call center kpi dashboard showing agent talking longest call waiting call handling
Presenting this set of slides with name - Call Center Kpi Dashboard Showing Agent Talking Longest Call Waiting Call Handling. This is a five stage process. The stages in this process are Call Center Agent, Customer Care, Client Support.
-
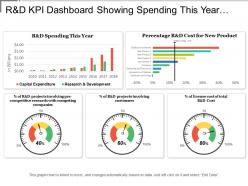 R and d kpi dashboard showing spending this year and cost for new product
Presenting this set of slides with name - R And D Kpi Dashboard Showing Spending This Year And Cost For New Product. This is a five stage process. The stages in this process are R And D, Research And Development, Research And Technological Development.
-
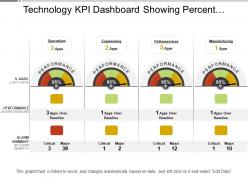 Technology kpi dashboard showing percent availability and performance
Displaying Technology KPI dashboard percent availability PowerPoint design. Colors and text can be easily changed as the PPT slide is completely editable. Modify the design with brand name and logo. Presentation diagram is available both Standard and Widescreen slide. Fast and easy download with saving options. Adaptable with other software’s such as PDF or JPG formats. PowerPoint graphic is fully compatible with Google slides as can be merged with them accordingly.
-
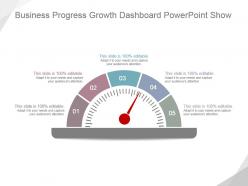 Business progress growth dashboard powerpoint show
Presenting business progress growth dashboard powerpoint show. This is a business progress growth dashboard powerpoint show. This is a five stage process. The stages in this process are business, marketing, dashboard, measure, management.
-
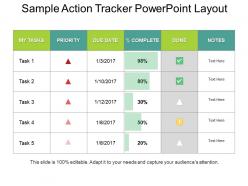 Sample action tracker powerpoint layout
Presenting a PPT template named Sample Action Tracker PowerPoint Layout. You can completely edit this slide as per your requirements. The font color, font size, font style, background color, and the color of the diagram are all editable and can be changed. The dummy text in the slide can be rewritten. A collection of editable and high-quality icons ensure better design for your presentation. Choose from an array of these icons to enhance your presentation. The slide is compatible with Google Slides and can be saved in both JPG and PDF formats.
-
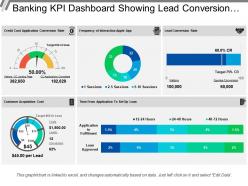 Banking kpi dashboard showing lead conversion and acquisition cost
Presenting this set of slides with name - Banking Kpi Dashboard Showing Lead Conversion And Acquisition Cost. This is a five stage process. The stages in this process are Banking, Finance, Money.
-
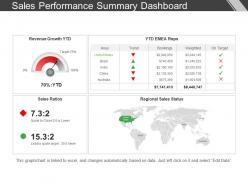 Sales performance summary dashboard snapshot presentation outline
Presenting sales performance summary dashboard snapshot presentation outline PPT slide. High-resolution slide design visuals. No fear of image pixelation when projected on a wide screen. It has compatibility with numerous software options available both online and offline. It is compatible with numerous format options. Ease of customization and personalization. Ease of editing in color and orientation of the slide visual. There is freedom to add the company logo, name and trademark as part of personalization. Thoroughly used by business professionals, students and teachers as part of their presentation.
-
 Warehousing kpi dashboard showing stock value and dispatched items
This storage KPI dashboard PPT design is completely editable; you can modify and personalize the design as per your business needs; include business logo and trademark to look PPT more authentic, put your business warehousing figures in excel and linked charts in design will get updated automatically. You can download the design into JPEG or PDF formats; easy and swift downloading available. Design is compatible with Google Slides and MS PowerPoint software.
-
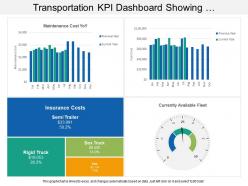 Transportation kpi dashboard showing maintenance cost insurance cost available fleet
Presenting transportation KPI dashboard showing maintenance cost insurance cost available fleet PowerPoint slide. Simple data input with linked Excel chart, just right click to input values. This PowerPoint theme is fully supported by Google slides. Picture quality of these slides does not change even when project on large screen. Fast downloading speed and formats can be easily changed to JPEG and PDF applications. This template is suitable for marketing, sales persons, business managers and entrepreneurs. Adjust PPT layout, font, text and color as per your necessity.


