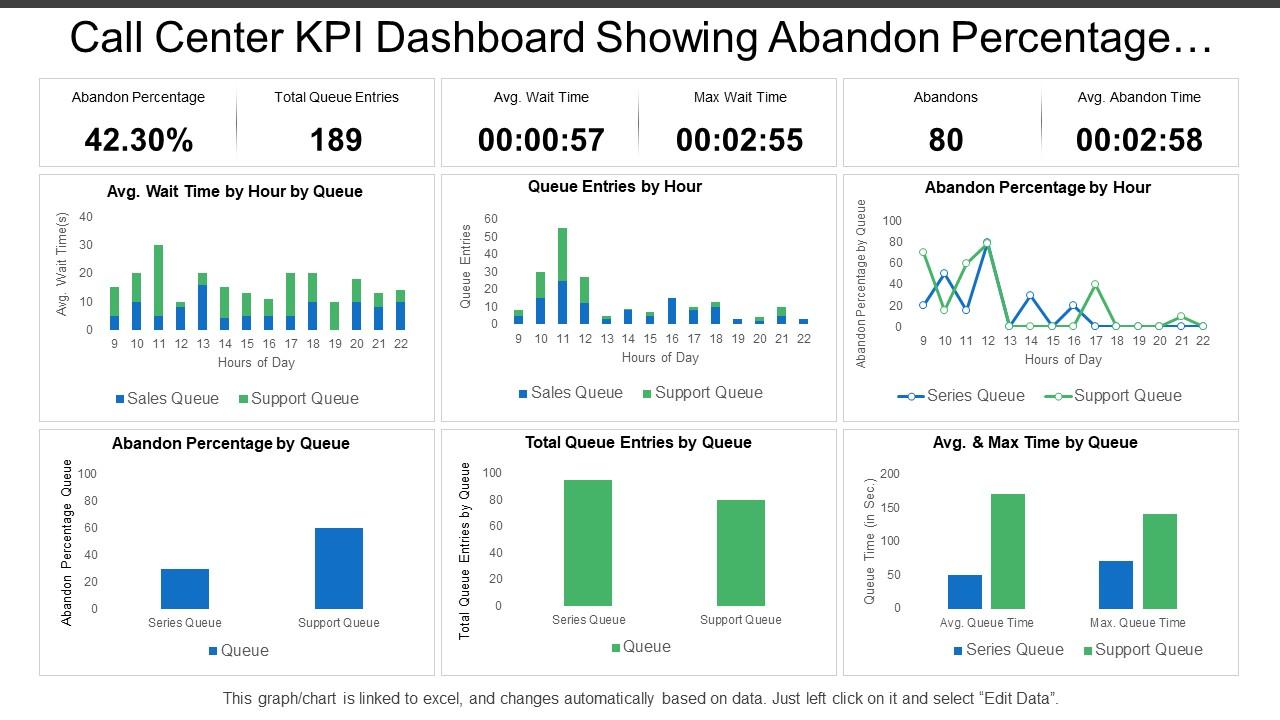
Call center kpi dashboard showing abandon percentage total queue entries
Have your boss asked you to share the information related to abandon calls? Don’t worry. Share the details in the professional manner using our Call Center KPI Dashboard PowerPoint slide. This presentation design highlights all the key aspects that your client wants to see in the report such as total calls, abandoned calls, answered calls and group calls. Now you can make them understand that this is the actual picture of the abandon calls and state your reason for the same as well. This PPT dashboard also helps you to analyze and monitor the performance at regular intervals. Dashboards are always useful to demonstrate the information related to key performance indicators, they enable you to work on the desired aspects and then change your work plan if required. Moreover, you can use this PPT design to explain the overall adequacy and performance of your services in the market and reduces cost or expense though the use of effective communication techniques. This presentation template is useful in many ways as you can change the information shown in it and can add your business metrics to keep a check on its performance. Share the numbers using it in your presentation. Monitor the performance of your business using Call Center KPI Dashboard PowerPoint template. This presentation slide has been designed for the people working in BPO (Business Process Outsource). It is vital to track key performance indicators for success. Our PPT layout can be used to demonstrate the aspects related to call center industry such as average time in queue, average abandonment rate, service level achieved, average speed of answer, average handle time and average after call work time, final call resolution etc. You can present all the above information with the help of this presentation design. There are thousands of people working in the BPO industry and it is not easy to keep a check on everyone’s performance. You can use this impressive PowerPoint slide to check the performance of your business and your team members. Having knowledge about the targets will not make you achieve your goals; you should have a clear picture of your targets at regular intervals so that you make change in your work policy or strategy. This graph chart PPT graphic enables you to monitor your business success and then make efforts to take it to next level. Download it to share with your team and clients. Highlight important articles included with our Call Center Kpi Dashboard Showing Abandon Percentage Total Queue Entries. It helps advertise the journal.
Have your boss asked you to share the information related to abandon calls? Don’t worry. Share the details in the professio..
- Google Slides is a new FREE Presentation software from Google.
- All our content is 100% compatible with Google Slides.
- Just download our designs, and upload them to Google Slides and they will work automatically.
- Amaze your audience with SlideTeam and Google Slides.
-
Want Changes to This PPT Slide? Check out our Presentation Design Services
- WideScreen Aspect ratio is becoming a very popular format. When you download this product, the downloaded ZIP will contain this product in both standard and widescreen format.
-

- Some older products that we have may only be in standard format, but they can easily be converted to widescreen.
- To do this, please open the SlideTeam product in Powerpoint, and go to
- Design ( On the top bar) -> Page Setup -> and select "On-screen Show (16:9)” in the drop down for "Slides Sized for".
- The slide or theme will change to widescreen, and all graphics will adjust automatically. You can similarly convert our content to any other desired screen aspect ratio.
Compatible With Google Slides

Get This In WideScreen
You must be logged in to download this presentation.
PowerPoint presentation slides
PowerPoint shape easy to amend as color, text, font etc are amendable. Notable quality presentation template. Well-adjusted online software programs such as JPG and PDF. Extra-ordinary picture quality as pixels don’t break when viewed in widescreen view. PPT design goes well with Google slides. Matching designs available with different nodes and stages. Handy presentation design saves you valuable time. Show the PowerPoint diagram with your corporate sign and title. Easy to download and can be saved for future reference.
People who downloaded this PowerPoint presentation also viewed the following :
Call center kpi dashboard showing abandon percentage total queue entries with all 6 slides:
Handle all commitments with equal aplomb due to our Call Center Kpi Dashboard Showing Abandon Percentage Total Queue Entries. Be able to conduct back to back events.
-
Content of slide is easy to understand and edit.
-
Great quality product.


