On-Time Delivery, Shipping KPI Dashboard Excel PowerPoint Templates
-
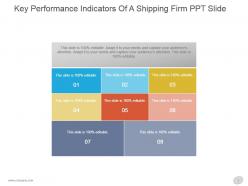 Key performance indicators of a shipping firm ppt slide
Presenting key performance indicators of a shipping firm ppt slide. This is a key performance indicators of a shipping firm ppt slide. This is a eight stage process. The stages in this process are management, business, marketing.
-
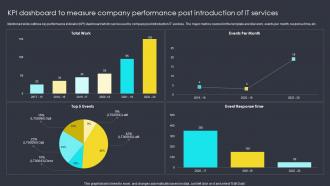 KPI Dashboard To Measure Company Performance Post Introduction Of IT Services
Mentioned slide outlines key performance indicator KPI dashboard which can be used by company post introduction IT servives. The major metrics covered in the template are total work, events per month, response time, etc. Introducing our KPI Dashboard To Measure Company Performance Post Introduction Of IT Services set of slides. The topics discussed in these slides are KPI Dashboard, Measure, Company Performance, Post Introduction, IT Services. This is an immediately available PowerPoint presentation that can be conveniently customized. Download it and convince your audience.
-
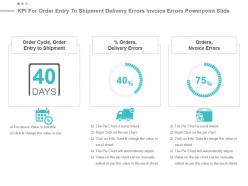 Kpi for order entry to shipment delivery errors invoice errors powerpoint slide
Presenting kpi for order entry to shipment delivery errors invoice errors powerpoint slide. This presentation slide shows three Key Performance Indicators or KPIs. The first KPI that can be show is Order Cycle, Order Entry to Shipment. The second KPI is percentage Orders, Delivery Errors and the third is Orders, Nvoice Errors. These KPI Powerpoint graphics are all data driven, and the shape automatically adjusts according to your data. Just right click on the KPI graphic, enter the right value and the shape will adjust automatically. Make a visual impact with our KPI slides.
-
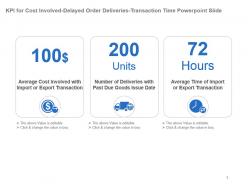 Kpi for cost involved delayed order deliveries transaction time powerpoint slide
Presenting kpi for cost involved delayed order deliveries transaction time powerpoint slide. This presentation slide shows three Key Performance Indicators or KPIs in a Dashboard style design. The first KPI that can be shown is Average Cost Involved with Import or Export Transaction. The second KPI is Number of Deliveries with Past Due Goods Issue Date and the third is Average Time of Import or Export Transaction. These KPI Powerpoint graphics are all data driven, and the shape automatically adjusts according to your data. Just right click on the KPI graphic, enter the right value and the shape will adjust automatically. Make a visual impact with our KPI slides.
-
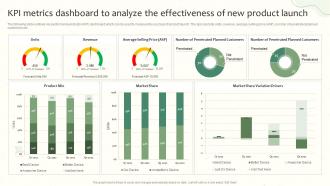 Kpi Metrics Dashboard To Analyze The Product Launch Launching A New Food Product
The following slide outlines key performance indicator KPI dashboard which can be used to measure the success of product launch.The kpis are total units, revenue, average selling price ASP, number of penetrated planned customers etc.Deliver an outstanding presentation on the topic using this Kpi Metrics Dashboard To Analyze The Product Launch Launching A New Food Product.Dispense information and present a thorough explanation of Average Selling, Penetrated Planned, Penetrated Customers using the slides given.This template can be altered and personalized to fit your needs.It is also available for immediate download.So grab it now.
-
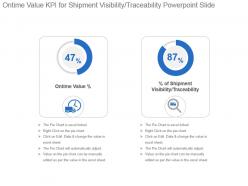 Ontime value kpi for shipment visibility traceability powerpoint slide
Presenting ontime value kpi for shipment visibility traceability powerpoint slide. This presentation slide shows two Key Performance Indicators or KPIs in a Dashboard style design. The first KPI that can be shown is Ontime Value percentage. The second KPI is percentage of Shipment Visibility Traceability. These KPI Powerpoint graphics are all data driven, and the shape automatically adjusts according to your data. Just right click on the KPI graphic, enter the right value and the shape will adjust automatically. Make a visual impact with our KPI slides.
-
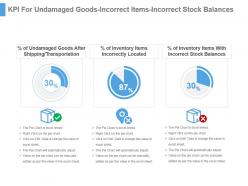 Kpi for undamaged goods incorrect items incorrect stock balances ppt slide
Presenting kpi for undamaged goods incorrect items incorrect stock balances ppt slide. This presentation slide shows Three Key Performance Indicators or KPIs in a Dashboard style design. The first KPI that can be shown is Percentage of Undamaged Goods After Shipping Transportation. The second KPI is Percentage of Inventory Items Incorrectly Located. The third is Percentage of Inventory Items With Incorrect Stock Balances. These KPI Powerpoint graphics are all data driven, and the shape automatically adjusts according to your data. Just right click on the KPI graphic, enter the right value and the shape will adjust automatically. Make a visual impact with our KPI slides.
-
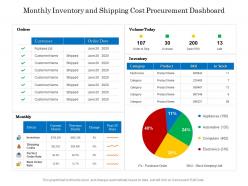 Monthly inventory and shipping cost procurement dashboard
Presenting this set of slides with name Monthly Inventory And Shipping Cost Procurement Dashboard. The topics discussed in these slides are Metric, Inventory, Costs. This is a completely editable PowerPoint presentation and is available for immediate download. Download now and impress your audience.
-
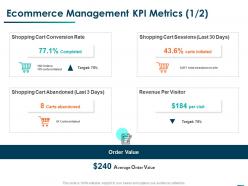 Ecommerce management kpi metrics conversion ppt powerpoint presentation model
Presenting this set of slides with name Ecommerce Management Kpi Metrics Conversion Ppt Powerpoint Presentation Model. This is a four stage process. The stages in this process are Shopping Cart Conversion Rate, Shopping Cart Sessions, Shopping Cart Abandoned, Revenue Per Visitor. This is a completely editable PowerPoint presentation and is available for immediate download. Download now and impress your audience.
-
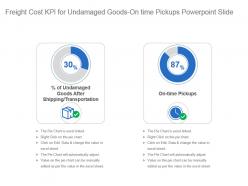 Freight cost kpi for undamaged goods on time pickups powerpoint slide
Presenting freight cost kpi for undamaged goods on time pickups powerpoint slide. This presentation slide shows two Key Performance Indicators or KPIs in a Dashboard style design. The first KPI that can be shown is percentage of Undamaged Goods After Shipping Transportation. The second KPI is On time Pickups. These KPI Powerpoint graphics are all data driven, and the shape automatically adjusts according to your data. Just right click on the KPI graphic, enter the right value and the shape will adjust automatically. Make a visual impact with our KPI slides.
-
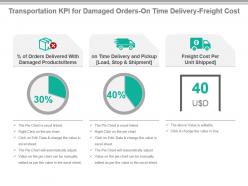 Transportation kpi for damaged orders on time delivery freight cost ppt slide
Presenting transportation kpi for damaged orders on time delivery freight cost ppt slide. This presentation slide shows three Key Performance Indicators or KPIs in a Dashboard style design. The first KPI that can be shown is percentage of Orders Delivered With Damaged Products Items. The second KPI is on Time Delivery and Pickup Load, Stop and Shipment and the third is Freight Cost Per Unit Shipped. These KPI Powerpoint graphics are all data driven, and the shape automatically adjusts according to your data. Just right click on the KPI graphic, enter the right value and the shape will adjust automatically. Make a visual impact with our KPI slides.
-
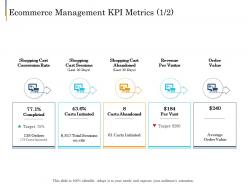 Ecommerce management kpi metrics e business plan ppt portrait
Introducing Ecommerce Management KPI Metrics E Business Plan Ppt Portrait to increase your presentation threshold. Encompassed with five stages, this template is a great option to educate and entice your audience. Dispence information on Shopping Cart Conversion Rate, Shopping Cart Sessions, Shopping Cart Abandoned, using this template. Grab it now to reap its full benefits.
-
 Ecommerce management kpi metrics shopping cart digital business management ppt icons
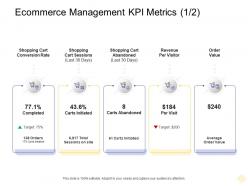
Increase audience engagement and knowledge by dispensing information using Ecommerce Management Kpi Metrics Shopping Cart Digital Business Management Ppt Icons. This template helps you present information on four stages. You can also present information on Shopping Cart Conversion Rate,Shopping Cart Sessions, Shopping Cart Abandoned, Revenue Per Visitor, Order Value using this PPT design. This layout is completely editable so personaize it now to meet your audiences expectations.
-
 Essential Digital Supply Chain Metrics Shipping And Logistics Ppt File Infographics
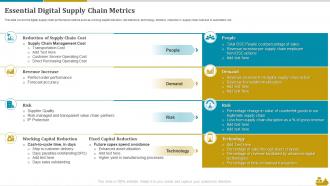
This slide covers the digital supply chain performance metrics such as working capital reduction, risk tolerance, technology, demand, reduction in supply chain cost due to automation etc. Introducing Essential Digital Supply Chain Metrics Shipping And Logistics Ppt File Infographics to increase your presentation threshold. Encompassed with four stages, this template is a great option to educate and entice your audience. Dispence information on Reduction Of Supply Chain Cost, Working Capital Reduction, Fixed Capital Reduction, using this template. Grab it now to reap its full benefits.
-
 Shipping Order Management KPI Dashboard
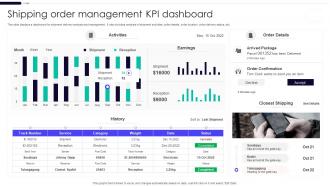
This slide displays a dashboard for shipment delivery analysis and management. It also includes analysis of shipment activities, order details, order location, order delivery status, etc. Presenting our well-structured Shipping Order Management KPI Dashboard. The topics discussed in this slide are Shipping Order Management, KPI Dashboard. This is an instantly available PowerPoint presentation that can be edited conveniently. Download it right away and captivate your audience.
-
 Monthly Shipping And Inventory KPI Tracker
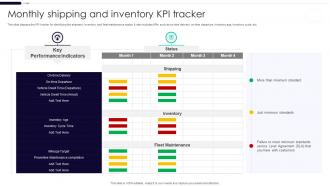
This slide displays the KPI tracker for identifying the shipment, inventory, and fleet maintenance status. It also includes KPIs such as on time delivery, on-time departure, inventory age, inventory cycle, etc. Introducing our Monthly Shipping And Inventory KPI Tracker set of slides. The topics discussed in these slides are Shipping, Inventory, Fleet Maintenance. This is an immediately available PowerPoint presentation that can be conveniently customized. Download it and convince your audience.
-
 On Time Delivery Shipping KPI Icon
Presenting our well-structured On Time Delivery Shipping KPI Icon. The topics discussed in this slide are On Time Delivery, Shipping KPI, Icon. This is an instantly available PowerPoint presentation that can be edited conveniently. Download it right away and captivate your audience.
-
 Shipping KPI Dashboard With Vessel Tracking
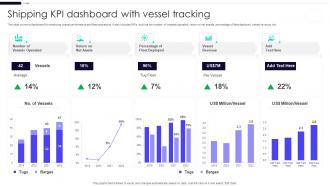
This slide covers a dashboard for analyzing vessel performance and fleet operations. It also includes KPIs such as the number of vessels operated, return on net assets, percentage of fleet deployed, vessel revenue, etc. Presenting our well-structured Shipping KPI Dashboard With Vessel Tracking. The topics discussed in this slide are Shipping KPI Dashboard, Vessel Tracking. This is an instantly available PowerPoint presentation that can be edited conveniently. Download it right away and captivate your audience.
-
 Shipping Company Profile Competitor Comparison By Operations And Revenue
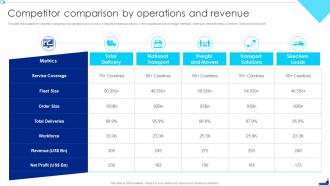
The slide showcases the competitor comparison by operations and revenue. It depicts comparison metrics which includes service coverage, fleet size, order size, total deliveries, workforce, revenue and net profit. Present the topic in a bit more detail with this Shipping Company Profile Competitor Comparison By Operations And Revenue. Use it as a tool for discussion and navigation onService Coverage, Total Deliveries, Net Profit. This template is free to edit as deemed fit for your organization. Therefore download it now.
-
 Shipment kpi for transportation cost shipped units lead time ppt slide
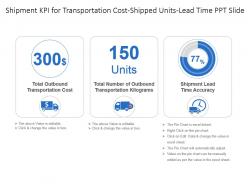
Presenting shipment kpi for transportation cost shipped units lead time ppt slide. This presentation slide shows three Key Performance Indicators or KPIs in a Dashboard style design. The first KPI that can be shown is Total Outbound Transportation Cost. The second KPI is Total Number of Outbound Transportation Kilograms and the third is Shipment Lead Time Accuracy. These KPI Powerpoint graphics are all data driven, and the shape automatically adjusts according to your data. Just right click on the KPI graphic, enter the right value and the shape will adjust automatically. Make a visual impact with our KPI slides.
-
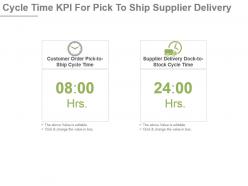 Cycle time kpi for pick to ship supplier delivery ppt slide
Presenting cycle time kpi for pick to ship supplier delivery ppt slide. This presentation slide shows Two Key Performance Indicators or KPIs in a Dashboard style design. The first KPI that can be shown is Customer Order Pick to Ship Cycle Time. The second KPI is Supplier Delivery Dock to Stock Cycle Time. These KPI Powerpoint graphics are all data driven, and the shape automatically adjusts according to your data. Just right click on the KPI graphic, enter the right value and the shape will adjust automatically. Make a visual impact with our KPI slides.
-
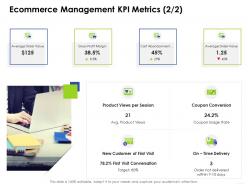 Ecommerce management kpi metrics e business management
Increase audience engagement and knowledge by dispensing information using Ecommerce Management KPI Metrics E Business Management. This template helps you present information on four stages. You can also present information on Average Order Value, Gross Profit Margin, Cart Abandonment, Average Order Value using this PPT design. This layout is completely editable so personaize it now to meet your audiences expectations.
-
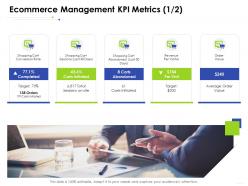 Ecommerce management kpi metrics ordere business management ppt designs
Introducing Ecommerce Management KPI Metrics Ordere Business Management Ppt Designs to increase your presentation threshold. Encompassed with five stages, this template is a great option to educate and entice your audience. Dispence information on Shopping Cart Conversion Rate, Shopping Cart Abandoned Last 30 Days, Revenue Per Visitor, using this template. Grab it now to reap its full benefits.
-
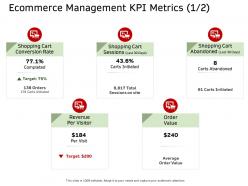 E commerce management kpi metrics order ppt formats
Increase audience engagement and knowledge by dispensing information using E Commerce Management KPI Metrics Order Ppt Formats. This template helps you present information on five stages. You can also present information on shopping cart, conversion rate, shopping cart sessions, order value using this PPT design. This layout is completely editable so personaize it now to meet your audiences expectations.
-
 Shipment kpi for bill accuracy outbound transportation costs ppt slide
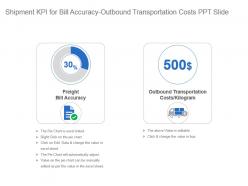
Presenting shipment kpi for bill accuracy outbound transportation costs ppt slide. This presentation slide shows two Key Performance Indicators or KPIs in a Dashboard style design. The first KPI that can be shown is Freight Bill Accuracy. The second KPI is Outbound Transportation Costs Kilogram. These KPI Powerpoint graphics are all data driven, and the shape automatically adjusts according to your data. Just right click on the KPI graphic, enter the right value and the shape will adjust automatically. Make a visual impact with our KPI slides.
-
 Implementing Iot Architecture In Shipping Business Analyzing Impact Of Blockchain Iot On Major Kpis
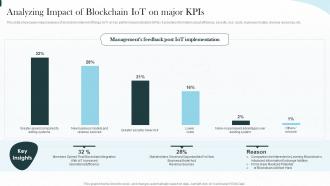
This slide showcases impact analysis of blockchain internet of things IoT on key performance indicators KPIs. It provides information about efficiency, security, risk, costs, business models, revenue resources, etc. Present the topic in a bit more detail with this Implementing Iot Architecture In Shipping Business Analyzing Impact Of Blockchain Iot On Major Kpis. Use it as a tool for discussion and navigation on Business, Revenue, Resources. This template is free to edit as deemed fit for your organization. Therefore download it now.
-
 Shipping Error Rate KPI Tracker
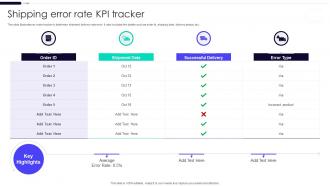
This slide illustrates an order tracker to determine shipment delivery rate error. It also includes the details such as order id, shipping date, delivery status, etc. Introducing our Shipping Error Rate KPI Tracker set of slides. The topics discussed in these slides are Shipping Error Rate, KPI Tracker. This is an immediately available PowerPoint presentation that can be conveniently customized. Download it and convince your audience.
-
 Ontime value kpi for orders damage shipments ppt slide
Presenting ontime value kpi for orders damage shipments ppt slide. This presentation slide shows two Key Performance Indicators or KPIs in a Dashboard style design. The first KPI that can be shown is Orders, Correct Documentation. The second KPI is Orders, Damage Shipments. These KPI Powerpoint graphics are all data driven, and the shape automatically adjusts according to your data. Just right click on the KPI graphic, enter the right value and the shape will adjust automatically. Make a visual impact with our KPI slides.
-
 Primary And Secondary Shipping KPI Profile
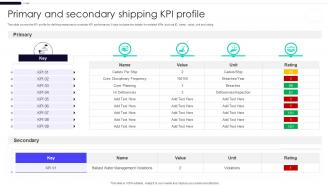
This slide covers the KPI profile for defining measures to evaluate KPI performance. It also includes the details for enlisted KPIs such as ID, name, value, unit and rating. Introducing our Primary And Secondary Shipping KPI Profile set of slides. The topics discussed in these slides are Primary Secondary Shipping, KPI Profile. This is an immediately available PowerPoint presentation that can be conveniently customized. Download it and convince your audience.
-
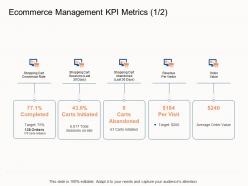 Ecommerce management kpi metrics shopping e business strategy ppt introduction
Increase audience engagement and knowledge by dispensing information using Ecommerce Management KPI Metrics Shopping E Business Strategy Ppt Introduction. This template helps you present information on five stages. You can also present information on Completed, Carts Initiated, Carts Abandoned, Per Visit using this PPT design. This layout is completely editable so personaize it now to meet your audiences expectations.
-
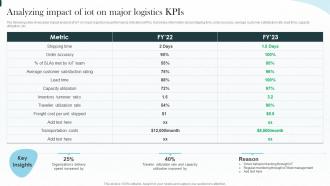 F591 Implementing Iot Architecture In Shipping Business Analyzing Impact Of Iot On Major Logistics Kpis
The following slide showcases impact analysis of IoT on major logistics key performance indicators KPIs. It provides information about shipping time, order accuracy, average customer satisfaction rate, lead time, capacity utilization, etc. Deliver an outstanding presentation on the topic using this F591 Implementing Iot Architecture In Shipping Business Analyzing Impact Of Iot On Major Logistics Kpis. Dispense information and present a thorough explanation of Analyzing, Performance, Indicators using the slides given. This template can be altered and personalized to fit your needs. It is also available for immediate download. So grab it now.
-
 F452 Analyzing Impact Of Blockchain Iot On Major Enabling Smart Shipping And Logistics Through Iot
This slide showcases impact analysis of blockchain internet of things IoT on key performance indicators KPIs. It provides information about efficiency, security, risk, costs, business models, revenue resources, etc. Deliver an outstanding presentation on the topic using this F452 Analyzing Impact Of Blockchain Iot On Major Enabling Smart Shipping And Logistics Through Iot. Dispense information and present a thorough explanation of Analyzing, Implementation, Stakeholders using the slides given. This template can be altered and personalized to fit your needs. It is also available for immediate download. So grab it now.


