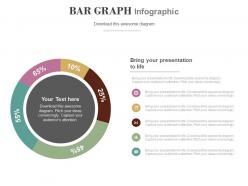
Circle bar graph with percentage analysis powerpoint slides
Our Circle Bar Graph With Percentage Analysis Powerpoint Slides are veritable cash cards. Your thoughts will be rewarded on the spot.
- Google Slides is a new FREE Presentation software from Google.
- All our content is 100% compatible with Google Slides.
- Just download our designs, and upload them to Google Slides and they will work automatically.
- Amaze your audience with SlideTeam and Google Slides.
-
Want Changes to This PPT Slide? Check out our Presentation Design Services
- WideScreen Aspect ratio is becoming a very popular format. When you download this product, the downloaded ZIP will contain this product in both standard and widescreen format.
-

- Some older products that we have may only be in standard format, but they can easily be converted to widescreen.
- To do this, please open the SlideTeam product in Powerpoint, and go to
- Design ( On the top bar) -> Page Setup -> and select "On-screen Show (16:9)” in the drop down for "Slides Sized for".
- The slide or theme will change to widescreen, and all graphics will adjust automatically. You can similarly convert our content to any other desired screen aspect ratio.
Compatible With Google Slides

Get This In WideScreen
You must be logged in to download this presentation.
PowerPoint presentation slides
Presenting circle bar graph with percentage analysis powerpoint slides. This Power Point template slide has been crafted with graphic of circle bar graph and percentage icons. This PPT slide contains the concept of financial analysis. Use this PPT slide for business and marketing related presentations.
People who downloaded this PowerPoint presentation also viewed the following :
Content of this Powerpoint Presentation
Description:
The image displays an infographic featuring a circular bar graph designed to visually represent data percentages in various categories. The graph includes four segments with different colors, each corresponding to specific data percentages, namely 65%, 10%, 25%, and 55%. In the center of the circular bar graph, there is a placeholder text that reads "Your Text here," indicating the customizable nature of the infographic, allowing users to insert their specific content. The template is presented as an enhancement for presentations, emphasizing its ability to help pitch ideas convincingly and capture the audience's attention effectively.
Below the circular bar graph, a section is divided into four parts, each conveying the same message with a distinct icon accompanying it. The message, "Bring your presentation to life. Download this awesome diagram. Capture your audience's attention. Pitch your ideas convincingly," highlights the benefits of utilizing this graphical representation to support a presentation. Each instance of the repeated text block is associated with an icon, including headphones, a speech bubble, a light bulb, and a location pin, symbolizing various aspects of communication and idea sharing.
Use Cases:
This versatile infographic template can find applications across a wide range of industries for various purposes. It excels at displaying survey results, illustrating data breakdowns, or sharing statistics in a visually appealing format. Here are seven industries that could benefit from incorporating these slides into their presentations:
1. Consulting:
Use: To visualize client data distribution, enhancing the clarity of recommendations and insights.
Presenter: Management consultant.
Audience: Corporate clients and stakeholders.
2. Marketing:
Use: To demonstrate campaign performance metrics, making data-driven decisions more compelling.
Presenter: Marketing strategist.
Audience: Marketing team members, executives, and stakeholders.
3. Education:
Use: To showcase student demographic statistics, aiding in academic research and institutional planning.
Presenter: Academic researcher, educator, or administrator.
Audience: Educators, administrators, and academic professionals.
4. Healthcare:
Use: To represent patient data or health statistics, facilitating data-driven healthcare decisions.
Presenter: Healthcare analyst or medical professional.
Audience: Medical professionals, healthcare administrators, and policymakers.
5. Finance:
Use: To depict financial allocations or investment percentages, making financial presentations more persuasive.
Presenter: Financial advisor or finance professional.
Audience: Investors, finance committee members, and clients.
6. Technology:
Use: To illustrate market share of different tech products, aiding in strategic planning.
Presenter: Market analyst or tech industry expert.
Audience: Tech company stakeholders and investors.
7. Non-Profit Organizations:
Use: To display the distribution of spending on various projects, fostering transparency and donor trust.
Presenter: Non-profit manager or fundraiser.
Audience: Donors, supporters, and stakeholders in the non-profit sector.
Circle bar graph with percentage analysis powerpoint slides with all 4 slides:
Deliver better on every demand with our Circle Bar Graph With Percentage Analysis Powerpoint Slides. They allow you to beat customer expectations.
-
Great designs, really helpful.
-
It saves your time and decrease your efforts in half.


