Circle chart with percentage values for financial data powerpoint slides
If you are keen to present your business and finance related Information in an Organised and professional manner then Simply merge our Expert Designed Circle Chart with percentage values for Financial data PPT templates with your presentation to have a wondrous experience. Also, the main topics and the titles can be highlighted using these patterns to make them easily noticeable by the viewers. Apart from this, memorising the content of these layouts is easy due to the vibrant colours and designs. Adding to its value, its feature of complete modification will enable the user to customise the content of these illustrations as per the need of the organisation. Moreover, fiscal management being an extremely crucial and vital concept needs to be proposed accurately so that the Organisational status is clear in front of the viewers and that’s what our diagrams aim to provide. Therefore, quickly grab these amazing designs and be a presentation Pro. The cup flows over with our Circle Chart With Percentage Values For Financial Data Powerpoint Slides. You will definitely get more than your fill.
- Google Slides is a new FREE Presentation software from Google.
- All our content is 100% compatible with Google Slides.
- Just download our designs, and upload them to Google Slides and they will work automatically.
- Amaze your audience with SlideTeam and Google Slides.
-
Want Changes to This PPT Slide? Check out our Presentation Design Services
- WideScreen Aspect ratio is becoming a very popular format. When you download this product, the downloaded ZIP will contain this product in both standard and widescreen format.
-

- Some older products that we have may only be in standard format, but they can easily be converted to widescreen.
- To do this, please open the SlideTeam product in Powerpoint, and go to
- Design ( On the top bar) -> Page Setup -> and select "On-screen Show (16:9)” in the drop down for "Slides Sized for".
- The slide or theme will change to widescreen, and all graphics will adjust automatically. You can similarly convert our content to any other desired screen aspect ratio.
Compatible With Google Slides

Get This In WideScreen
You must be logged in to download this presentation.
PowerPoint presentation slides
Clearly describes the financial data and information without creating any misconceptions. Helps in making future plans and strategies. User friendly PowerPoint Presentation diagrams. Creates a sense of positivity and professionalism. Extremely favorable for the business owners, investors, clients and customers. Delivers a true and correct presentation message.
People who downloaded this PowerPoint presentation also viewed the following :
Content of this Powerpoint Presentation
Description:
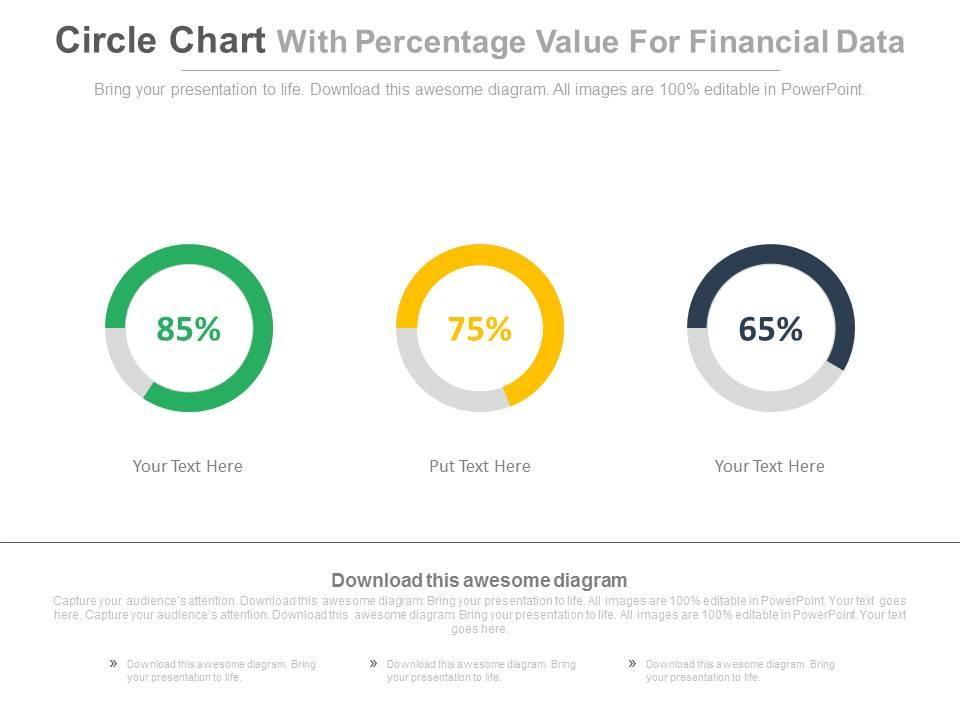
The image displays a PowerPoint slide titled "Circle Chart With Percentage Value For Financial Data." It features three circular charts (donut charts), each representing a different percentage value: 85% in green, 75% in yellow, and 65% in grey. Below each chart is a placeholder for text, currently showing "Your Text Here" or "Put Text Here," indicating that these can be customized to describe what each percentage represents.
Use Cases:
These types of slides can be employed in a broad range of industries for visually representing statistical data, performance metrics, or completion rates:
1. Finance:
Use: Displaying investment growth or fund allocation
Presenter: Financial Analyst
Audience: Investors, Clients
2. Marketing:
Use: Showing campaign reach or conversion rates
Presenter: Marketing Manager
Audience: Marketing Team, Executives
3. Sales:
Use: Representing sales targets or quota attainment
Presenter: Sales Director
Audience: Sales Staff, Management
4. Healthcare:
Use: Illustrating patient recovery rates or treatment adherence
Presenter: Healthcare Administrator
Audience: Medical Professionals, Patients
5. Education:
Use: Demonstrating graduation rates or course completion percentages
Presenter: Academic Administrator
Audience: Educators, Students
6. Manufacturing:
Use: Showing production completion or quality control pass rates
Presenter: Operations Manager
Audience: Production Team, Quality Assurance Staff
7. Non-Profit:
Use: Visualizing fundraising goals or program progress
Presenter: Development Officer
Audience: Donors, Board Members
Circle chart with percentage values for financial data powerpoint slides with all 4 slides:
Capabilities acquire another dimension with our Circle Chart With Percentage Values For Financial Data Powerpoint Slides. Experience greater facility in functioning.
-
Great designs, Easily Editable.
-
Designs have enough space to add content.


