Data is just a collection of facts, numbers, words, and measurements until it gets converted into a story. Showing reports and dashboards can become overwhelming without adding a narrative to the data. But often this narrative needs the support of visualization.
Visuals give us answers to the questions we didn’t even know we had in our minds. In fact, the human brain can process visuals up to 60,000 times faster than text. Therefore, we can credibly say “facts tell, stories sell”, but visuals engage and interest the users to create a lasting impact.
In this blog, we will talk about donut chart visuals that depict innovative patterns and conclusions to weave any given data into a legitimate story.
Donut charts: Evolved pie charts
A donut chart looks very similar to a pie chart except for the center hole, thus serving the purpose of easy analysis and reading of the diagram. Donut charts are known to express a part-to-whole relationship, where all the parts represent 100% when collected together. They enable compact and uncluttered representation of data as compared to pie charts. Furthermore, you can use them as segments where each arc represents a proportional value when connected with a piece of data.
Knowing all this, you must be curious to understand the reason for the replacement of pie charts. Let’s comprehend!
With the minor difference of a hollow circle in the center, a donut chart illuminates the complexities of the human brain and visual perception. Instead of focusing on the center entirely, as in the case of pie charts, the eyes travel around the circumference in a donut chart, therefore calibrating each piece according to its length. This makes the mind think of it as a stacked bar graph curled around on itself, easing the comparison process.
Top 30 donut chart templates
Donut chart is a valuable and user-friendly tool that is easy to draw, has a clear-cut structure, and can be quickly understood even by non-professionals. You can change its values, text boxes, and label insertions according to your need, thus making the reading process convenient.
So to help you leaps and bounds for citing multiple non-relative data sets and simple comparisons, we present our top 30 handpicked donut chart templates crafted in PowerPoint. Blend them into your presentation and impress your audience by depicting an accurate data relationship.
Template 1
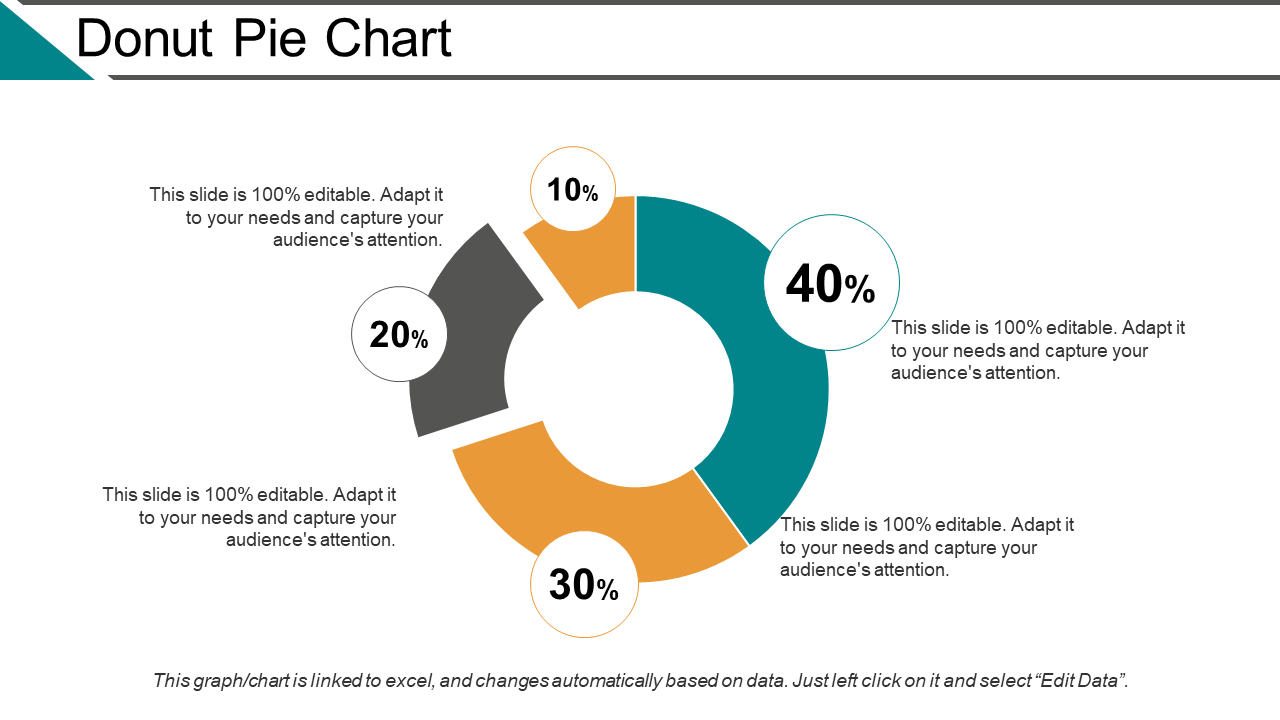
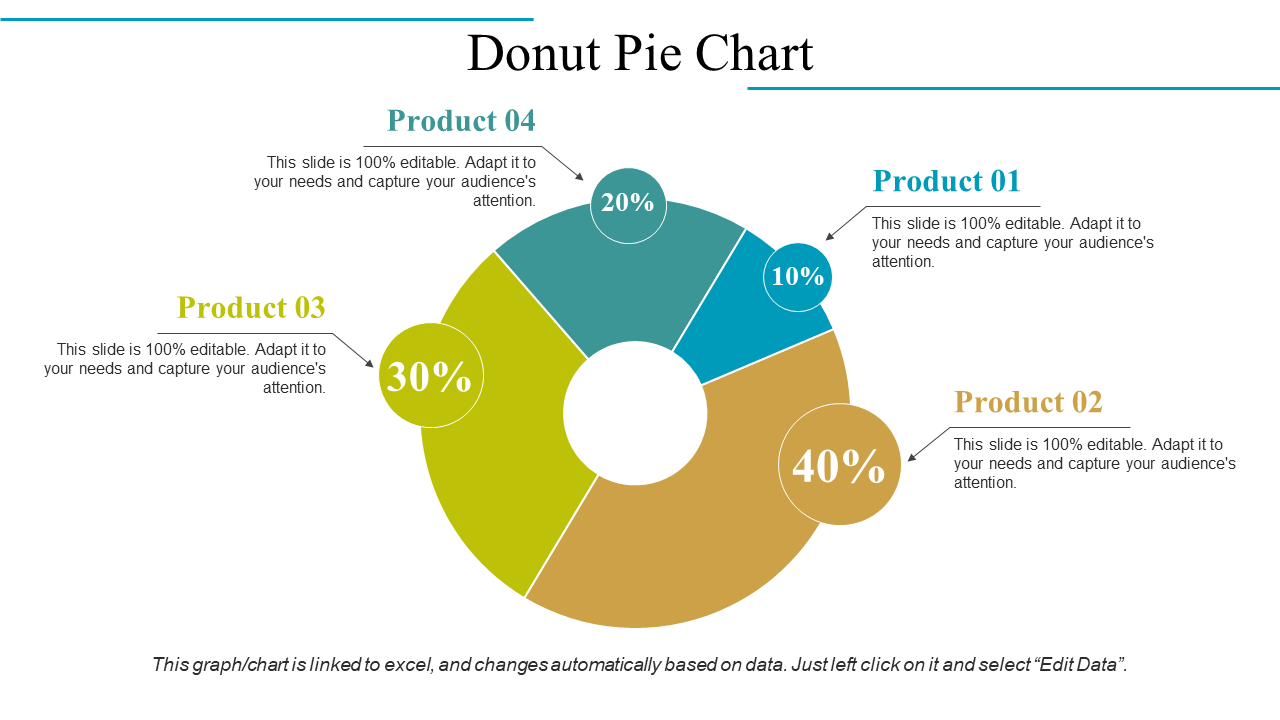
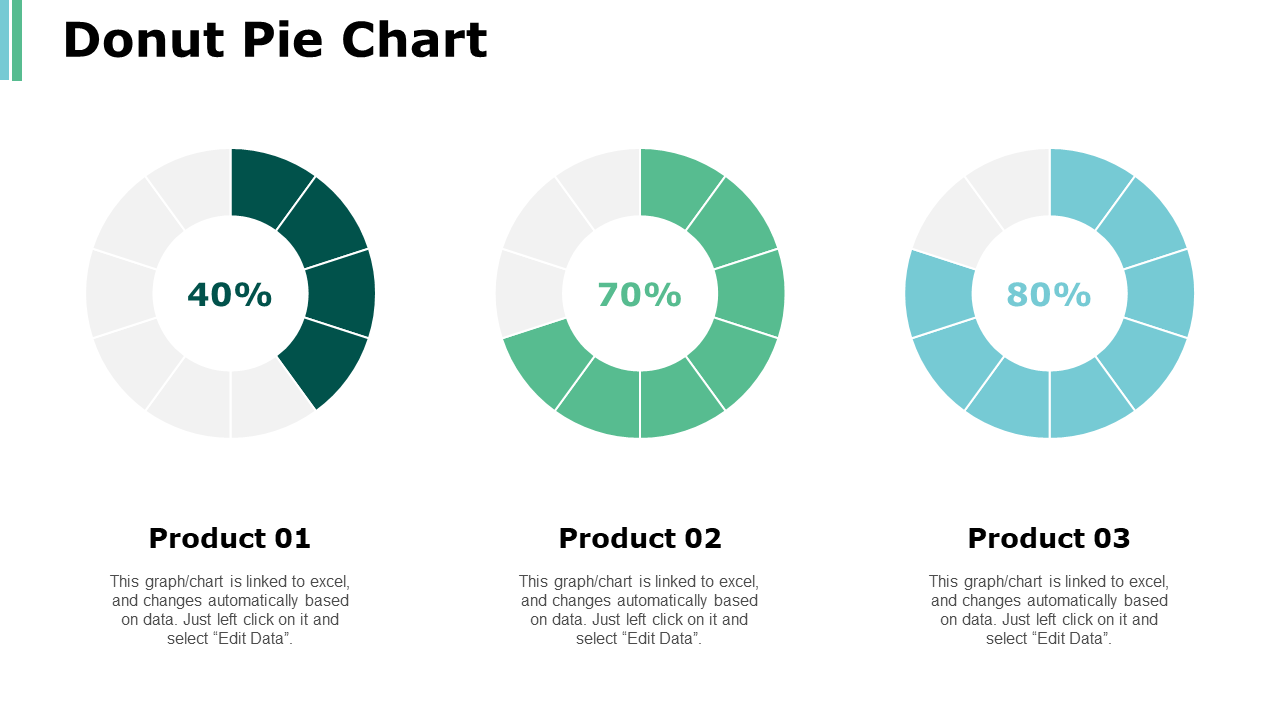
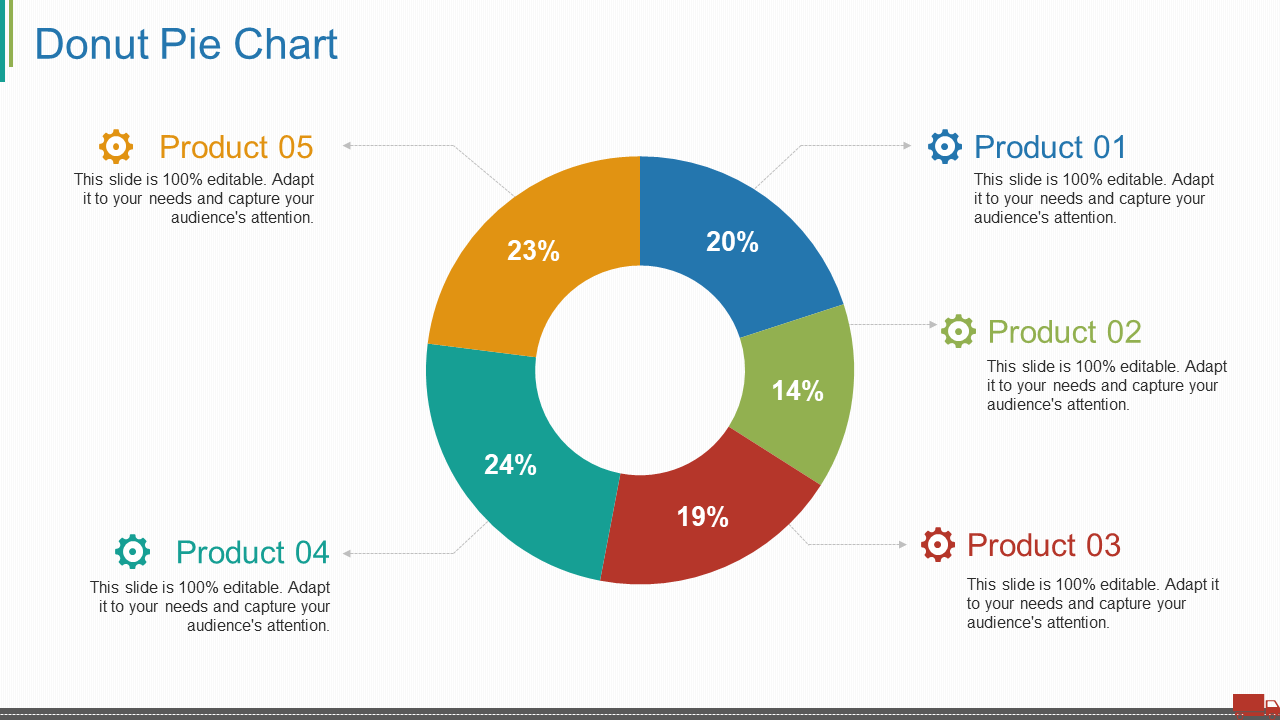
Pick this donut chart template and utilize it to represent all types of data comparison. Its well-designed visual presentation does not require any additional information. So download it right away!
Download Donut Pie Chart PowerPoint Shapes
Template 2
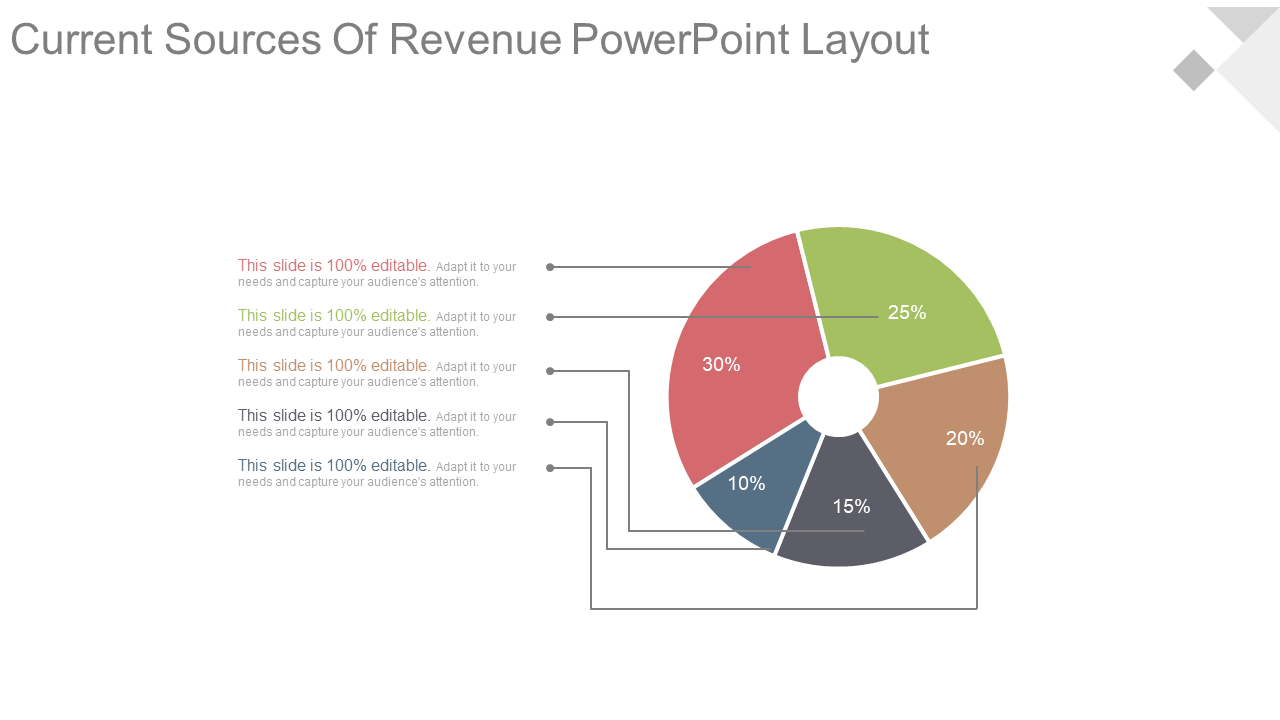
This template design can be used by businesses to show all the sources of revenue. It is easy to edit. Therefore, download immediately and replace the text with your company’s revenue statistics.
Download Current Sources Of Revenue with Donut Chart PowerPoint Templates
Template 3
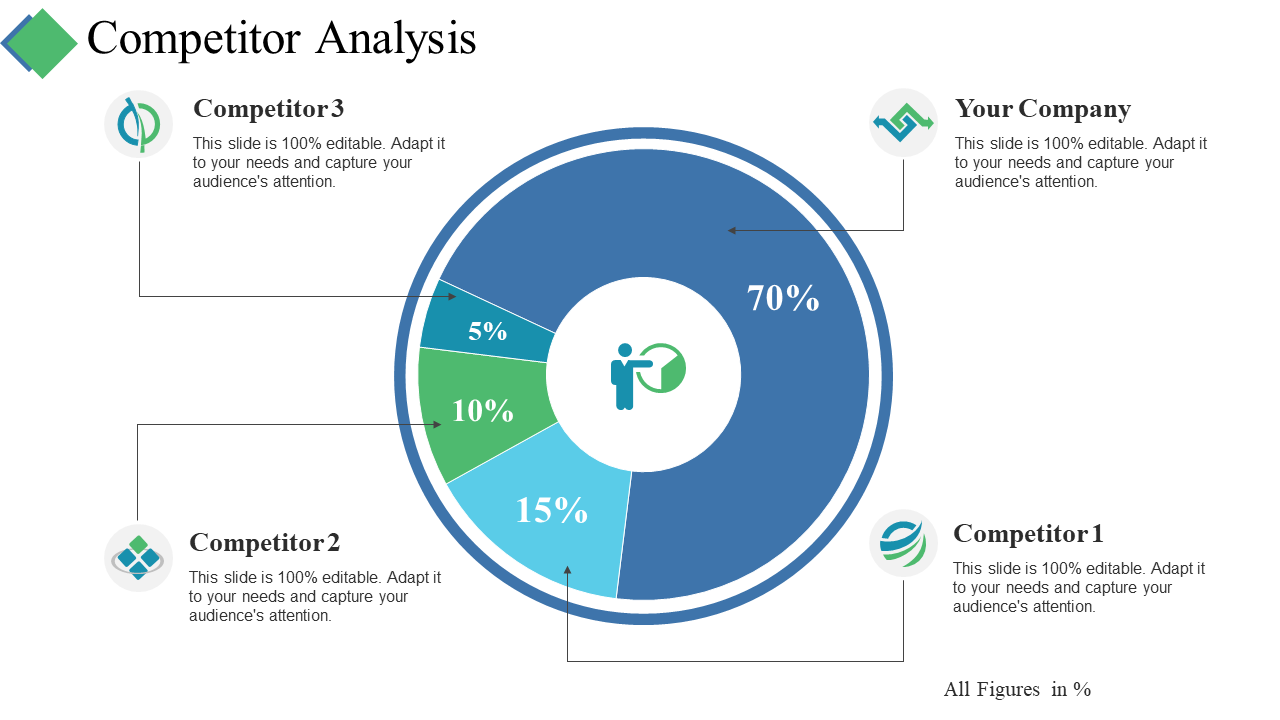
Pick this invigorating template to understand your competitors’ strengths and weaknesses. Besides, you can also edit the donut representation of this template with other colors, fonts, or sizes. So download it and make desired changes.
Download Competitor Analysis PPT with Donut Chart Template
Template 4
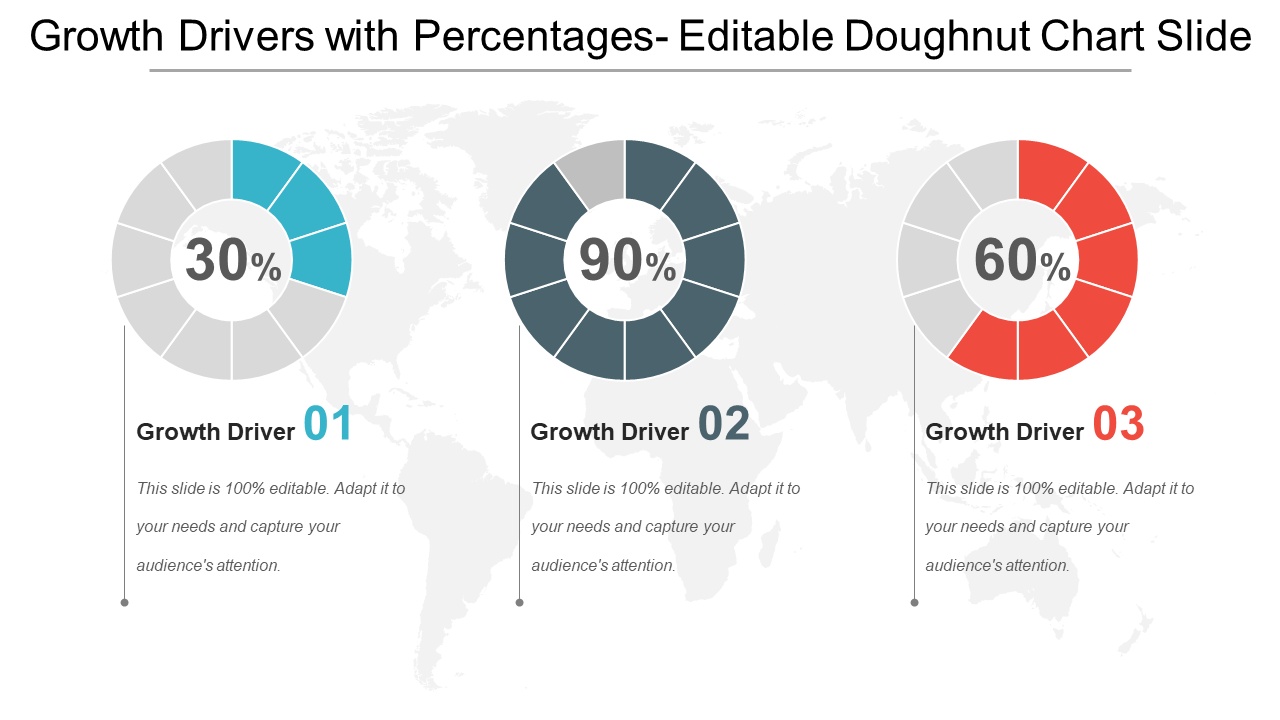
Improve your business performance and manage risk with this growth donut chart presentation. The template will help you recognize the potential growth opportunities to advance your business. Therefore, grab it right away!
Download Growth Drivers With Percentages Editable Doughnut Chart Templates
Template 5
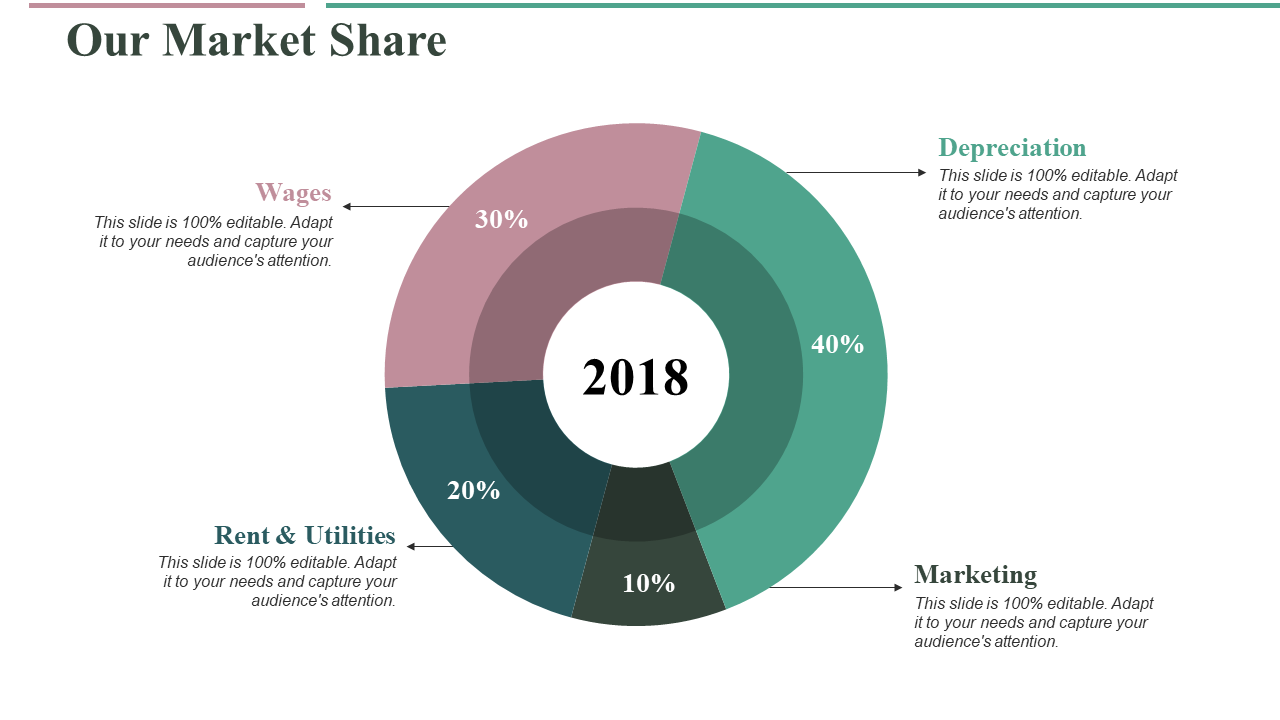
Represent your company’s market share based on multiple factors like depreciation, wages, rent and utilities, marketing, and more. You can share this template with your team members through Google Slides and PowerPoint. So grab it instantly!
Download Your Market Share PPT with Donut Chart
Template 6
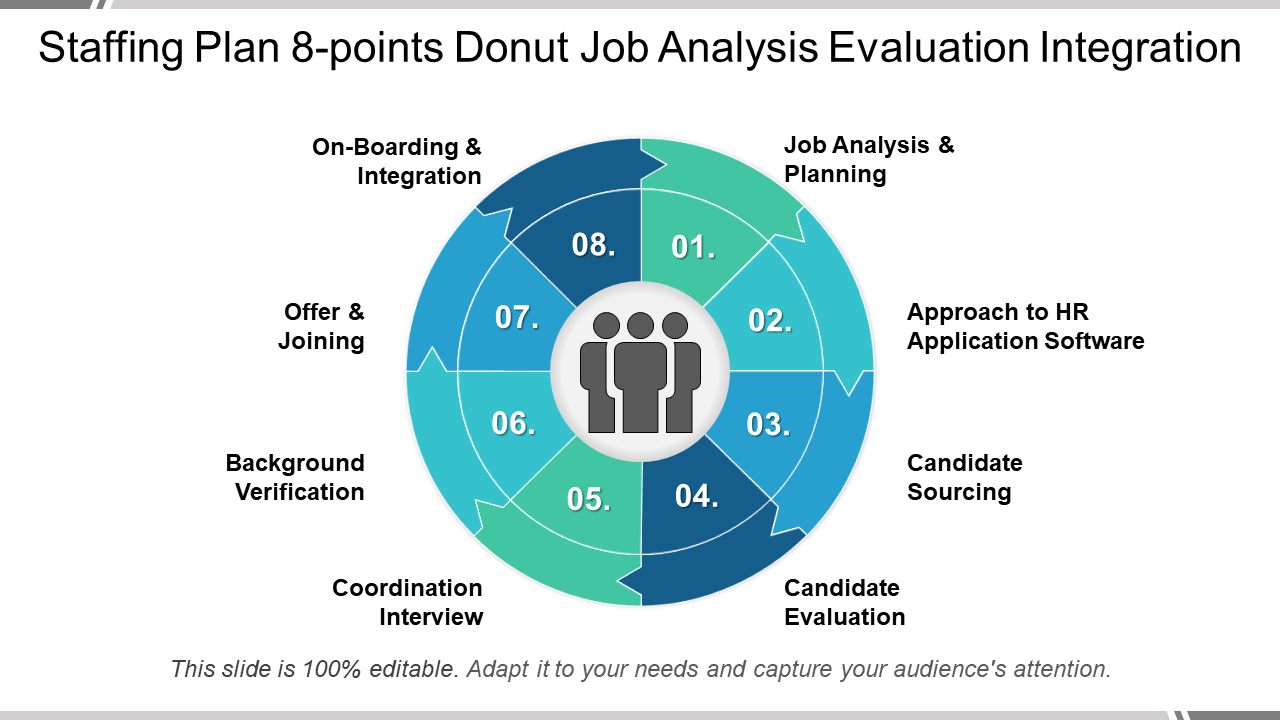
Evaluate the candidates based on multiple factors like onboarding integration, background verification, coordination interview, evaluation, sourcing, and more. Collect the data and exhibit it with the help of this staffing plan template.
Download Staffing Plan 8 Points Donut Job Analysis
Template 7
Manage your business by understanding the problems and grievances of employees and motivate them to work better with this donut chart template. You can use it to highlight the loopholes and their impact on the management. So grab it and make changes as per your requirement.
Download Donut Business Management PPT
Template 8
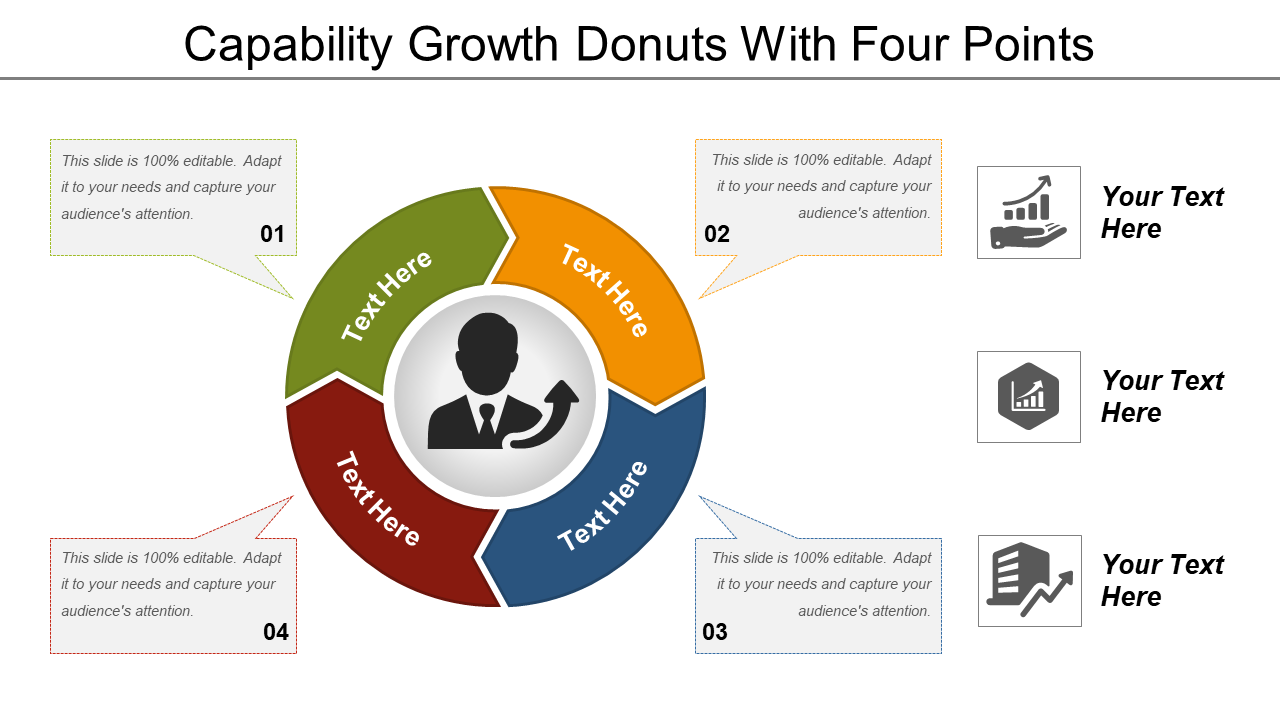
Highlight the crucial factors for capability development with the help of this 4-point donut chart template. This design is easy to edit, so download it and share professional training features with your team members. You can include skill-based, knowledge-based, and experience-based training.
Download Capability Growth Donuts With Four PointsTemplate
Template 9
Uncover and correct the inaccurate records from this data cleaning donut chart template. The design is crafted by our team of expert professionals. So download and add it to your business presentation.
Download Data Cleaning Donut With Icon And Cylinders Template
Template 10
Choose this pie and donut chart template to analyze your company's sales, costs, revenue, and more. The design includes vibrant colors that can easily captivate your audience. So download and assess the year-on-year growth.
Download Data Driven Pie Chart And Donuts For Analysis PowerPoint Slides
Template 11
Elucidate your company’s sales progress chart with this template design. Along with bar graphs, this design also includes a visually appealing donut chart. So download and use it to your advantage.
Download Progress Sales Chart And Donut Dashboard
Template 12
This is yet another donut chart template that can be used to display survey questions with comparing categories. So download it and eliminate the trickiness of reading pie charts.
Download Donut Pie Chart PPT PowerPoint Presentation File Influencers
Template 13
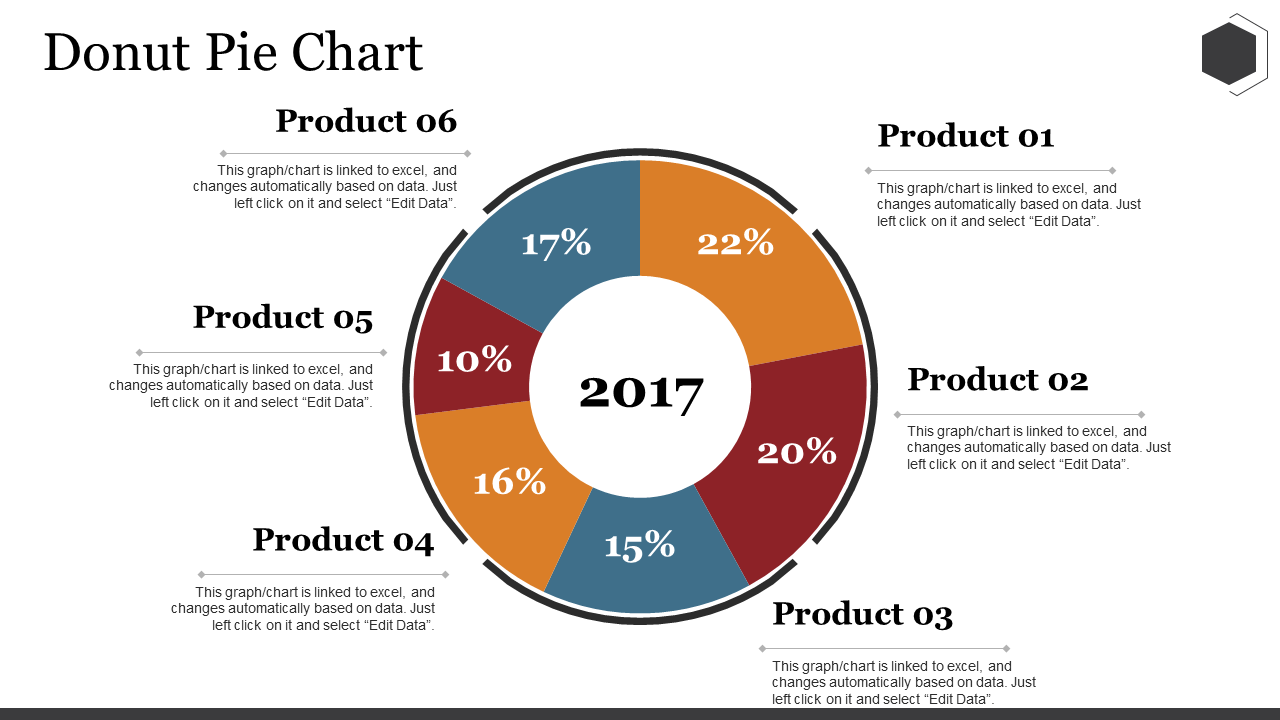
This is another example of a donut chart that companies can use to compare their different product ranges. The design includes a host of features, of which flexibility tops the list. So download and edit easily with your product information.
Download Donut Pie Chart PowerPoint Slide Presentation
Template 14
This is a four-staged donut chart that can be used to evaluate businesses, projects, budgets, and other finance-related transactions to determine their performance and suitability. So download and edit as per your need.
Download Four Staged Donut Charts For Financial Analysis
Template 15
Pick this well-structured donut chart template to depict your employees’ age breakdown, turnover rate, absenteeism, work status, and gender split. This design can be used by HR managers, so download and edit immediately.
Download Employee Dashboard Age Demographics Breakdown Using Graph Donut Chart
Template 16
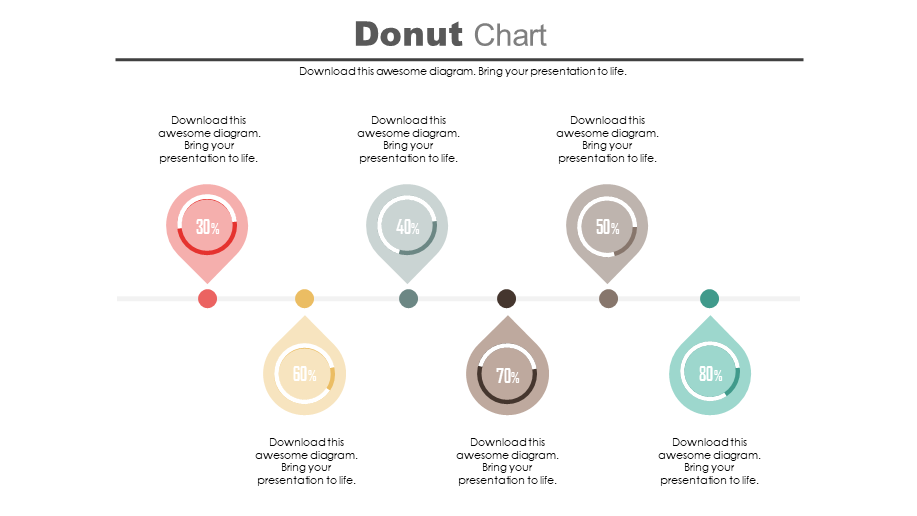
Utilize this innovative donut chart timeline template to organize the work effectively by setting direction and priority for all employees. Download it right away and edit these six stages with your information.
Download Six Staged Donut Chart Percentage Timeline
Template 17
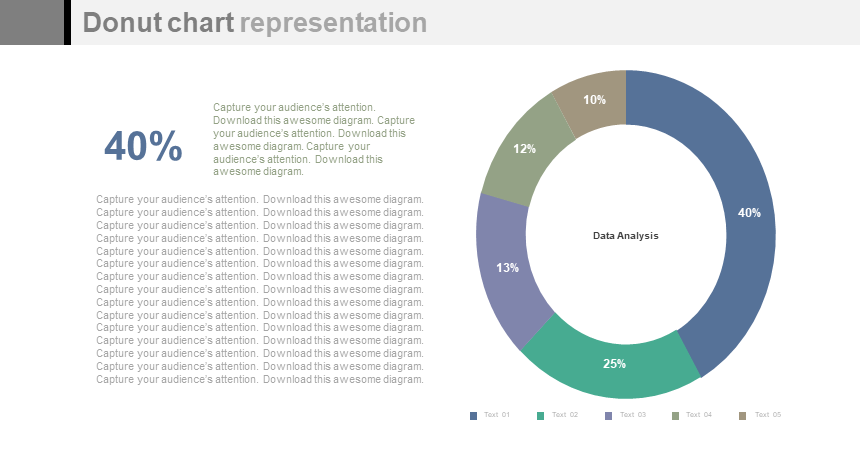
This is a circle donut chart presentation that can be used to highlight the percentages of varied factors like turnover ratios, debt-equity ratios, and more. Download and use it innovatively.
Download Circle Donut Chart With Percentage Graph PowerPoint Slides
Template 18
This is another creative template that you can add to your product management presentation. Compare all your products to determine their performance, features, and loopholes. Download now!
Download Donut Pie Chart PPT Summary Rules
Template 19
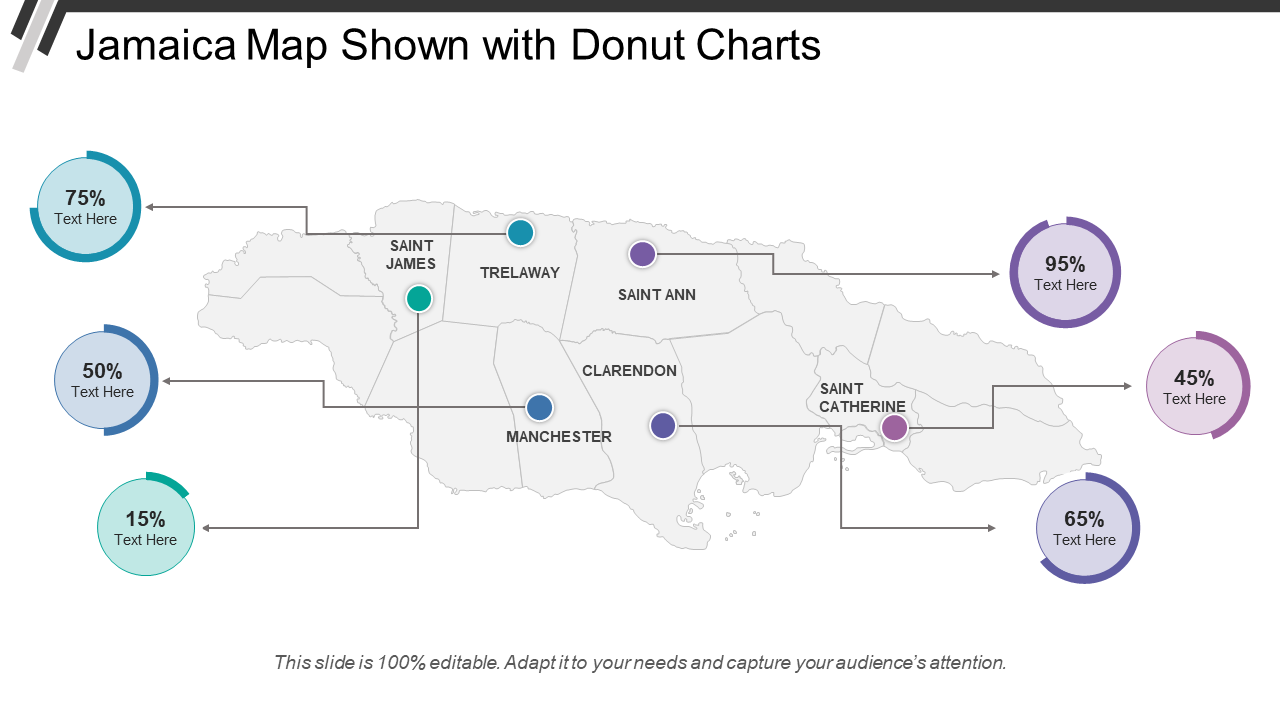
This template can be selected to share your company’s regional presence. You can highlight the respective data with the help of the donut charts given alongside the map. Download and replace the design with the outline of your country or city.
Download Jamaica Map Shown With Donut Charts
Template 20
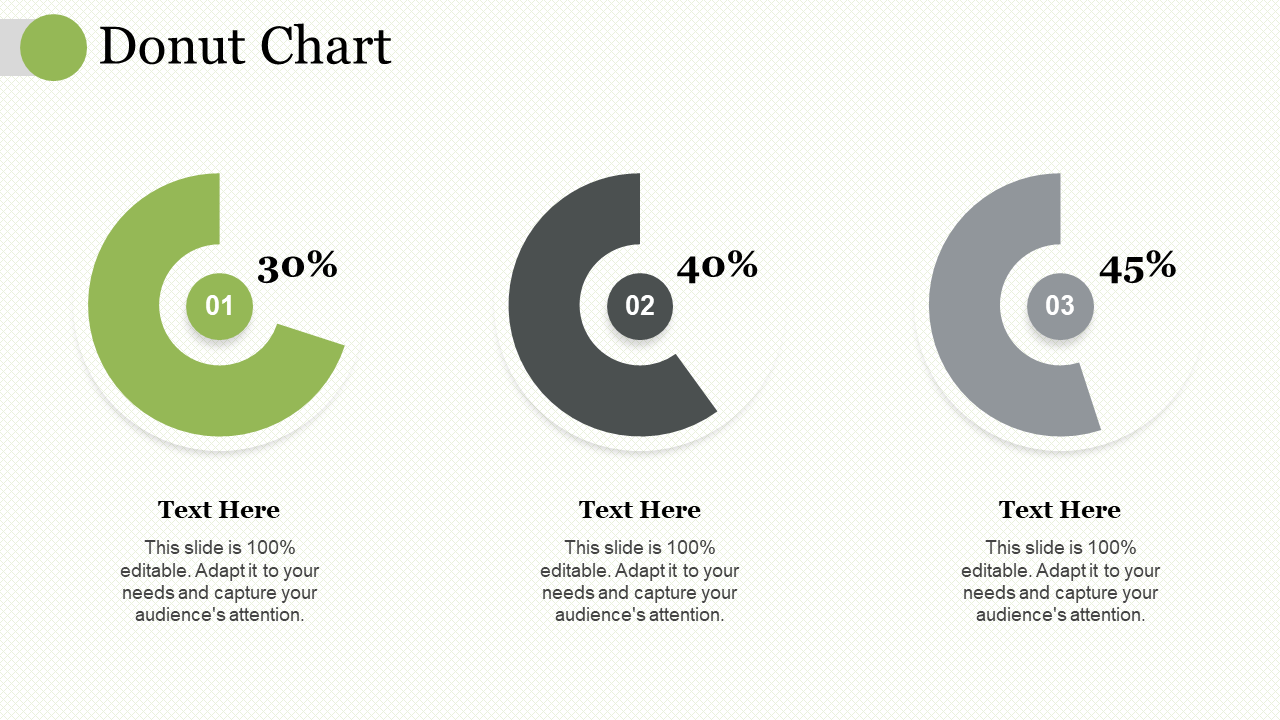
Use this template to compare any record, table, or database. A donut chart is a creative way to share analysis, so pick this design and incorporate it in your PPT.
Download Donut Chart PPT Portfolio Example Introduction
Template 21
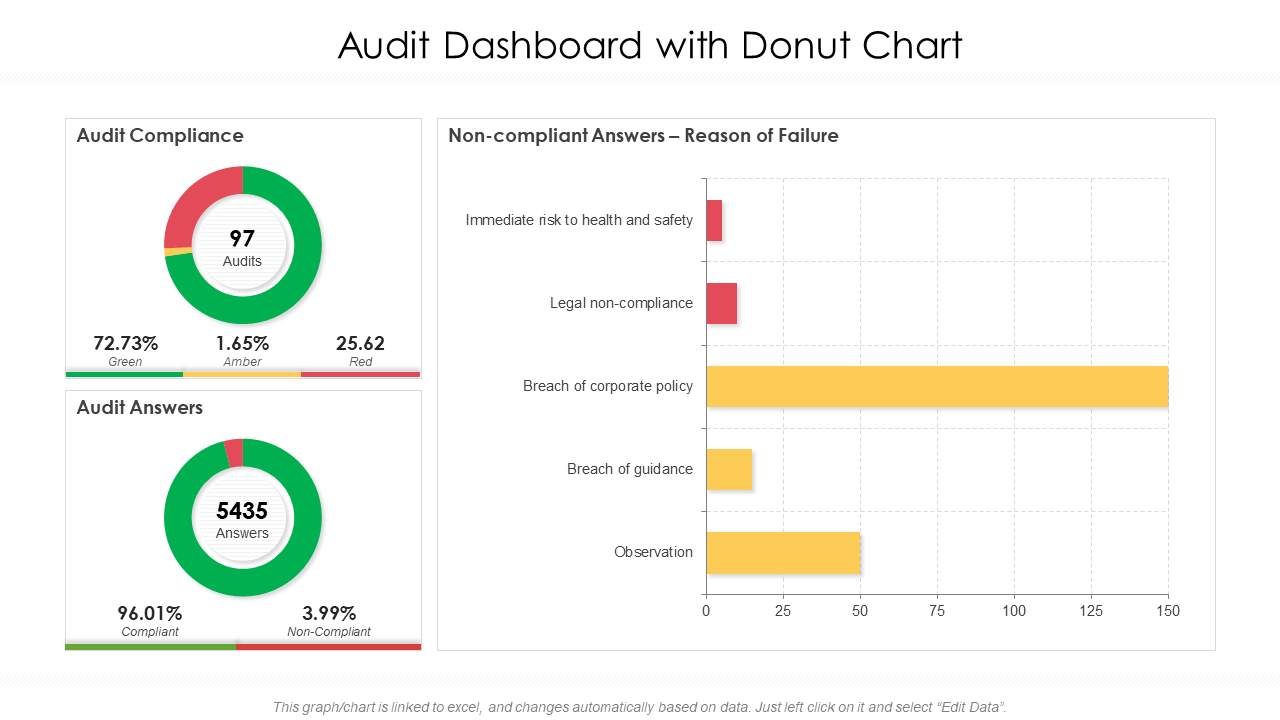
Get your head around the difficult data available with this dashboard template. Create a structured overview of your company’s most important performance indicators with the donut chart given in this template. Download once and use it multiple times.
Download Audit Dashboard With Donut Chart
Template 22
Research analysts can pick this template design to study the impact of a product on the market. Create a robust analysis report and share it with your marketing team. Download and edit it without any hassle.
Download Donut Chart PPT Sample File
Template 23
Study your consumer’s preference for a product over other similar ones in the market with this donut chart template design. Help your audience understand that a higher market share can increase your sales rapidly. So download and create a strong barrier for the competition.
Download Market Share Donut Chart Sales Graph
Template 24
Track your company’s relevant financial KPIs with this donut chart template. Create an error-free dashboard to measure expenses, sales, and profits for different departments. Download and establish a comparison.
Download Donut Pie Chart Finance PPT PowerPoint Presentation
Template 25
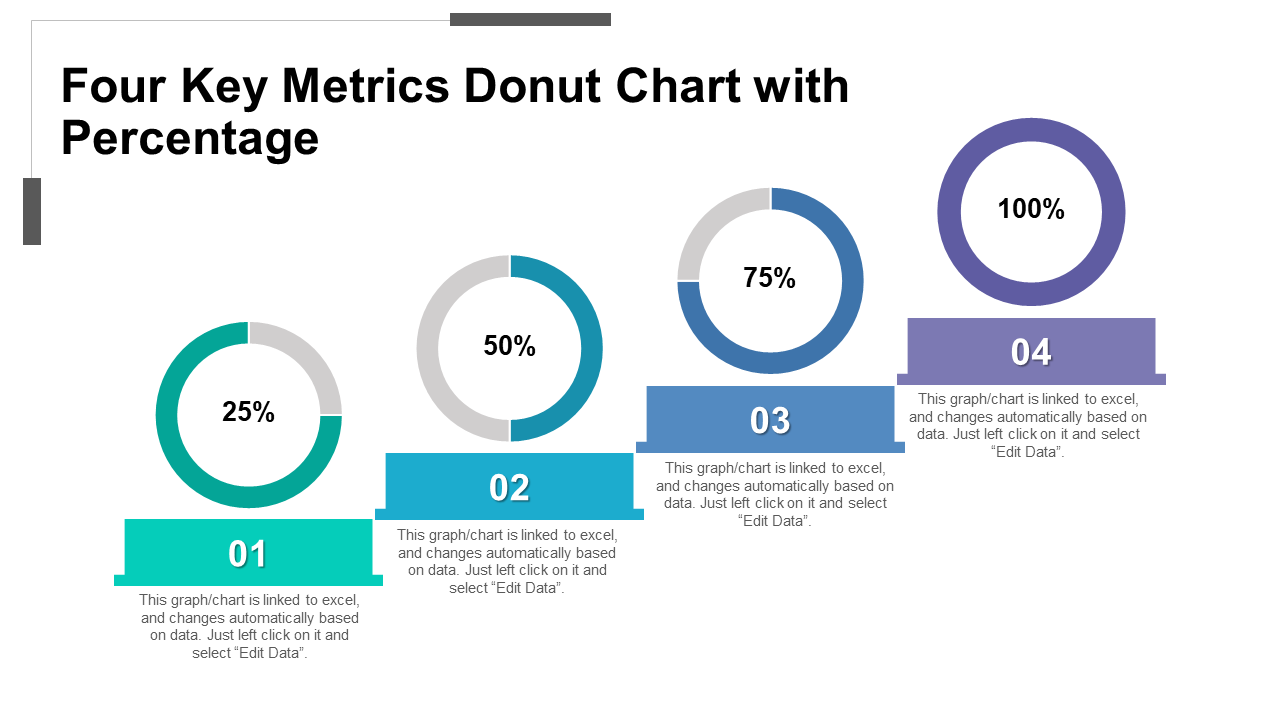
Measure your organization’s overall health and performance with this key metrics donut chart template. The design can be conveniently edited without any difficulty. So download and use it in PNG, JPG, and PDF format.
Download Four Key Metrics Donut Chart With Percentage
Template 26
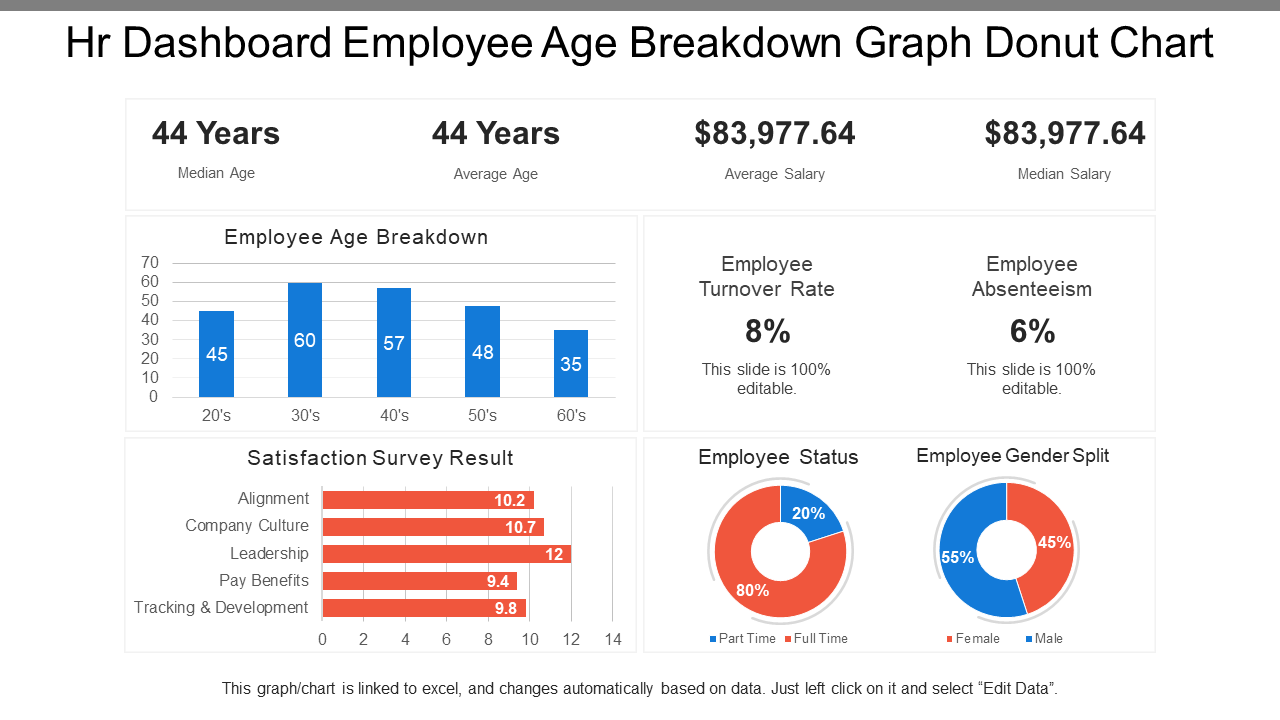
This is yet another well-researched donut chart design that can be added to your HR dashboard. Depict a comparison between the current and previous years’ turnover rate. Analyze the situation and share this template with your management or recruits.
Download HR Dashboard Employee Age Breakdown Graph Donut Chart
Template 27
Data presented with high-quality visuals can engage more audiences. Therefore, choose this donut chart template and support your data with it. Download and include in your presentation.
Download Donut Pie Chart PPT Visual Aids Gallery
Template 28
This is yet another template design that can be used to impart knowledge and bring some changes to the obsolete models. It includes a donut chart that can be conveniently customized. So grab it now!
Download Donut Chart Presentation Ideas
Template 29
Share any guidelines, their importance, and impact with this donut chart template. Not only this, but the design also is fully customizable and can be edited with quality information for your convenience.
Download Donut Pie Chart PPT Summary Guidelines
Template 30
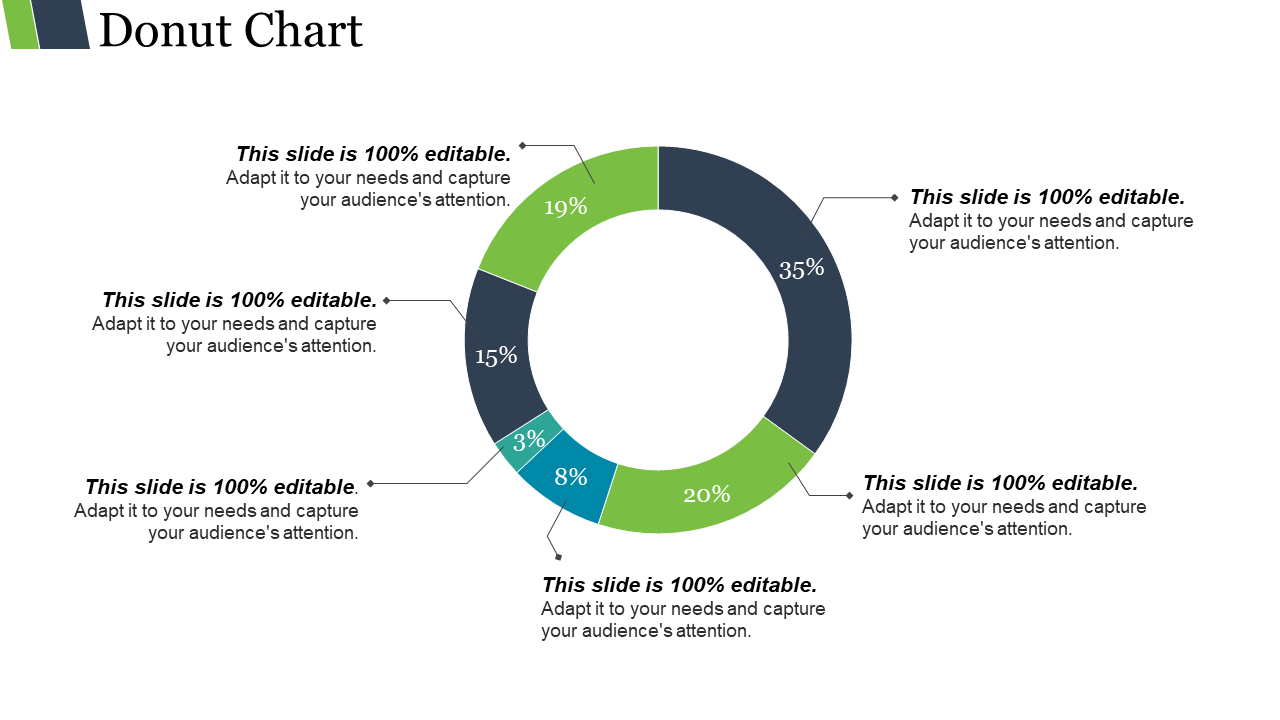
Compare the product features and capabilities across multiple product ranges with this template. The design presents the data with an attractive donut chart art. So download, edit, and share it easily.
Download Donut Pie Chart PPT PowerPoint Presentation
Wrapping up
These creative donut chart templates will add some variety to the bar charts and graphs on your business dashboard. Make it a staple for your company, stay compliant, represent your data cleverly, and satisfy both your customers and clients.
P.S: To solve crucial business problems and make predictions about your company’s health, status, and operational efficiency, check out our must-have statistical representation templates here.




 Customer Reviews











![[Updated 2023] Top 15 MoSCoW Method Templates to Prioritize Project Requirements](https://www.slideteam.net/wp/wp-content/uploads/2021/04/03_1013x441-4-493x215.png)

![[Updated 2023] Top 15 Product Differentiation Templates to Wipe Out Your Competition](https://www.slideteam.net/wp/wp-content/uploads/2021/05/04_1013x4410-493x215.png)


