Executing reporting kpi dashboard showing strategic initiatives and percentage growth by product
Align competencies with our Executing Reporting Kpi Dashboard Showing Strategic Initiatives And Percentage Growth By Product. Discard factors that hamper growth.
Align competencies with our Executing Reporting Kpi Dashboard Showing Strategic Initiatives And Percentage Growth By Produc..
- Google Slides is a new FREE Presentation software from Google.
- All our content is 100% compatible with Google Slides.
- Just download our designs, and upload them to Google Slides and they will work automatically.
- Amaze your audience with SlideTeam and Google Slides.
-
Want Changes to This PPT Slide? Check out our Presentation Design Services
- WideScreen Aspect ratio is becoming a very popular format. When you download this product, the downloaded ZIP will contain this product in both standard and widescreen format.
-

- Some older products that we have may only be in standard format, but they can easily be converted to widescreen.
- To do this, please open the SlideTeam product in Powerpoint, and go to
- Design ( On the top bar) -> Page Setup -> and select "On-screen Show (16:9)” in the drop down for "Slides Sized for".
- The slide or theme will change to widescreen, and all graphics will adjust automatically. You can similarly convert our content to any other desired screen aspect ratio.
Compatible With Google Slides

Get This In WideScreen
You must be logged in to download this presentation.
PowerPoint presentation slides
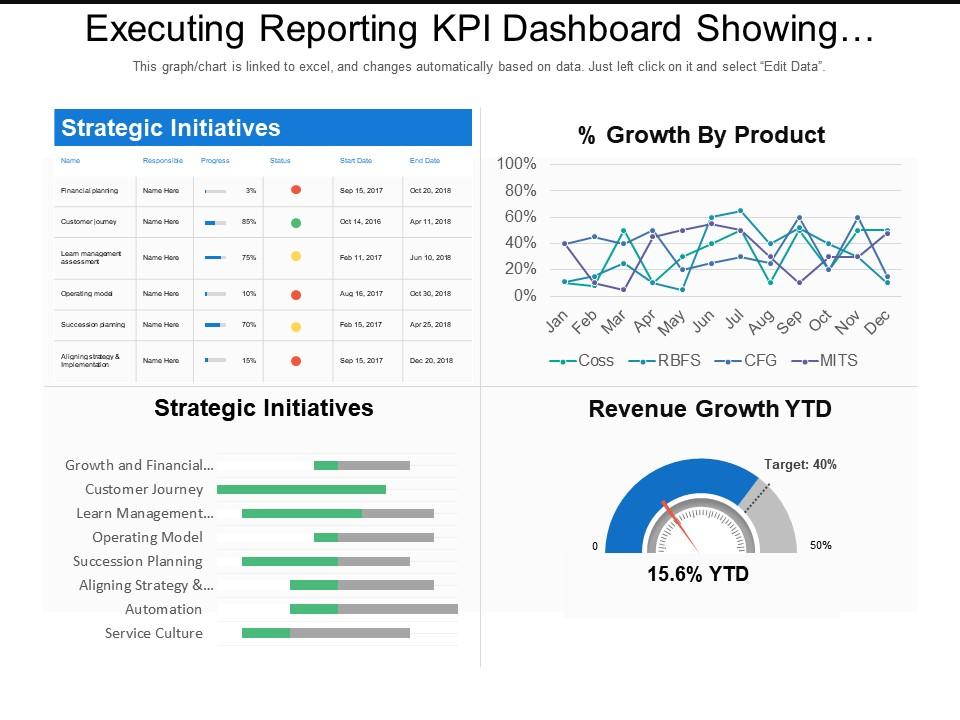
Presenting this set of slides with name - Executing Reporting Kpi Dashboard Showing Strategic Initiatives And Percentage Growth By Product. This is a four stage process. The stages in this process are Executive Reporting, Executive Analysis, Executive Performance.
People who downloaded this PowerPoint presentation also viewed the following :
Content of this Powerpoint Presentation
Description:
The image is a PowerPoint slide titled "Executing Reporting KPI Dashboard Showing..." likely used in business presentations to report on Key Performance Indicators (KPIs):
1. Upper Left Section:
It is titled "Strategic Initiatives," with a table listing initiatives, responsible persons, progress percentages, status indicators, and start/end dates.
2. Upper Right Section:
A line graph titled "% Growth By Product" with lines representing different products over 12 months.
3. Lower Left Section:
A bar graph labeled "Strategic Initiatives" displays progress in various business areas such as Customer Journey and Automation.
4. Lower Right Section:
A gauge chart titled "Revenue Growth YTD" indicates the Year-To-Date revenue growth against a target percentage.
Each element provides a visual representation of business performance metrics, and the slide notes it is linked to Excel for automatic updates.
Use Cases:
This type of slide is versatile and can be applied in many industries for performance tracking and strategy communication:
1. Financial Services:
Use: Tracking investment product growth.
Presenter: Finance Manager.
Audience: Investors, executive team.
2. Retail:
Use: Monitoring sales performance by product.
Presenter: Sales Director.
Audience: Sales teams, marketing department.
3. Healthcare:
Use: Reporting on healthcare service improvements.
Presenter: Healthcare Administrator.
Audience: Hospital staff, and stakeholders.
4. Technology:
Use: Measuring product development progress.
Presenter: Product Manager.
Audience: Development teams, investors.
5. Education:
Use: Assessing strategic initiatives in educational programs.
Presenter: Academic Dean.
Audience: Faculty, educational board.
6. Manufacturing:
Use: Displaying production and efficiency metrics.
Presenter: Operations Manager.
Audience: Production staff, management.
7. Real Estate:
Use: Analyzing property portfolio growth trends.
Presenter: Real Estate Analyst.
Audience: Brokers, property investors.
Executing reporting kpi dashboard showing strategic initiatives and percentage growth by product with all 6 slides:
Your audience will get dizzy with joy. Give them a round with ourr Executing Reporting Kpi Dashboard Showing Strategic Initiatives And Percentage Growth By Product.
-
Enough space for editing and adding your own content.
-
Innovative and attractive designs.


