Supply Chain KPI Dashboard, Excel PPT Templates
-
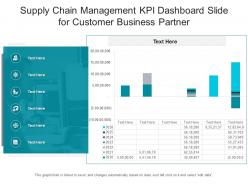 Supply chain management kpi dashboard slide for customer business partner powerpoint template
This Supply Chain Management Kpi Dashboard Slide For Customer Business Partner Powerpoint Template is designed using a data-driven approach to help you display important stats, figures, insights, and metrics related to the topic of your choice. You can also deploy this slide to present reports on a specific business project and strategy. It is tailor-made using a mix of KPIs that make the information easily understandable. Project managers, executives, or other department heads can grab this readily available PowerPoint presentation slide to present relevant information. It can be further used for monitoring and identifying various trends doing rounds in the industry of your choice. The biggest feature of this PowerPoint layout is that it is designed using vector-based and high-quality graphics that can be reproduced as PNGs, JPGs, and PDFs. It also works well with Google Slides and PowerPoint. Therefore, giving a lot of options to work with.
-
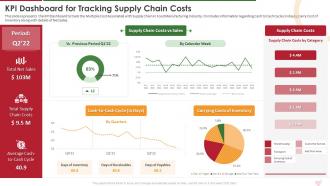 Kpi Dashboard For Tracking Supply Chain Costs Industry Report For Food Manufacturing Sector
This slide represents the KPI Dashboard to track the Multiple Cost Associated with Supply Chain in Food Manufacturing Industry. It includes information regarding Cash to Cash Cycle in days, Carry Cost of Inventory along with details of Net Sales. Present the topic in a bit more detail with this Kpi Dashboard For Tracking Supply Chain Costs Industry Report For Food Manufacturing Sector. Use it as a tool for discussion and navigation on Carrying Costs Of Inventory, Cash To Cash Cycle, Supply Chain Costs. This template is free to edit as deemed fit for your organization. Therefore download it now.
-
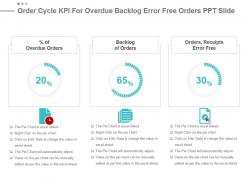 Order cycle kpi for overdue backlog error free orders ppt slide
Presenting order cycle kpi for overdue backlog error free orders ppt slide. This presentation slide shows three Key Performance Indicators or KPIs. The first KPI that can be show is percentage of Overdue Orders. The second KPI is Backlog of Orders and the third is Orders, Receipts Error Free. These KPI Powerpoint graphics are all data driven, and the shape automatically adjusts according to your data. Just right click on the KPI graphic, enter the right value and the shape will adjust automatically. Make a visual impact with our KPI slides.
-
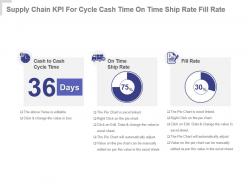 Supply chain kpi for cycle cash time on time ship rate fill rate powerpoint slide
Presenting supply chain kpi for cycle cash time on time ship rate fill rate powerpoint slide. This presentation slide shows three Key Performance Indicators or KPIs in a Dashboard style design. The first KPI that can be shown is Cash To Cash Cycle Time. The second KPI is On Time Ship Rate and the third is Fill Rate. These KPI Powerpoint graphics are all data driven, and the shape automatically adjusts according to your data. Just right click on the KPI graphic, enter the right value and the shape will adjust automatically. Make a visual impact with our KPI slides.
-
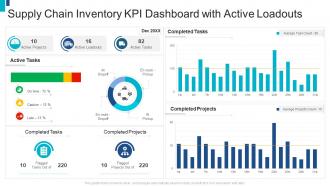 Supply chain inventory kpi dashboard with active loadouts
Introducing our Supply Chain Inventory KPI Dashboard With Active Loadouts set of slides. The topics discussed in these slides are Active Projects, Completed Tasks, Completed Projects. This is an immediately available PowerPoint presentation that can be conveniently customized. Download it and convince your audience.
-
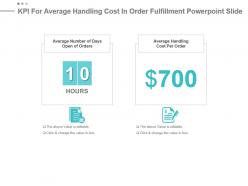 Kpi for average handling cost in order fulfillment powerpoint slide
Presenting kpi for average handling cost in order fulfillment powerpoint slide. This presentation slide shows two Key Performance Indicators or KPIs. The first KPI that can be show is Average Number of Days Open of Orders. The second KPI is Average Handling Cost Per Order. These KPI Powerpoint graphics are all data driven, and the shape automatically adjusts according to your data. Just right click on the KPI graphic, enter the right value and the shape will adjust automatically. Make a visual impact with our KPI slides.
-
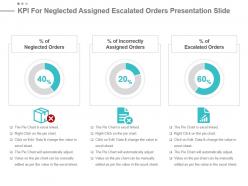 Kpi for neglected assigned escalated orders presentation slide
Presenting kpi for neglected assigned escalated orders presentation slide. This presentation slide shows three Key Performance Indicators or KPIs. The first KPI that can be show is percentage of Neglected Orders. The second KPI is percentage of Incorrectly Assigned Orders and the third is percentage of Escalated Orders. These KPI Powerpoint graphics are all data driven, and the shape automatically adjusts according to your data. Just right click on the KPI graphic, enter the right value and the shape will adjust automatically. Make a visual impact with our KPI slides.
-
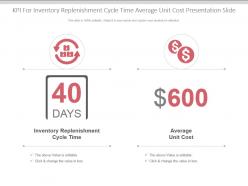 Kpi for inventory replenishment cycle time average unit cost presentation slide
Presenting kpi for inventory replenishment cycle time average unit cost presentation slide. This presentation slide shows two Key Performance Indicators or KPIs in a Dashboard style design. The first KPI that can be shown is Inventory Replenishment Cycle Time. The second KPI is Average Unit Cost. These KPI Powerpoint graphics are all data driven, and the shape automatically adjusts according to your data. Just right click on the KPI graphic, enter the right value and the shape will adjust automatically. Make a visual impact with our KPI slides.
-
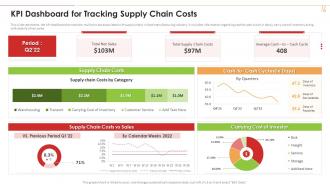 Kpi Dashboard For Tracking Supply Chain Costs Industry 4 0 Application Production
This slide represents the KPI dashboard to track the multiple cost associated with supply chain in food manufacturing industry. It includes information regarding cash to cash cycle in days, carry cost of inventory along with details of net sales. Deliver an outstanding presentation on the topic using this Kpi Dashboard For Tracking Supply Chain Costs Industry 4 0 Application Production. Dispense information and present a thorough explanation of KPI Dashboard For Tracking Supply Chain Costs using the slides given. This template can be altered and personalized to fit your needs. It is also available for immediate download. So grab it now.
-
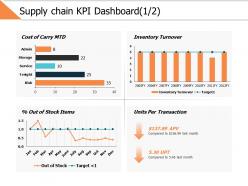 Supply chain kpi dashboard 1 2 ppt powerpoint presentation gallery slides
Presenting this set of slides with name - Supply Chain Kpi Dashboard 1 2 Ppt Powerpoint Presentation Gallery Slides. This is a four stage process. The stages in this process are Business, Management, Strategy, Analysis, Finance.
-
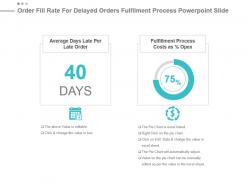 Order fill rate for delayed orders fulfilment process powerpoint slide
Presenting order fill rate for delayed orders fulfilment process powerpoint slide. This presentation slide shows two Key Performance Indicators or KPIs. The first KPI that can be show is Average Days Late Per Late Order. The second KPI is Fulfillment Process Costs as percentage Opex. These KPI Powerpoint graphics are all data driven, and the shape automatically adjusts according to your data. Just right click on the KPI graphic, enter the right value and the shape will adjust automatically. Make a visual impact with our KPI slides.
-
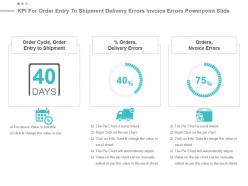 Kpi for order entry to shipment delivery errors invoice errors powerpoint slide
Presenting kpi for order entry to shipment delivery errors invoice errors powerpoint slide. This presentation slide shows three Key Performance Indicators or KPIs. The first KPI that can be show is Order Cycle, Order Entry to Shipment. The second KPI is percentage Orders, Delivery Errors and the third is Orders, Nvoice Errors. These KPI Powerpoint graphics are all data driven, and the shape automatically adjusts according to your data. Just right click on the KPI graphic, enter the right value and the shape will adjust automatically. Make a visual impact with our KPI slides.
-
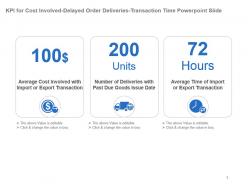 Kpi for cost involved delayed order deliveries transaction time powerpoint slide
Presenting kpi for cost involved delayed order deliveries transaction time powerpoint slide. This presentation slide shows three Key Performance Indicators or KPIs in a Dashboard style design. The first KPI that can be shown is Average Cost Involved with Import or Export Transaction. The second KPI is Number of Deliveries with Past Due Goods Issue Date and the third is Average Time of Import or Export Transaction. These KPI Powerpoint graphics are all data driven, and the shape automatically adjusts according to your data. Just right click on the KPI graphic, enter the right value and the shape will adjust automatically. Make a visual impact with our KPI slides.
-
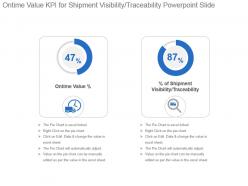 Ontime value kpi for shipment visibility traceability powerpoint slide
Presenting ontime value kpi for shipment visibility traceability powerpoint slide. This presentation slide shows two Key Performance Indicators or KPIs in a Dashboard style design. The first KPI that can be shown is Ontime Value percentage. The second KPI is percentage of Shipment Visibility Traceability. These KPI Powerpoint graphics are all data driven, and the shape automatically adjusts according to your data. Just right click on the KPI graphic, enter the right value and the shape will adjust automatically. Make a visual impact with our KPI slides.
-
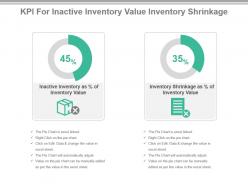 Kpi for inactive inventory value inventory shrinkage ppt slide
Presenting kpi for inactive inventory value inventory shrinkage ppt slide. This presentation slide shows Two Key Performance Indicators or KPIs in a Dashboard style design. The first KPI that can be shown is Inactive Inventory as Percentage of Inventory Value. The second KPI is Inventory Shrinkage as Percentage of Inventory Value. These KPI Powerpoint graphics are all data driven, and the shape automatically adjusts according to your data. Just right click on the KPI graphic, enter the right value and the shape will adjust automatically. Make a visual impact with our KPI slides.
-
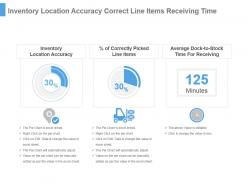 Inventory location accuracy correct line items receiving time ppt slide
Presenting inventory location accuracy correct line items receiving time ppt slide. This presentation slide shows Three Key Performance Indicators or KPIs in a Dashboard style design. The first KPI that can be shown is Inventory Location Accuracy. The second KPI is Percentage of Correctly Picked Line Items. The third is Average Dock to Stock Time For Receiving. These KPI Powerpoint graphics are all data driven, and the shape automatically adjusts according to your data. Just right click on the KPI graphic, enter the right value and the shape will adjust automatically. Make a visual impact with our KPI slides.
-
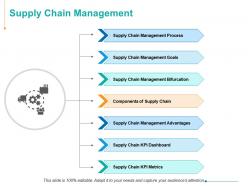 Supply chain management process goals ppt powerpoint presentation ideas
Presenting this set of slides with name Supply Chain Management Process Goals Ppt Powerpoint Presentation Ideas. This is a seven stage process. The stages in this process are Supply Chain Management, Supply Chain KPI Dashboard, Supply Chain KPI Metrics, Supply Chain Management Goals, Supply Chain Management Advantages. This is a completely editable PowerPoint presentation and is available for immediate download. Download now and impress your audience.
-
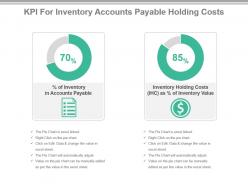 Kpi for inventory accounts payable holding costs powerpoint slide
Presenting kpi for inventory accounts payable holding costs powerpoint slide. This presentation slide shows Two Key Performance Indicators or KPIs in a Dashboard style design. The first KPI that can be shown is Percentage of Inventory in Accounts Payable. The second KPI is Inventory Holding Costs or IHC as Percentage of Inventory Value. These KPI Powerpoint graphics are all data driven, and the shape automatically adjusts according to your data. Just right click on the KPI graphic, enter the right value and the shape will adjust automatically. Make a visual impact with our KPI slides.
-
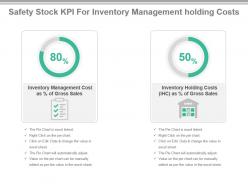 Safety stock kpi for inventory management holding costs presentation slide
Presenting safety stock kpi for inventory management holding costs presentation slide. This presentation slide shows Two Key Performance Indicators or KPIs in a Dashboard style design. The first KPI that can be shown is Inventory Management Cost as Percentage of Gross Sales. The second KPI is Inventory Holding Costs or IHC as Percentage of Gross Sales. These KPI Powerpoint graphics are all data driven, and the shape automatically adjusts according to your data. Just right click on the KPI graphic, enter the right value and the shape will adjust automatically. Make a visual impact with our KPI slides.
-
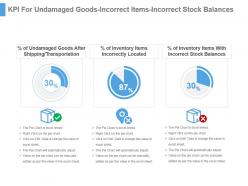 Kpi for undamaged goods incorrect items incorrect stock balances ppt slide
Presenting kpi for undamaged goods incorrect items incorrect stock balances ppt slide. This presentation slide shows Three Key Performance Indicators or KPIs in a Dashboard style design. The first KPI that can be shown is Percentage of Undamaged Goods After Shipping Transportation. The second KPI is Percentage of Inventory Items Incorrectly Located. The third is Percentage of Inventory Items With Incorrect Stock Balances. These KPI Powerpoint graphics are all data driven, and the shape automatically adjusts according to your data. Just right click on the KPI graphic, enter the right value and the shape will adjust automatically. Make a visual impact with our KPI slides.
-
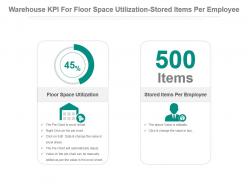 Warehouse kpi for floor space utilization stored items per employee presentation slide
Presenting warehouse kpi for floor space utilization stored items per employee presentation slide. This presentation slide shows Two Key Performance Indicators or KPIs in a Dashboard style design. The first KPI that can be shown is Floor Space Utilization. The second KPI is Stored Items Per Employee. These KPI Powerpoint graphics are all data driven, and the shape automatically adjusts according to your data. Just right click on the KPI graphic, enter the right value and the shape will adjust automatically. Make a visual impact with our KPI slides.
-
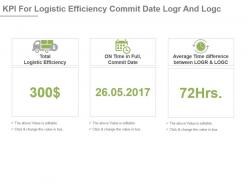 Kpi for logistic efficiency commit date logr and logc powerpoint slide
Presenting kpi for logistic efficiency commit date logr and logc powerpoint slide. This presentation slide shows Three Key Performance Indicators or KPIs in a Dashboard style design. The first KPI that can be shown is Total Logistic Efficiency. The second KPI is ON Time in Full, Commit Date. The third is Average Time difference between LOGR and LOGC. These KPI Powerpoint graphics are all data driven, and the shape automatically adjusts according to your data. Just right click on the KPI graphic, enter the right value and the shape will adjust automatically. Make a visual impact with our KPI slides.
-
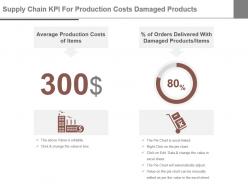 Supply chain kpi for production costs damaged products ppt slide
Presenting supply chain kpi for production costs damaged products ppt slide. This presentation slide shows two Key Performance Indicators or KPIs in a Dashboard style design. The first KPI that can be shown is Average Production Costs of Items. The second KPI is percentage of Orders Delivered With Damaged Products Items. These KPI Powerpoint graphics are all data driven, and the shape automatically adjusts according to your data. Just right click on the KPI graphic, enter the right value and the shape will adjust automatically. Make a visual impact with our KPI slides.
-
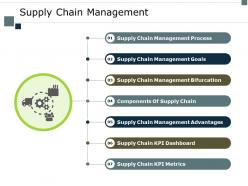 Supply chain management goals ppt powerpoint presentation ideas background image
Presenting this set of slides with name Supply Chain Management Goals Ppt Powerpoint Presentation Ideas Background Image. This is a seven stage process. The stages in this process are Supply Chain Management Process, Supply Chain Management Goals, Components Of Supply Chain, Supply Chain Kpi Dashboard, Supply Chain Kpi Metrics. This is a completely editable PowerPoint presentation and is available for immediate download. Download now and impress your audience.
-
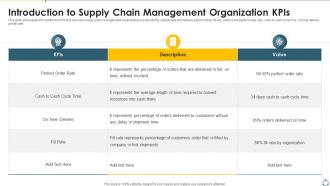 Introduction To Supply Chain Management Organization KPIs
This slide showcases introduction to KPIs that can help supply chain management organization to evaluate the operational and delivery performance. Its key metrics are perfect order rate, cash to cash cycle time, on time delivery and fill rate. Presenting our well structured Introduction To Supply Chain Management Organization KPIs. The topics discussed in this slide are KPIs, Value, Perfect Order Rate, On Time Delivery, Cash To Cash Cycle Time. This is an instantly available PowerPoint presentation that can be edited conveniently. Download it right away and captivate your audience.
-
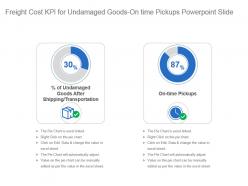 Freight cost kpi for undamaged goods on time pickups powerpoint slide
Presenting freight cost kpi for undamaged goods on time pickups powerpoint slide. This presentation slide shows two Key Performance Indicators or KPIs in a Dashboard style design. The first KPI that can be shown is percentage of Undamaged Goods After Shipping Transportation. The second KPI is On time Pickups. These KPI Powerpoint graphics are all data driven, and the shape automatically adjusts according to your data. Just right click on the KPI graphic, enter the right value and the shape will adjust automatically. Make a visual impact with our KPI slides.
-
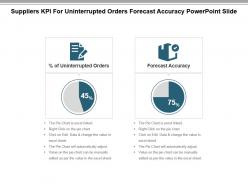 Suppliers kpi for uninterrupted orders forecast accuracy powerpoint slide
Presenting suppliers kpi for uninterrupted orders forecast accuracy powerpoint slide. This presentation slide shows two Key Performance Indicators or KPIs in a Dashboard style design. The first KPI that can be shown is Percentage of Uninterrupted Orders. The second KPI is Forecast Accuracy. These KPI Powerpoint graphics are all data driven, and the shape automatically adjusts according to your data. Just right click on the KPI graphic, enter the right value and the shape will adjust automatically. Make a visual impact with our KPI slides.
-
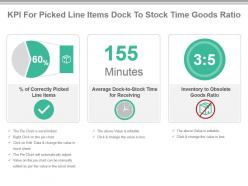 Kpi for picked line items dock to stock time goods ratio powerpoint slide
Presenting kpi for picked line items dock to stock time goods ratio powerpoint slide. This presentation slide shows Three Key Performance Indicators or KPIs in a Dashboard style design. The first KPI that can be shown is Percentage of Correctly Picked Line Items. The second KPI is Average Dock to Stock Time for Receiving. The third is Inventory to Obsolete Goods Ratio. These KPI Powerpoint graphics are all data driven, and the shape automatically adjusts according to your data. Just right click on the KPI graphic, enter the right value and the shape will adjust automatically. Make a visual impact with our KPI slides.
-
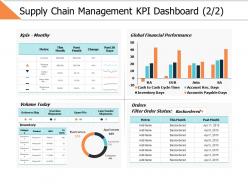 Supply chain management kpi dashboard 2 2 ppt powerpoint presentation gallery visuals
Presenting this set of slides with name - Supply Chain Management Kpi Dashboard 2 2 Ppt Powerpoint Presentation Gallery Visuals. This is a two stage process. The stages in this process are Business, Management, Strategy, Analysis, Finance.
-
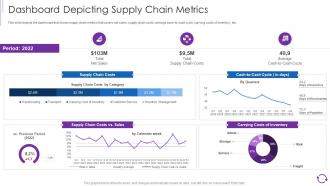 Reducing Cost Of Operations Through Iot And Dashboard Depicting Supply Chain Metrics
This slide depicts the dashboard that shows supply chain metrics that covers net sales, supply chain costs, average cash-to-cash cycle, carrying costs of inventory, etc. Deliver an outstanding presentation on the topic using this Reducing Cost Of Operations Through Iot And Dashboard Depicting Supply Chain Metrics. Dispense information and present a thorough explanation of Dashboard Depicting Supply Chain Metrics using the slides given. This template can be altered and personalized to fit your needs. It is also available for immediate download. So grab it now.
-
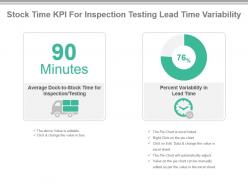 Stock time kpi for inspection testing lead time variability powerpoint slide
Presenting stock time kpi for inspection testing lead time variability powerpoint slide. This presentation slide shows Two Key Performance Indicators or KPIs in a Dashboard style design. The first KPI that can be shown is Average Dock to Stock Time for Inspection Testing. The second KPI is Percent Variability in Lead Time. These KPI Powerpoint graphics are all data driven, and the shape automatically adjusts according to your data. Just right click on the KPI graphic, enter the right value and the shape will adjust automatically. Make a visual impact with our KPI slides.
-
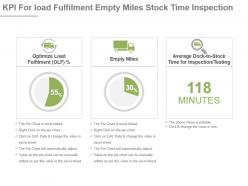 Kpi for load fulfilment empty miles stock time inspection ppt slide
Presenting kpi for load fulfilment empty miles stock time inspection ppt slide. This presentation slide shows Three Key Performance Indicators or KPIs in a Dashboard style design. The first KPI that can be shown is Optimize Load Fulfilment or OLF Percentage. The second KPI is Empty Miles. The third is Average Dock to Stock Time for Inspection Testing. These KPI Powerpoint graphics are all data driven, and the shape automatically adjusts according to your data. Just right click on the KPI graphic, enter the right value and the shape will adjust automatically. Make a visual impact with our KPI slides.
-
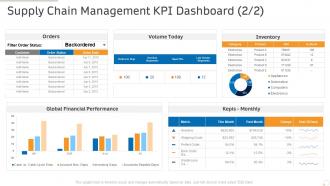 Supply chain management kpi dashboard production management ppt outline pictures
Present the topic in a bit more detail with this Supply Chain Management KPI Dashboard Production Management Ppt Outline Pictures. Use it as a tool for discussion and navigation on Global, Financial, Performance, Inventory. This template is free to edit as deemed fit for your organization. Therefore download it now.
-
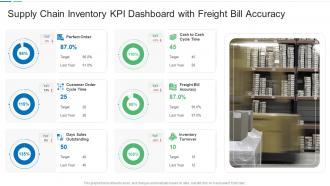 Supply chain inventory kpi dashboard with freight bill accuracy
Presenting our well-structured Supply Chain Inventory KPI Dashboard With Freight Bill Accuracy. The topics discussed in this slide are Supply Chain Inventory KPI Dashboard With Freight Bill Accuracy. This is an instantly available PowerPoint presentation that can be edited conveniently. Download it right away and captivate your audience.
-
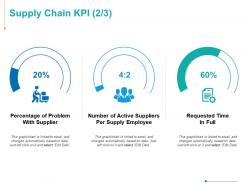 Supply chain kpi investment ppt powerpoint presentation infographics gridlines
Presenting this set of slides with name - Supply Chain KPI Investment Ppt Powerpoint Presentation Infographics Gridlines. This is a three stage process. The stages in this process are Finance, Analysis, Business, Investment, Marketing.
-
 Supply chain management kpi dashboard slide for candidate interview experience powerpoint template
This is a Supply Chain Management Kpi Dashboard Slide For Candidate Interview Experience Powerpoint Template that you can use to present real-time information about your business. With a variety of graphical representations that are in-line with the current trends, this is a great way to display quantified data and stats. This is also a great PowerPoint slide to make informed decisions based on the data and results depicted. Since this template can accommodate a lot of statistical information in one-go it can be put to use by different department heads of the organization. This PPT slide can also be used to present a thorough discussion on various KPIs, all excel-linked and susceptible to innumerable changes. Thus helping in the portrayal of calculative data in a highly professional format. Not only this, but it can also be reproduced in JPG, PNG, and PDF formats. Therefore, reinvent the wheel by downloading this PPT slide now.
-
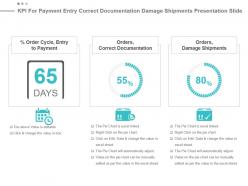 Kpi for payment entry correct documentation damage shipments presentation slide
Presenting kpi for payment entry correct documentation damage shipments presentation slide. This presentation slide shows three Key Performance Indicators or KPIs. The first KPI that can be show is percentage Order Cycle, Entry to Payment. The second KPI is Orders, Correct Documentation and the third is Orders, Damage Shipments. These KPI Powerpoint graphics are all data driven, and the shape automatically adjusts according to your data. Just right click on the KPI graphic, enter the right value and the shape will adjust automatically. Make a visual impact with our KPI slides.
-
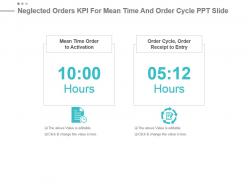 Neglected orders kpi for mean time and order cycle ppt slide
Presenting neglected orders kpi for mean time and order cycle ppt slide. This presentation slide shows two Key Performance Indicators or KPIs. The first KPI that can be show is Mean Time Order to Activation. The second KPI is Order Cycle, Order Receipt to Entry. These KPI Powerpoint graphics are all data driven, and the shape automatically adjusts according to your data. Just right click on the KPI graphic, enter the right value and the shape will adjust automatically. Make a visual impact with our KPI slides.
-
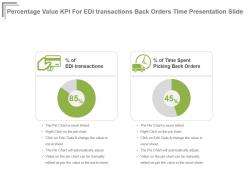 Percentage value kpi for edi transactions back orders time presentation slide
Presenting percentage value kpi for edi transactions back orders time presentation slide. This presentation slide shows two Key Performance Indicators or KPIs in a Dashboard style design. The first KPI that can be shown is percentage of EDI transactions. The second KPI is percentage of Time Spent Picking Back Orders. These KPI Powerpoint graphics are all data driven, and the shape automatically adjusts according to your data. Just right click on the KPI graphic, enter the right value and the shape will adjust automatically. Make a visual impact with our KPI slides.
-
 Kpi for stock available stock controlled skus ppt slide
Presenting kpi for stock available stock controlled skus ppt slide. This presentation slide shows Two Key Performance Indicators or KPIs in a Dashboard style design. The first KPI that can be shown is Percentage of Stock Available at Customers First Request. The second KPI is Percentage of Stock Controlled SKUs. These KPI Powerpoint graphics are all data driven, and the shape automatically adjusts according to your data. Just right click on the KPI graphic, enter the right value and the shape will adjust automatically. Make a visual impact with our KPI slides.
-
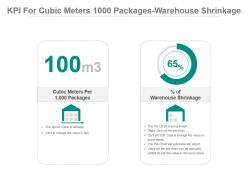 Kpi for cubic meters 1000 packages warehouse shrinkage percentage powerpoint slide
Presenting kpi for cubic meters 1000 packages warehouse shrinkage percentage powerpoint slide. This presentation slide shows Two Key Performance Indicators or KPIs in a Dashboard style design. The first KPI that can be shown is Cubic Meters Per 1,000 Packages. The second KPI is Percentage of Warehouse Shrinkage. These KPI Powerpoint graphics are all data driven, and the shape automatically adjusts according to your data. Just right click on the KPI graphic, enter the right value and the shape will adjust automatically. Make a visual impact with our KPI slides.
-
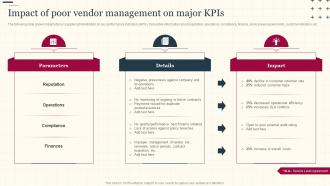 Impact Of Poor Vendor Management On Major KPIs Increasing Supply Chain Value
The following slide shows impact of poor supplier administration on key performance indicators KPIs. It provides information about reputation, operations, compliance, finance, service level agreements, customer retention, etc. Increase audience engagement and knowledge by dispensing information using Impact Of Poor Vendor Management On Major KPIs Increasing Supply Chain Value. This template helps you present information on three stages. You can also present information on Parameters, Reputation, Operations, Finances using this PPT design. This layout is completely editable so personaize it now to meet your audiences expectations.
-
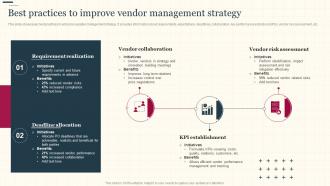 Increasing Supply Chain Value Best Practices To Improve Vendor Management Strategy
This slide showcases best practices to enhance supplier management strategy. It provides information about requirements, expectations, deadlines, collaboration, key performance indicators KPIs, vendor risk assessment, etc. Introducing Increasing Supply Chain Value Best Practices To Improve Vendor Management Strategy to increase your presentation threshold. Encompassed with three stages, this template is a great option to educate and entice your audience. Dispence information on Vendor Collaboration, Vendor Risk Assessment, KPI Establishment, using this template. Grab it now to reap its full benefits.
-
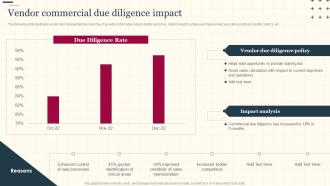 Increasing Supply Chain Value Vendor Commercial Due Diligence Impact
The following slide illustrates vendor risk management process flow. It provides information about identify outcomes, data to insight, continuous improvement, execution practices, identify metrics, etc. Present the topic in a bit more detail with this Increasing Supply Chain Value Vendor Commercial Due Diligence Impact. Use it as a tool for discussion and navigation on Due Diligence Rate, Sale Processes, Sales Memorandum. This template is free to edit as deemed fit for your organization. Therefore download it now.
-
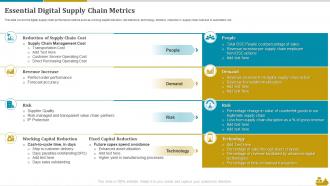 Essential Digital Supply Chain Metrics Shipping And Logistics Ppt File Infographics
This slide covers the digital supply chain performance metrics such as working capital reduction, risk tolerance, technology, demand, reduction in supply chain cost due to automation etc. Introducing Essential Digital Supply Chain Metrics Shipping And Logistics Ppt File Infographics to increase your presentation threshold. Encompassed with four stages, this template is a great option to educate and entice your audience. Dispence information on Reduction Of Supply Chain Cost, Working Capital Reduction, Fixed Capital Reduction, using this template. Grab it now to reap its full benefits.
-
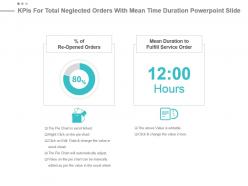 Kpis for total neglected orders with mean time duration powerpoint slide
Presenting kpis for total neglected orders with mean time duration powerpoint slide. This presentation slide shows two Key Performance Indicators or KPIs. The first KPI that can be show is percentage of Re Opened Orders . The second KPI is Mean Duration to Fulfill Service Order. These KPI Powerpoint graphics are all data driven, and the shape automatically adjusts according to your data. Just right click on the KPI graphic, enter the right value and the shape will adjust automatically. Make a visual impact with our KPI slides.
-
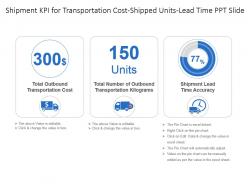 Shipment kpi for transportation cost shipped units lead time ppt slide
Presenting shipment kpi for transportation cost shipped units lead time ppt slide. This presentation slide shows three Key Performance Indicators or KPIs in a Dashboard style design. The first KPI that can be shown is Total Outbound Transportation Cost. The second KPI is Total Number of Outbound Transportation Kilograms and the third is Shipment Lead Time Accuracy. These KPI Powerpoint graphics are all data driven, and the shape automatically adjusts according to your data. Just right click on the KPI graphic, enter the right value and the shape will adjust automatically. Make a visual impact with our KPI slides.
-
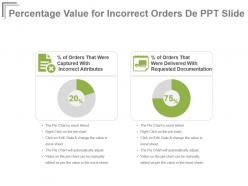 Percentage value for incorrect orders de ppt slide
Presenting percentage value for incorrect orders de ppt slide. This presentation slide shows two Key Performance Indicators or KPIs in a Dashboard style design. The first KPI that can be shown is percentage of Orders That Were Captured With Incorrect Attributes. The second KPI is percentage of Orders That Were Delivered With Requested Documentation. These KPI Powerpoint graphics are all data driven, and the shape automatically adjusts according to your data. Just right click on the KPI graphic, enter the right value and the shape will adjust automatically. Make a visual impact with our KPI slides.
-
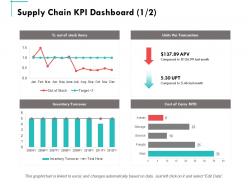 Supply chain kpi dashboard management ppt powerpoint presentation summary graphics tutorials
Presenting this set of slides with name - Supply Chain Kpi Dashboard Management Ppt Powerpoint Presentation Summary Graphics Tutorials. This is a four stages process. The stages in this process are Finance, Marketing, Management, Investment, Analysis.
-
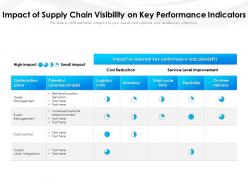 Impact of supply chain visibility on key performance indicators
Presenting this set of slides with name Impact Of Supply Chain Visibility On Key Performance Indicators. The topics discussed in these slides are Service Level Improvement, Cost Reduction, Optimization Areas, Logistics Costs, Inventory. This is a completely editable PowerPoint presentation and is available for immediate download. Download now and impress your audience.
-
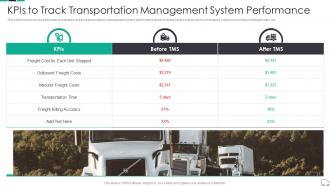 Kpis To Track Transportation Management System Continuous Process Improvement In Supply Chain
This slide focuses on key performance indicators to track transportation management system performance which includes freight cost for each unit shipped, outbound and inbound freight costs, etc. Present the topic in a bit more detail with this Kpis To Track Transportation Management System Continuous Process Improvement In Supply Chain. Use it as a tool for discussion and navigation on Transportation, Management, Performance. This template is free to edit as deemed fit for your organization. Therefore download it now.
-
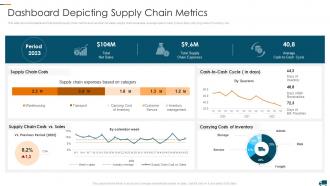 Dashboard Depicting Supply Chain Metrics Understanding Different Supply Chain Models
This slide shows the dashboard that depicts supply chain metrics such as total net sales, supply chain expenses, average cash to cash cycle in days, carrying costs of inventory, etc. Deliver an outstanding presentation on the topic using this Dashboard Depicting Supply Chain Metrics Understanding Different Supply Chain Models. Dispense information and present a thorough explanation of Carrying Costs Inventory, Supply Chain Expenses, Dashboard Depicting using the slides given. This template can be altered and personalized to fit your needs. It is also available for immediate download. So grab it now.
-
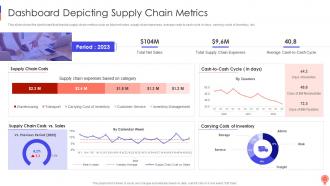 Dashboard Depicting Supply Chain Metrics Logistics Optimization Models
This slide shows the dashboard that depicts supply chain metrics such as total net sales, supply chain expenses, average cash to cash cycle in days, carrying costs of inventory, etc. Deliver an outstanding presentation on the topic using this Dashboard Depicting Supply Chain Metrics Logistics Optimization Models. Dispense information and present a thorough explanation of Inventory Management, Customer Service, Transport, Warehousing using the slides given. This template can be altered and personalized to fit your needs. It is also available for immediate download. So grab it now.
-
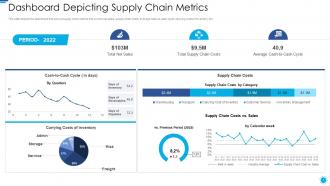 Role of digital twin and iot dashboard depicting supply chain metrics
This slide depicts the dashboard that shows supply chain metrics that covers net sales, supply chain costs, average cash to cash cycle, carrying costs of inventory, etc. Present the topic in a bit more detail with this Role Of Digital Twin And Iot Dashboard Depicting Supply Chain Metrics. Use it as a tool for discussion and navigation on Dashboard Depicting Supply Chain Metrics. This template is free to edit as deemed fit for your organization. Therefore download it now.
-
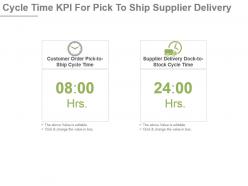 Cycle time kpi for pick to ship supplier delivery ppt slide
Presenting cycle time kpi for pick to ship supplier delivery ppt slide. This presentation slide shows Two Key Performance Indicators or KPIs in a Dashboard style design. The first KPI that can be shown is Customer Order Pick to Ship Cycle Time. The second KPI is Supplier Delivery Dock to Stock Cycle Time. These KPI Powerpoint graphics are all data driven, and the shape automatically adjusts according to your data. Just right click on the KPI graphic, enter the right value and the shape will adjust automatically. Make a visual impact with our KPI slides.
-
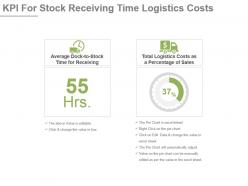 Kpi for stock receiving time logistics costs presentation slide
Presenting kpi for stock receiving time logistics costs presentation slide. This presentation slide shows Two Key Performance Indicators or KPIs in a Dashboard style design. The first KPI that can be shown is Average Dock to Stock Time for Receiving. The second KPI is Total Logistics Costs as a Percentage of Sales. These KPI Powerpoint graphics are all data driven, and the shape automatically adjusts according to your data. Just right click on the KPI graphic, enter the right value and the shape will adjust automatically. Make a visual impact with our KPI slides.
-
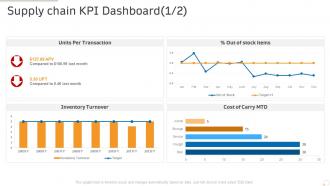 Supply chain kpi dashboard production management ppt powerpoint presentation model rules
Present the topic in a bit more detail with this Supply Chain KPI Dashboard Production Management Ppt Powerpoint Presentation Model Rules. Use it as a tool for discussion and navigation on Inventory Turnover, Cost, Units Per Transaction, Stock Items. This template is free to edit as deemed fit for your organization. Therefore download it now.
-
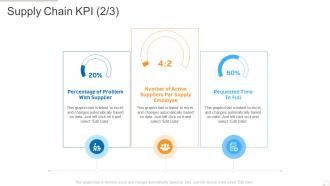 Supply chain kpi production management ppt powerpoint presentation infographics
Present the topic in a bit more detail with this Supply Chain KPI Production Management Ppt Powerpoint Presentation Infographics. Use it as a tool for discussion and navigation on Percentage Of Problem With Supplier, Number Of Active Suppliers Per Supply Employee, Requested Time In Full. This template is free to edit as deemed fit for your organization. Therefore download it now.
-
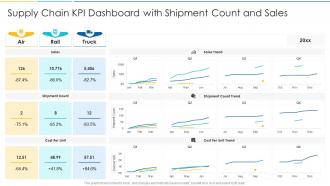 Supply chain kpi dashboard with shipment count and sales
Introducing our Supply Chain KPI Dashboard With Shipment Count And Sales set of slides. The topics discussed in these slides are Supply Chain KPI Dashboard With Shipment Count And Sales. This is an immediately available PowerPoint presentation that can be conveniently customized. Download it and convince your audience.
-
 Supply chain manager analysing kpi dashboard
Presenting our set of slides with Supply Chain Manager Analysing KPI Dashboard. This exhibits information on three stages of the process. This is an easy-to-edit and innovatively designed PowerPoint template. So download immediately and highlight information on Supply Chain Manager Analysing KPI Dashboard.


