Transportation, Airline KPI Dashboard PowerPoint Templates
-
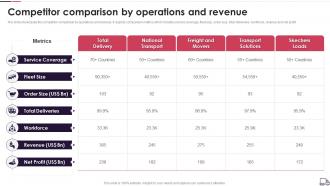 Logistics Transport Company Profile Competitor Comparison By Operations And Revenue
The slide showcases the competitor comparison by operations and revenue. It depicts comparison metrics which includes service coverage, fleet size, order size, total deliveries, workforce, revenue and net profit. Present the topic in a bit more detail with this Logistics Transport Company Profile Competitor Comparison By Operations And Revenue. Use it as a tool for discussion and navigation on Service Coverage, Fleet Size, Order Size, Total Deliveries, Workforce, Net Profit. This template is free to edit as deemed fit for your organization. Therefore download it now.
-
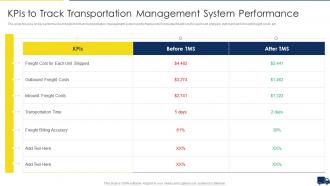 Improving Customer Service In Logistics KPIs To Track Transportation Management System
This slide focuses on key performance indicators to track transportation management system performance which includes freight cost for each unit shipped, outbound and inbound freight costs, etc. Deliver an outstanding presentation on the topic using this Improving Customer Service In Logistics KPIs To Track Transportation Management System. Dispense information and present a thorough explanation of Freight Costs, Accuracy, Transportation, Inbound, Outbound using the slides given. This template can be altered and personalized to fit your needs. It is also available for immediate download. So grab it now.
-
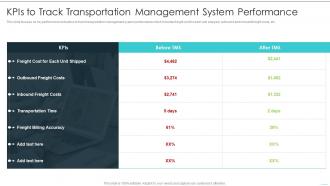 KPIS To Track Transportation Building Excellence In Logistics Operations
This slide focuses on key performance indicators to track transportation management system performance which includes freight cost for each unit shipped, outbound and inbound freight costs, etc. Deliver an outstanding presentation on the topic using this KPIS To Track Transportation Building Excellence In Logistics Operations. Dispense information and present a thorough explanation of Transportation Time, Freight Billing Accuracy, Outbound Freight Costs using the slides given. This template can be altered and personalized to fit your needs. It is also available for immediate download. So grab it now.
-
 Transportation Metrics And Analytics Dashboard
Introducing our Transportation Metrics And Analytics Dashboard set of slides. The topics discussed in these slides are Transportation, Analytics, Dashboard. This is an immediately available PowerPoint presentation that can be conveniently customized. Download it and convince your audience.
-
 Transportation Metrics Graph Chart Colored Icon In Powerpoint Pptx Png And Editable Eps Format
Give your next presentation a sophisticated, yet modern look with this 100 percent editable Transportation metrics graph chart colored icon in powerpoint pptx png and editable eps format. Choose from a variety of customizable formats such as PPTx, png, eps. You can use these icons for your presentations, banners, templates, One-pagers that suit your business needs.
-
 Transportation Metrics Odometer Colored Icon In Powerpoint Pptx Png And Editable Eps Format
Give your next presentation a sophisticated, yet modern look with this 100 percent editable Transportation metrics odometer colored icon in powerpoint pptx png and editable eps format. Choose from a variety of customizable formats such as PPTx, png, eps. You can use these icons for your presentations, banners, templates, One-pagers that suit your business needs.
-
 Transportation Metrics Odometer Monotone Icon In Powerpoint Pptx Png And Editable Eps Format
Make your presentation profoundly eye-catching leveraging our easily customizable Transportation metrics odometer monotone icon in powerpoint pptx png and editable eps format. It is designed to draw the attention of your audience. Available in all editable formats, including PPTx, png, and eps, you can tweak it to deliver your message with ease.
-
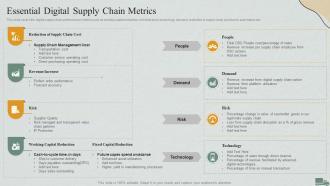 Logistics Management Steps Delivery And Transportation Essential Digital Supply Chain Metrics
This slide covers the digital supply chain performance metrics such as working capital reduction, risk tolerance, technology, demand, reduction in supply chain cost due to automation etc. Present the topic in a bit more detail with this Logistics Management Steps Delivery And Transportation Essential Digital Supply Chain Metrics. Use it as a tool for discussion and navigation on Technology, Revenue Increase, Working Capital Reduction . This template is free to edit as deemed fit for your organization. Therefore download it now.


