


![Top 10 Financial Reporting Templates [Free PPT & PDF]](https://www.slideteam.net/wp/wp-content/uploads/2024/02/Banner-2.png)


 Customer Reviews
Knowing your organization’s financial status is essential for making smart financial decisions. It specifies the groundwork for recognizing promising business opportunities and making appropriate decisions to ensure future expansion.
Carefully overseeing, arranging, and analyzing your organization's monetary performance can help you better understand where your funds are allocated and their sources. According to our leading industry research analysts, finance is among the most closely monitored and documented aspects of company activities.
Companies rely on financial reports to remain on top of the financial figures. Financial reports are formal documents that record a business’s significant financial activities during a specific period.
While these reports are priceless for you and your key stakeholders, they also benefit potential investors and banks. These parties analyze financial statements to determine whether they should invest in your business.
Financial Reporting PowerPoint Slides to Prepare Engaging KPIs and Spreadsheets
In this blog, we will guide you through PowerPoint slides that can help you effortlessly craft and deliver strategies to enhance financial performance, compare financial software, tackle financial reporting challenges, utilize KPI dashboards, and work with spreadsheets.
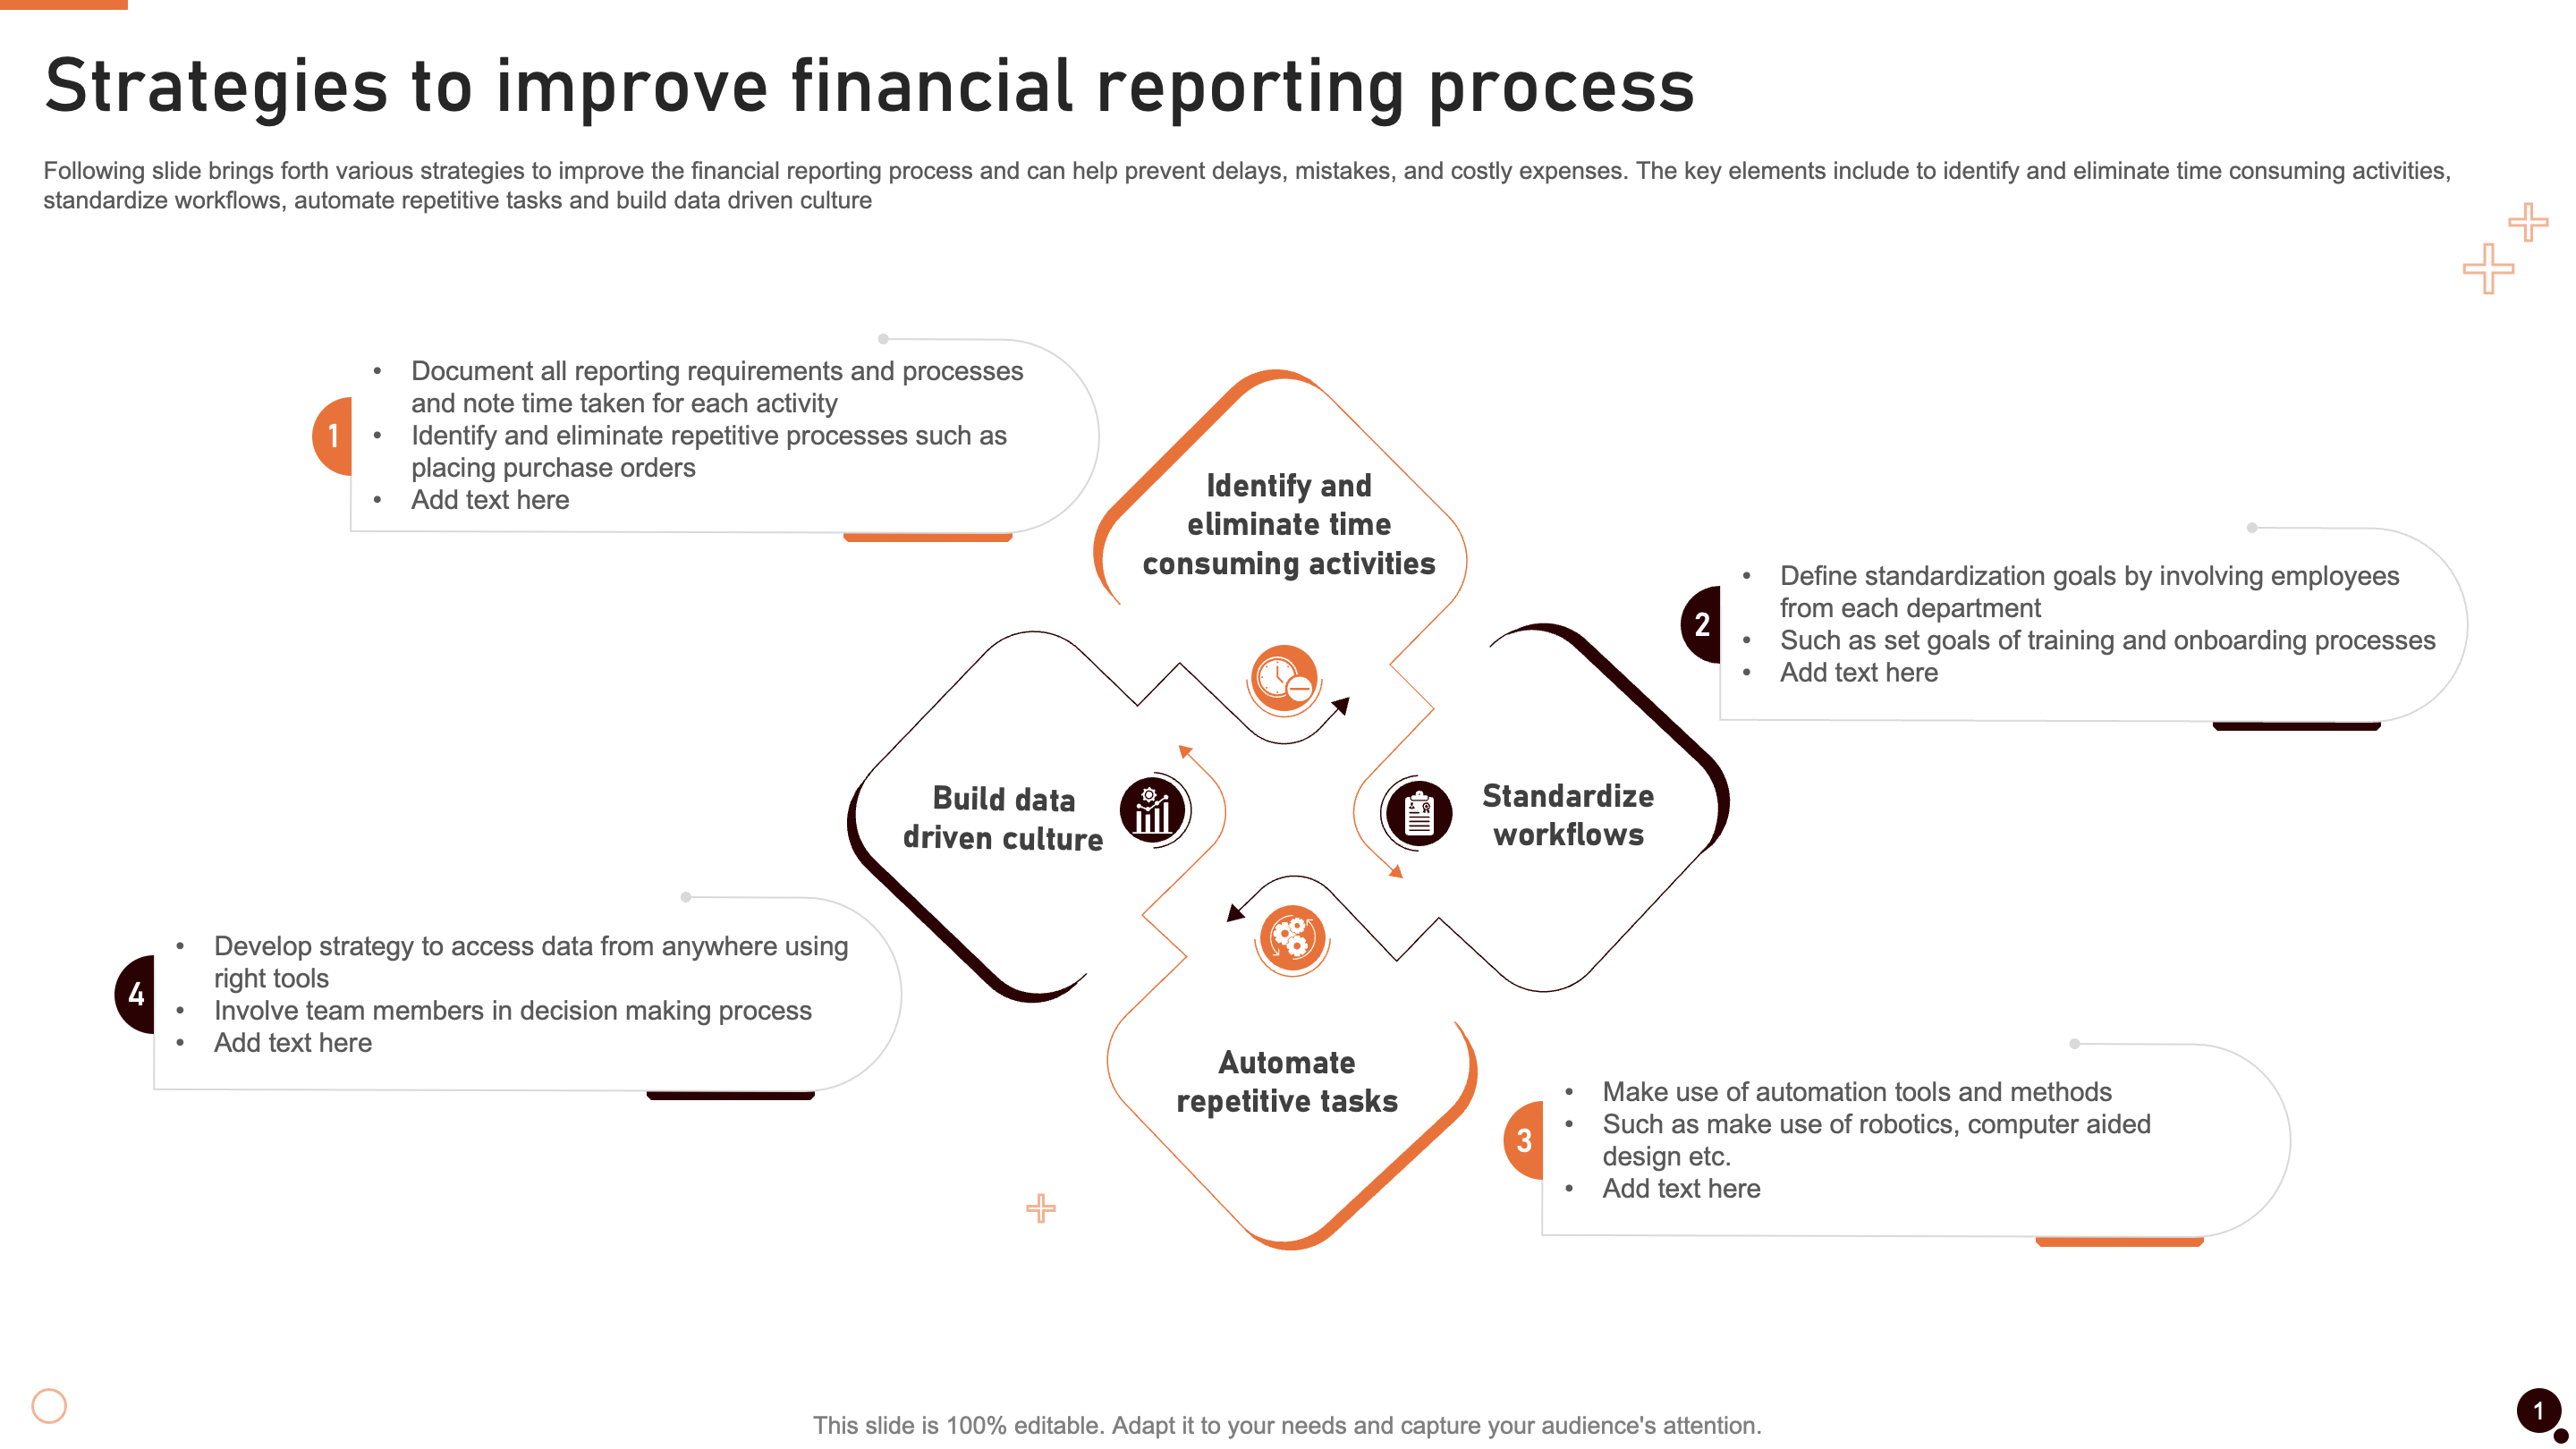
Slide 1: Strategies to Improve Financial Reporting Process
This slide shows important strategies for improving the financial reporting process to mitigate delays, errors, and unnecessary expenses. It encourages identifying and eliminating time-consuming tasks, normalizing workflows, automating repetitive functions, and promoting a data-driven culture.
With simplified activities and adopting automation, organizations can accelerate reporting and ensure accuracy and efficiency. These key elements collectively open the pathway for a more robust and responsive financial reporting framework. It also lowers the risk of delays and errors while encouraging a culture that values data-driven decision-making, eventually contributing to the financial reporting process’s success.
Download this PowerPoint Template Now!
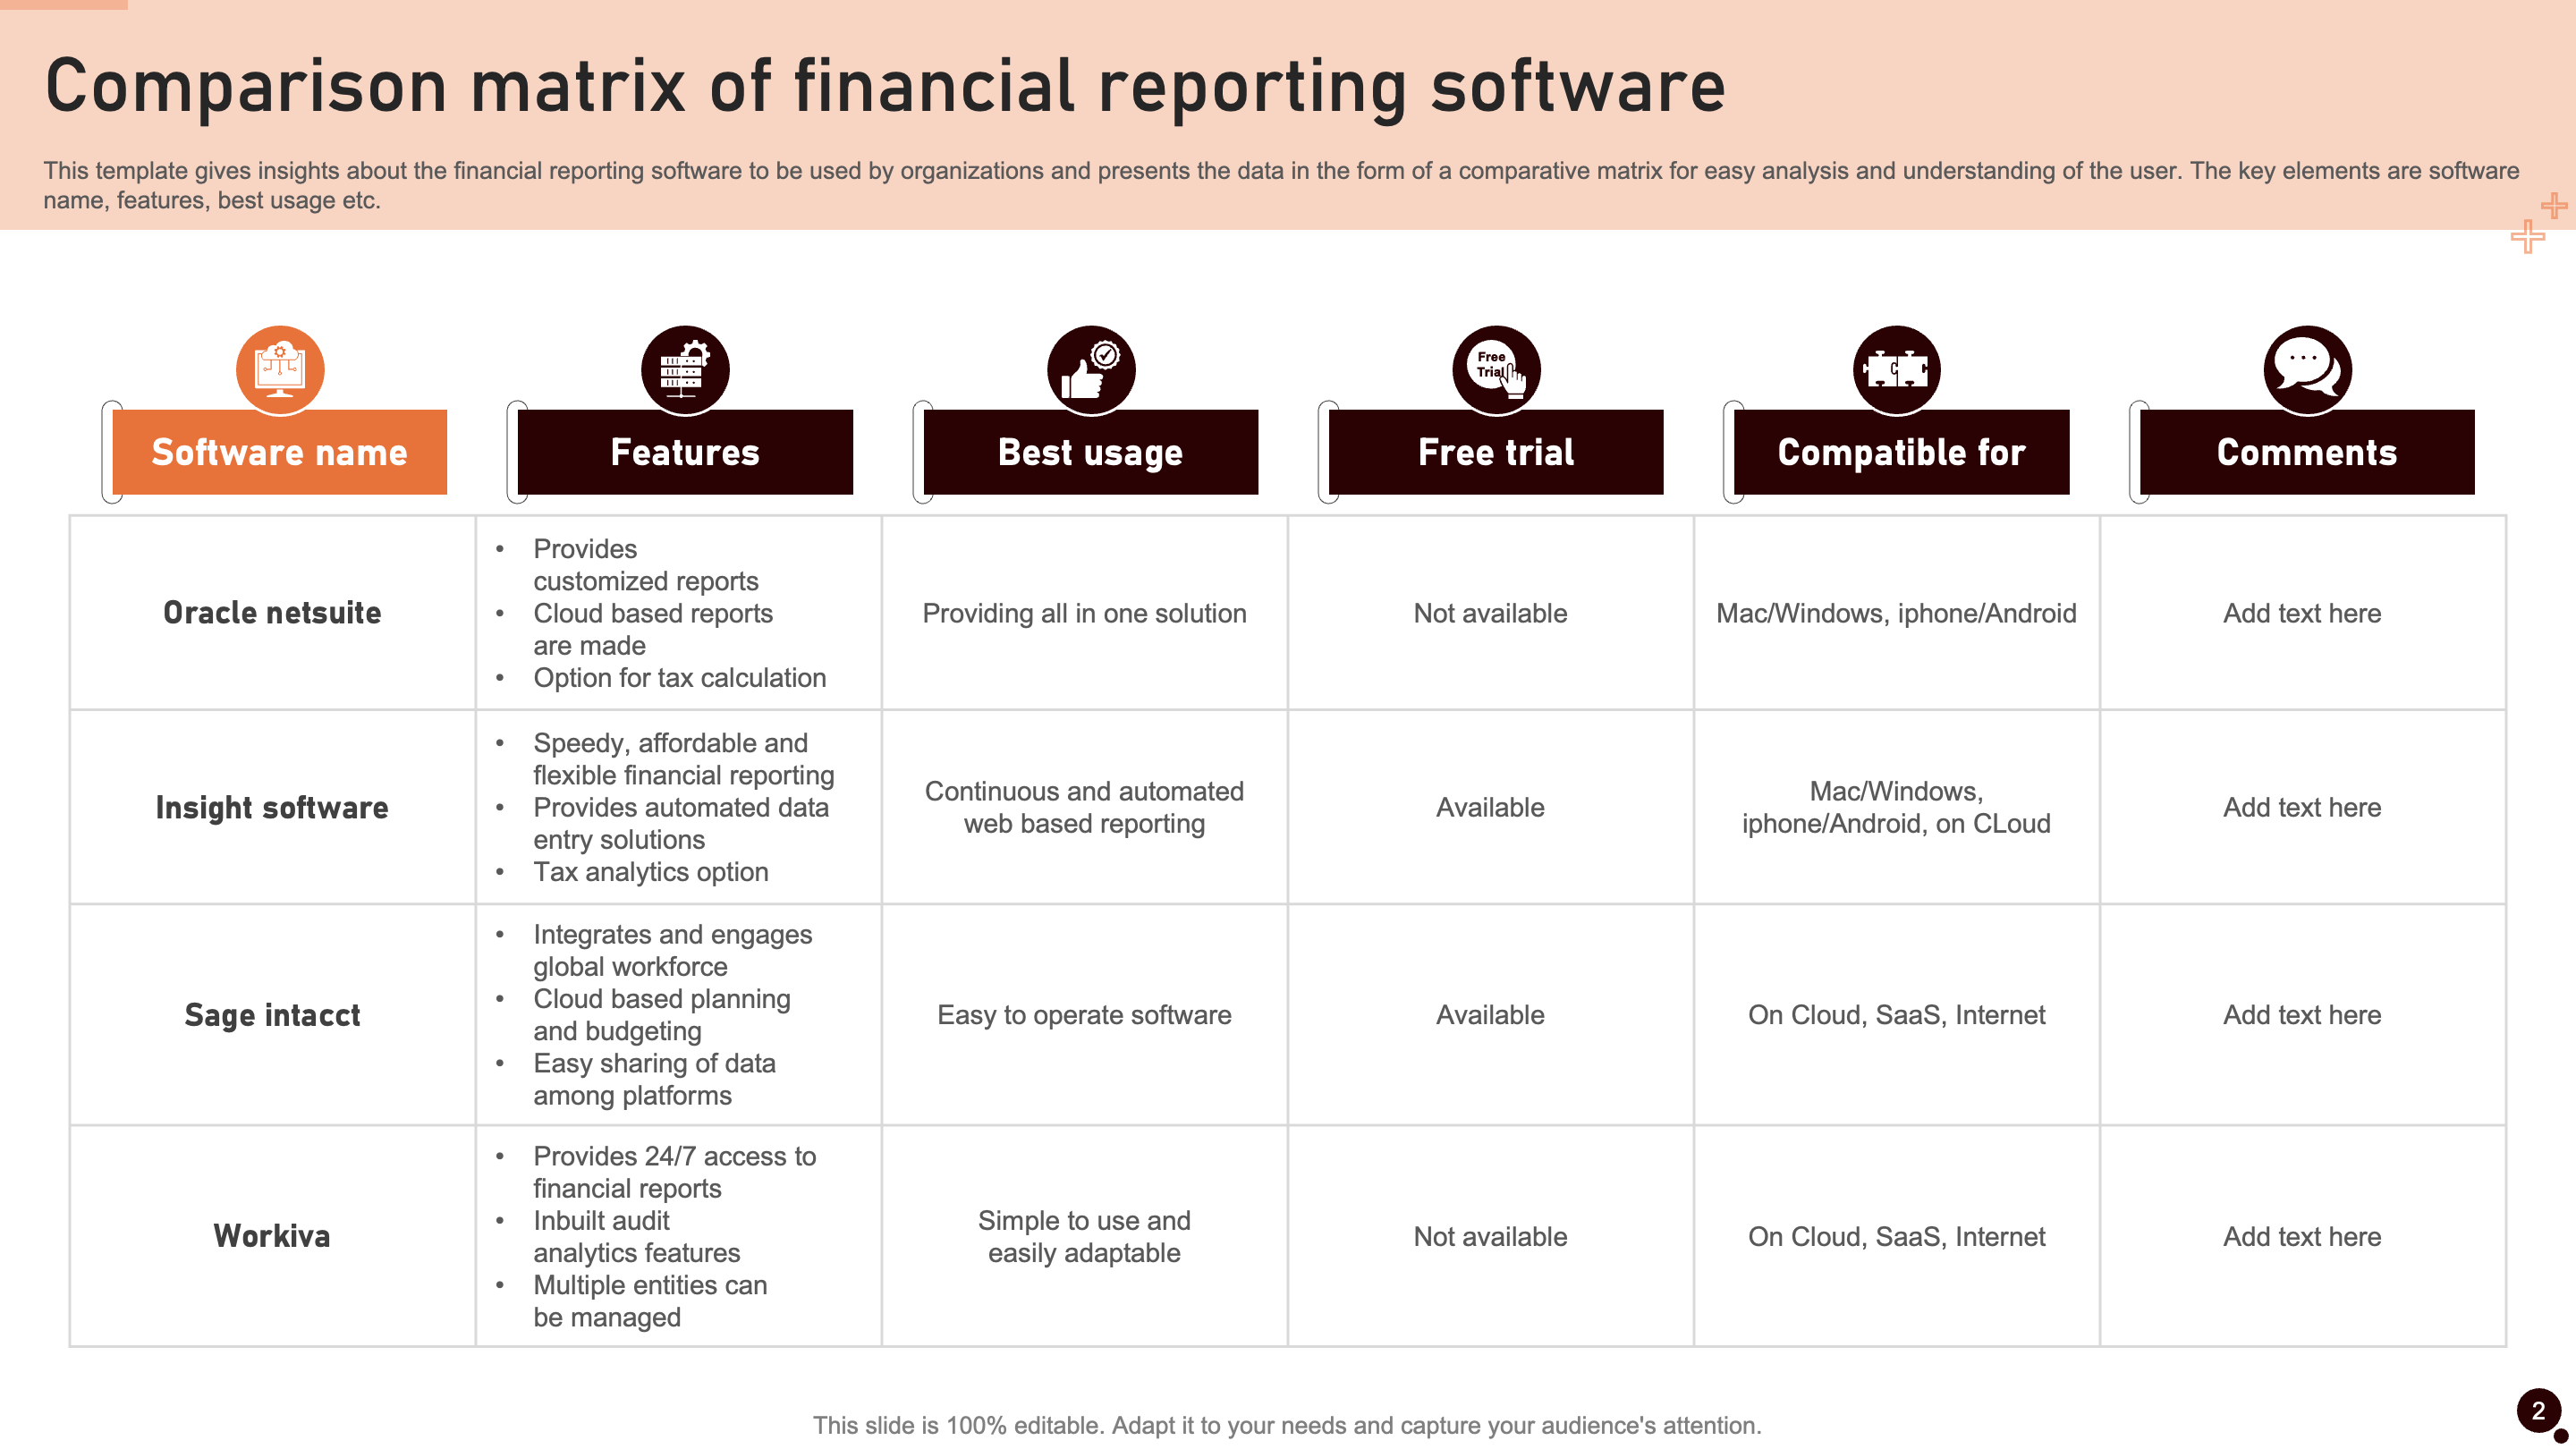
Slide 2: Comparison Matrix of Financial Reporting Software
This slide showcases valuable insights into financial reporting software options for organizations, presenting data in a user-friendly comparative matrix for seamless analysis. Key elements include the software's name, distinctive features, and optimal use cases.
This structured format enables a quick and comprehensive user understanding, allowing informed decision-making based on individual organizational needs. With these essential details, such as features and best usage scenarios, the template offers users a simplified yet thorough evaluation process, ensuring they can easily identify the most suitable financial reporting software for their specific requirements.
Download this PowerPoint Template Now!
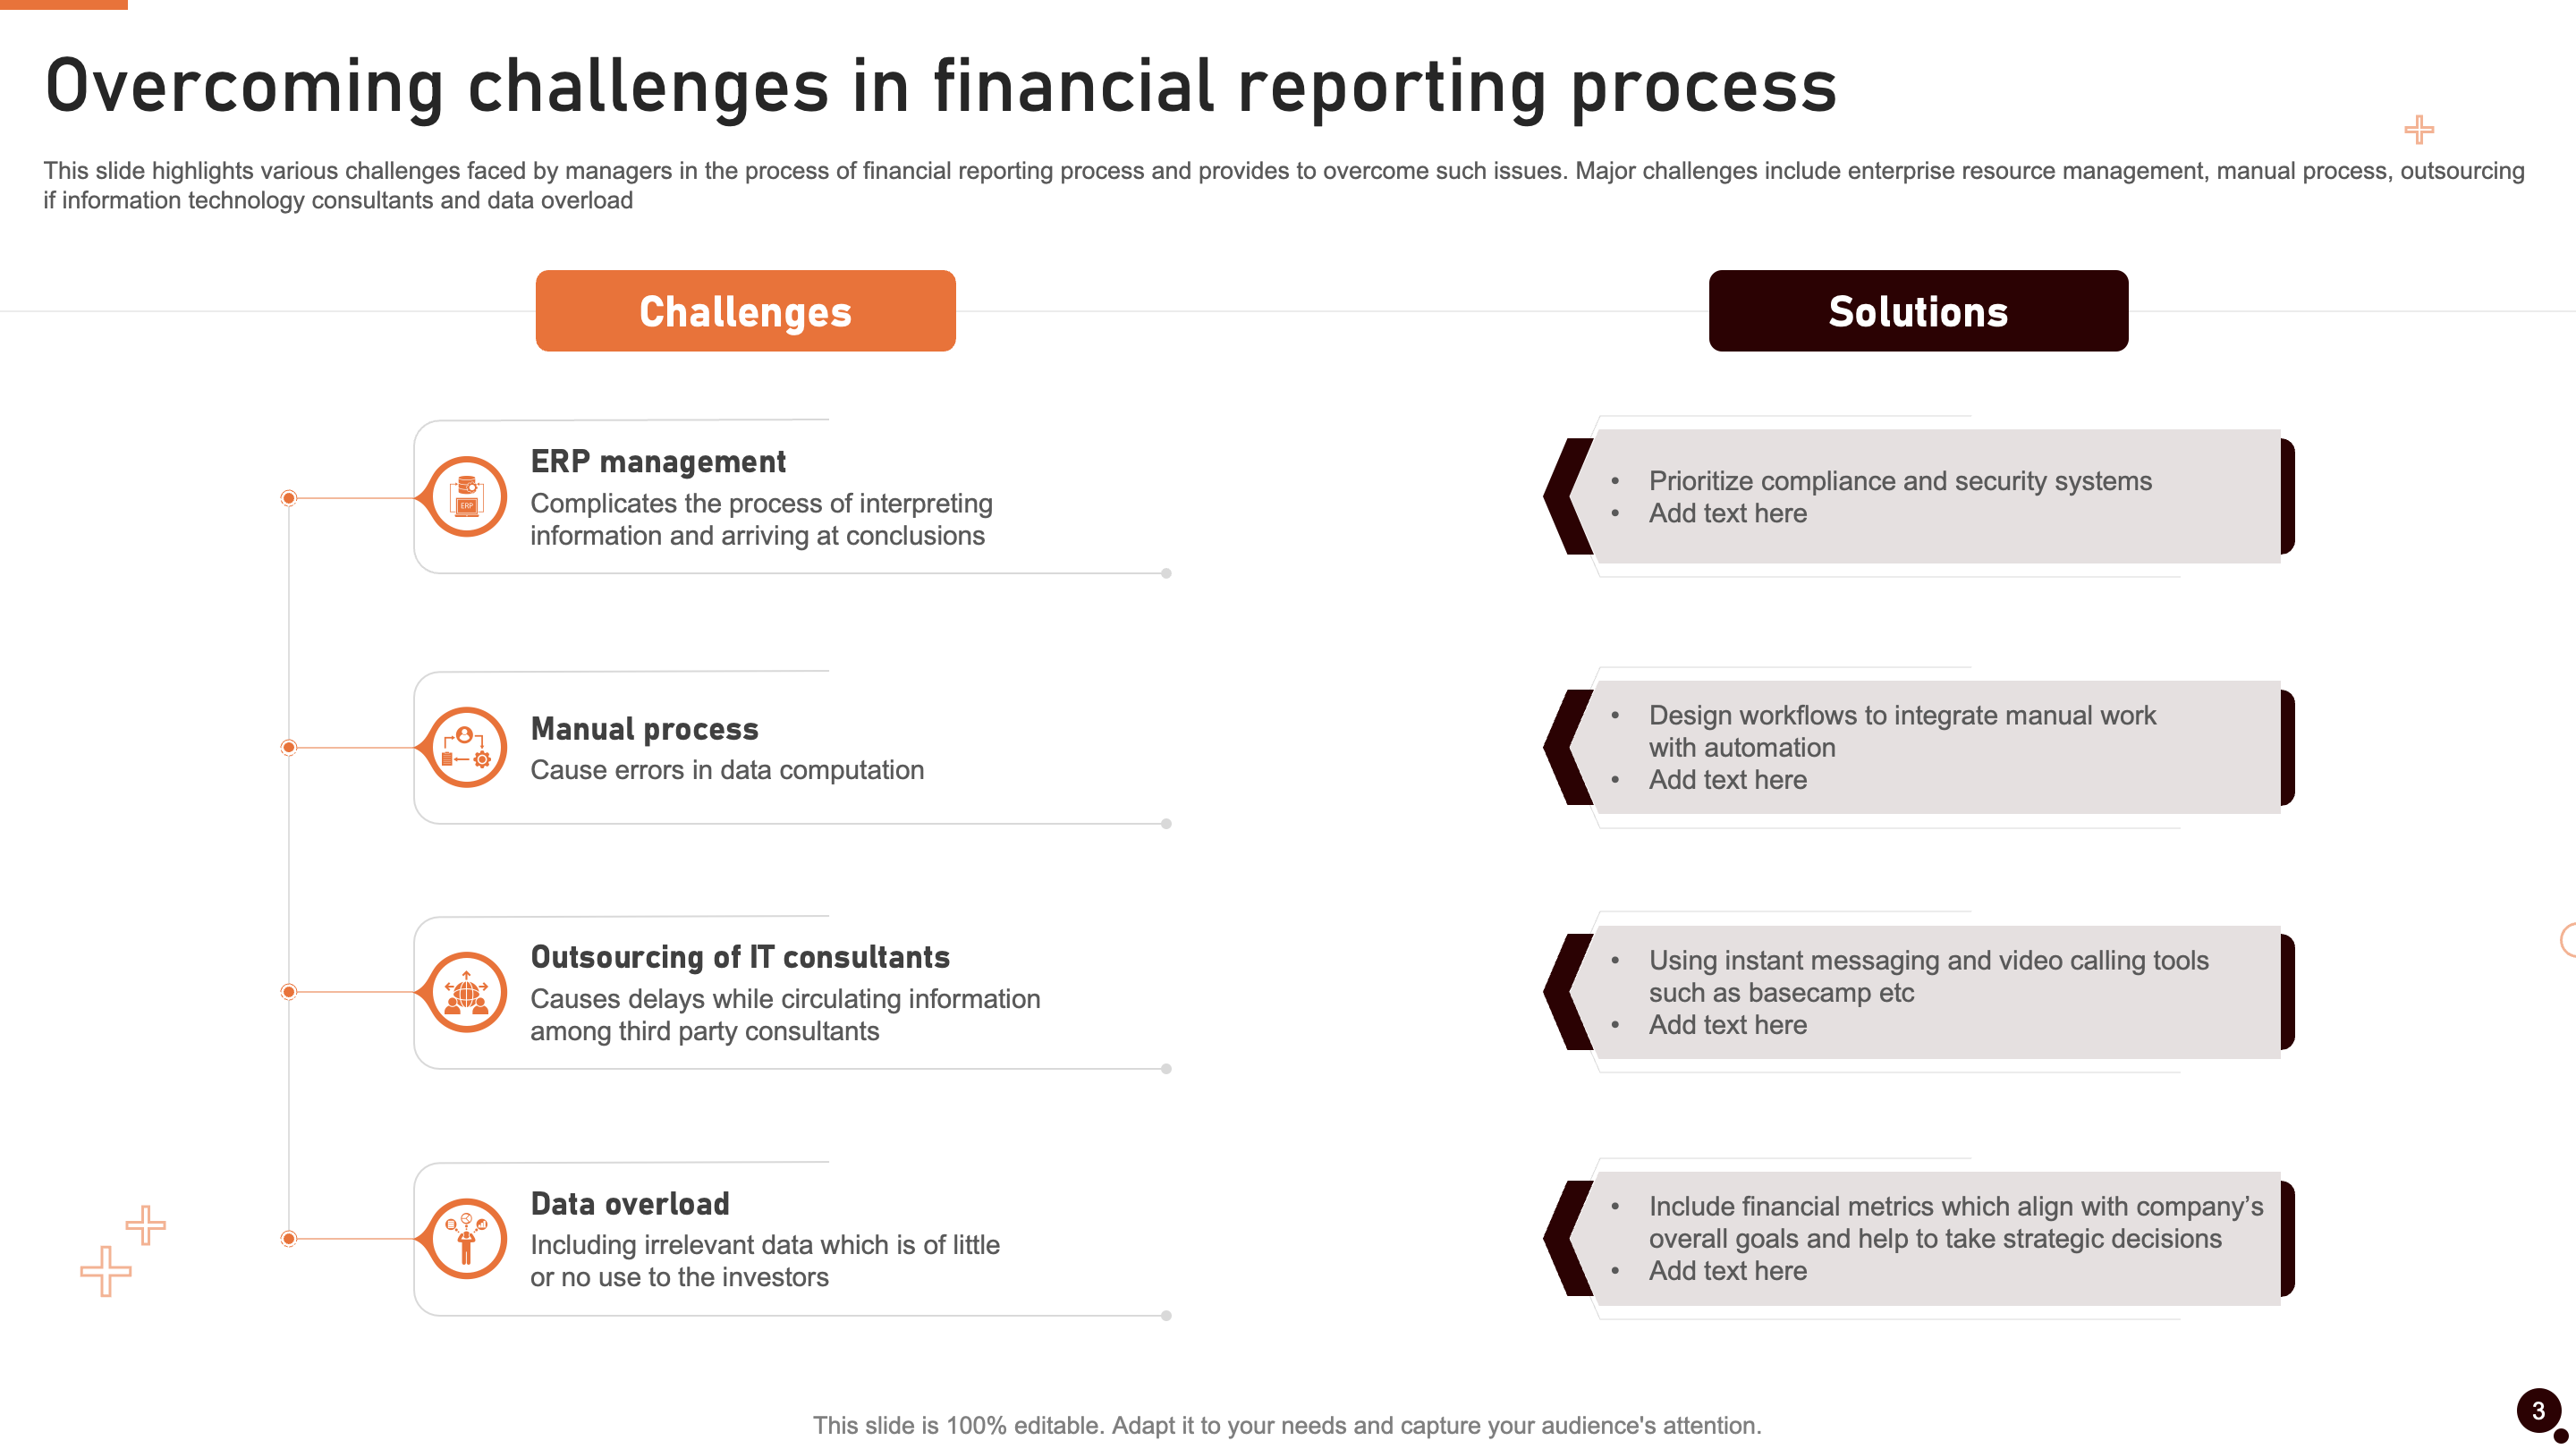
Slide 3: Overcoming Challenges in Financial Reporting Process
This slide presents critical challenges faced by managers in the financial reporting process and proposes effective solutions. Key hurdles include enterprise resource management, manual processes, reliance on external information technology consultants, and coping with data overload.
The template encourages simplified enterprise resource management practices to overcome these challenges, such as reducing dependence on manual tasks through automation, nurturing in-house expertise, and implementing strategic data management solutions.
With these practical strategies, the slide gives managers the tools to tackle these hurdles successfully, ensuring a smoother financial reporting process and enhancing overall operational efficiency.
Download this PowerPoint Template Now!
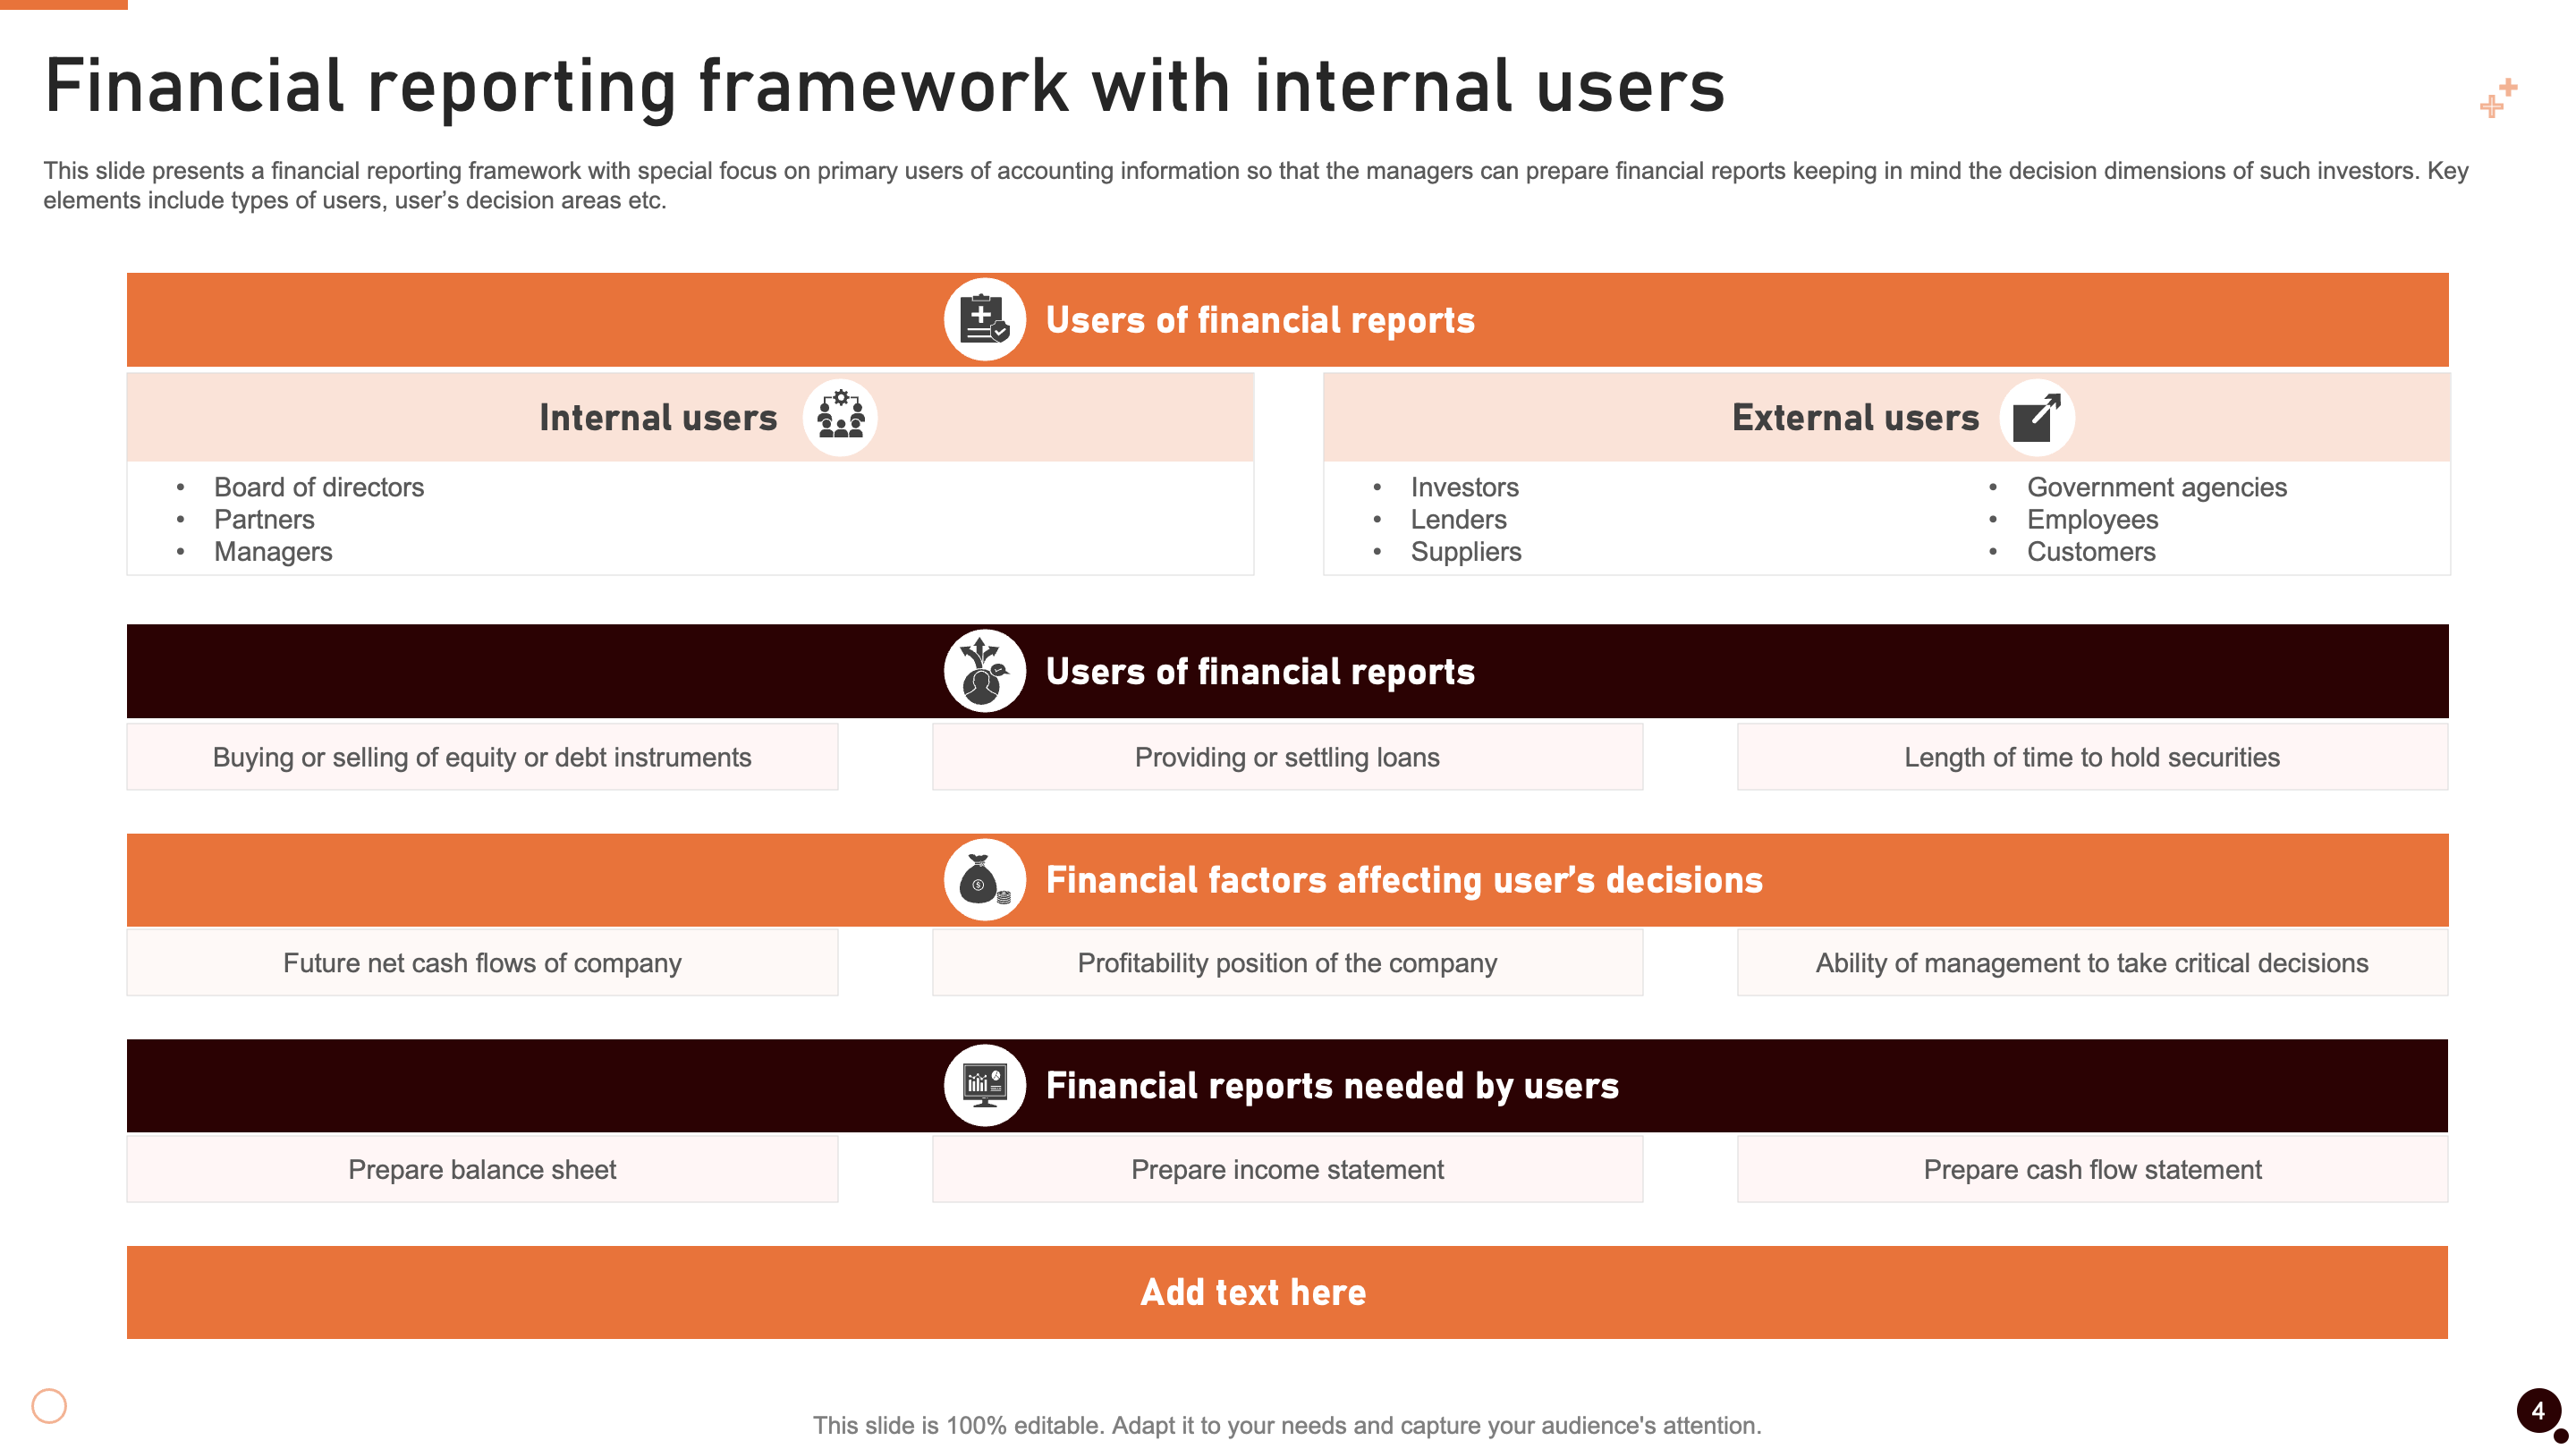
Slide 4: Financial Reporting Framework with Internal Users
This slide showcases a complete financial reporting framework, highlighting its tailored design for primary users of accounting information. The framework strategically advises managers to craft financial reports that align with the decisions crucial for investors.
Key components include the identification of user types and their corresponding decision areas. Recognizing the various needs of stakeholders, this framework allows managers to tailor financial reports in order to address specific concerns, encouraging a more informed decision-making process. With a focus on internal users and their decision-making, the template ensures that financial reports are invaluable tools for investors, enhancing the relevance and impact of the information presented.
Download this PowerPoint Template Now!
Slide 5: Financial KPI Dashboard to Report Cash Flow of the Company
This slide presents a dynamic financial dashboard capturing the enterprise’s overall spending capability. Core performance indicators featured in this comprehensive display include the cash burn rate, monthly expenses, and solvency status.
The dashboard provides a quick view of important financial measures and is a powerful instrument for stakeholders expecting an instant and perceptive understanding of the firm’s financial well-being. Incorporating primary indicators guarantees a robust evaluation of expenditure patterns, providing decision-makers with actionable insights into cash flow administration and financial stability.
This visually impactful template facilitates data interpretation and empowers strategic decision-making by offering a real-time overview of the company's financial strength.

Download this PowerPoint Template Now!
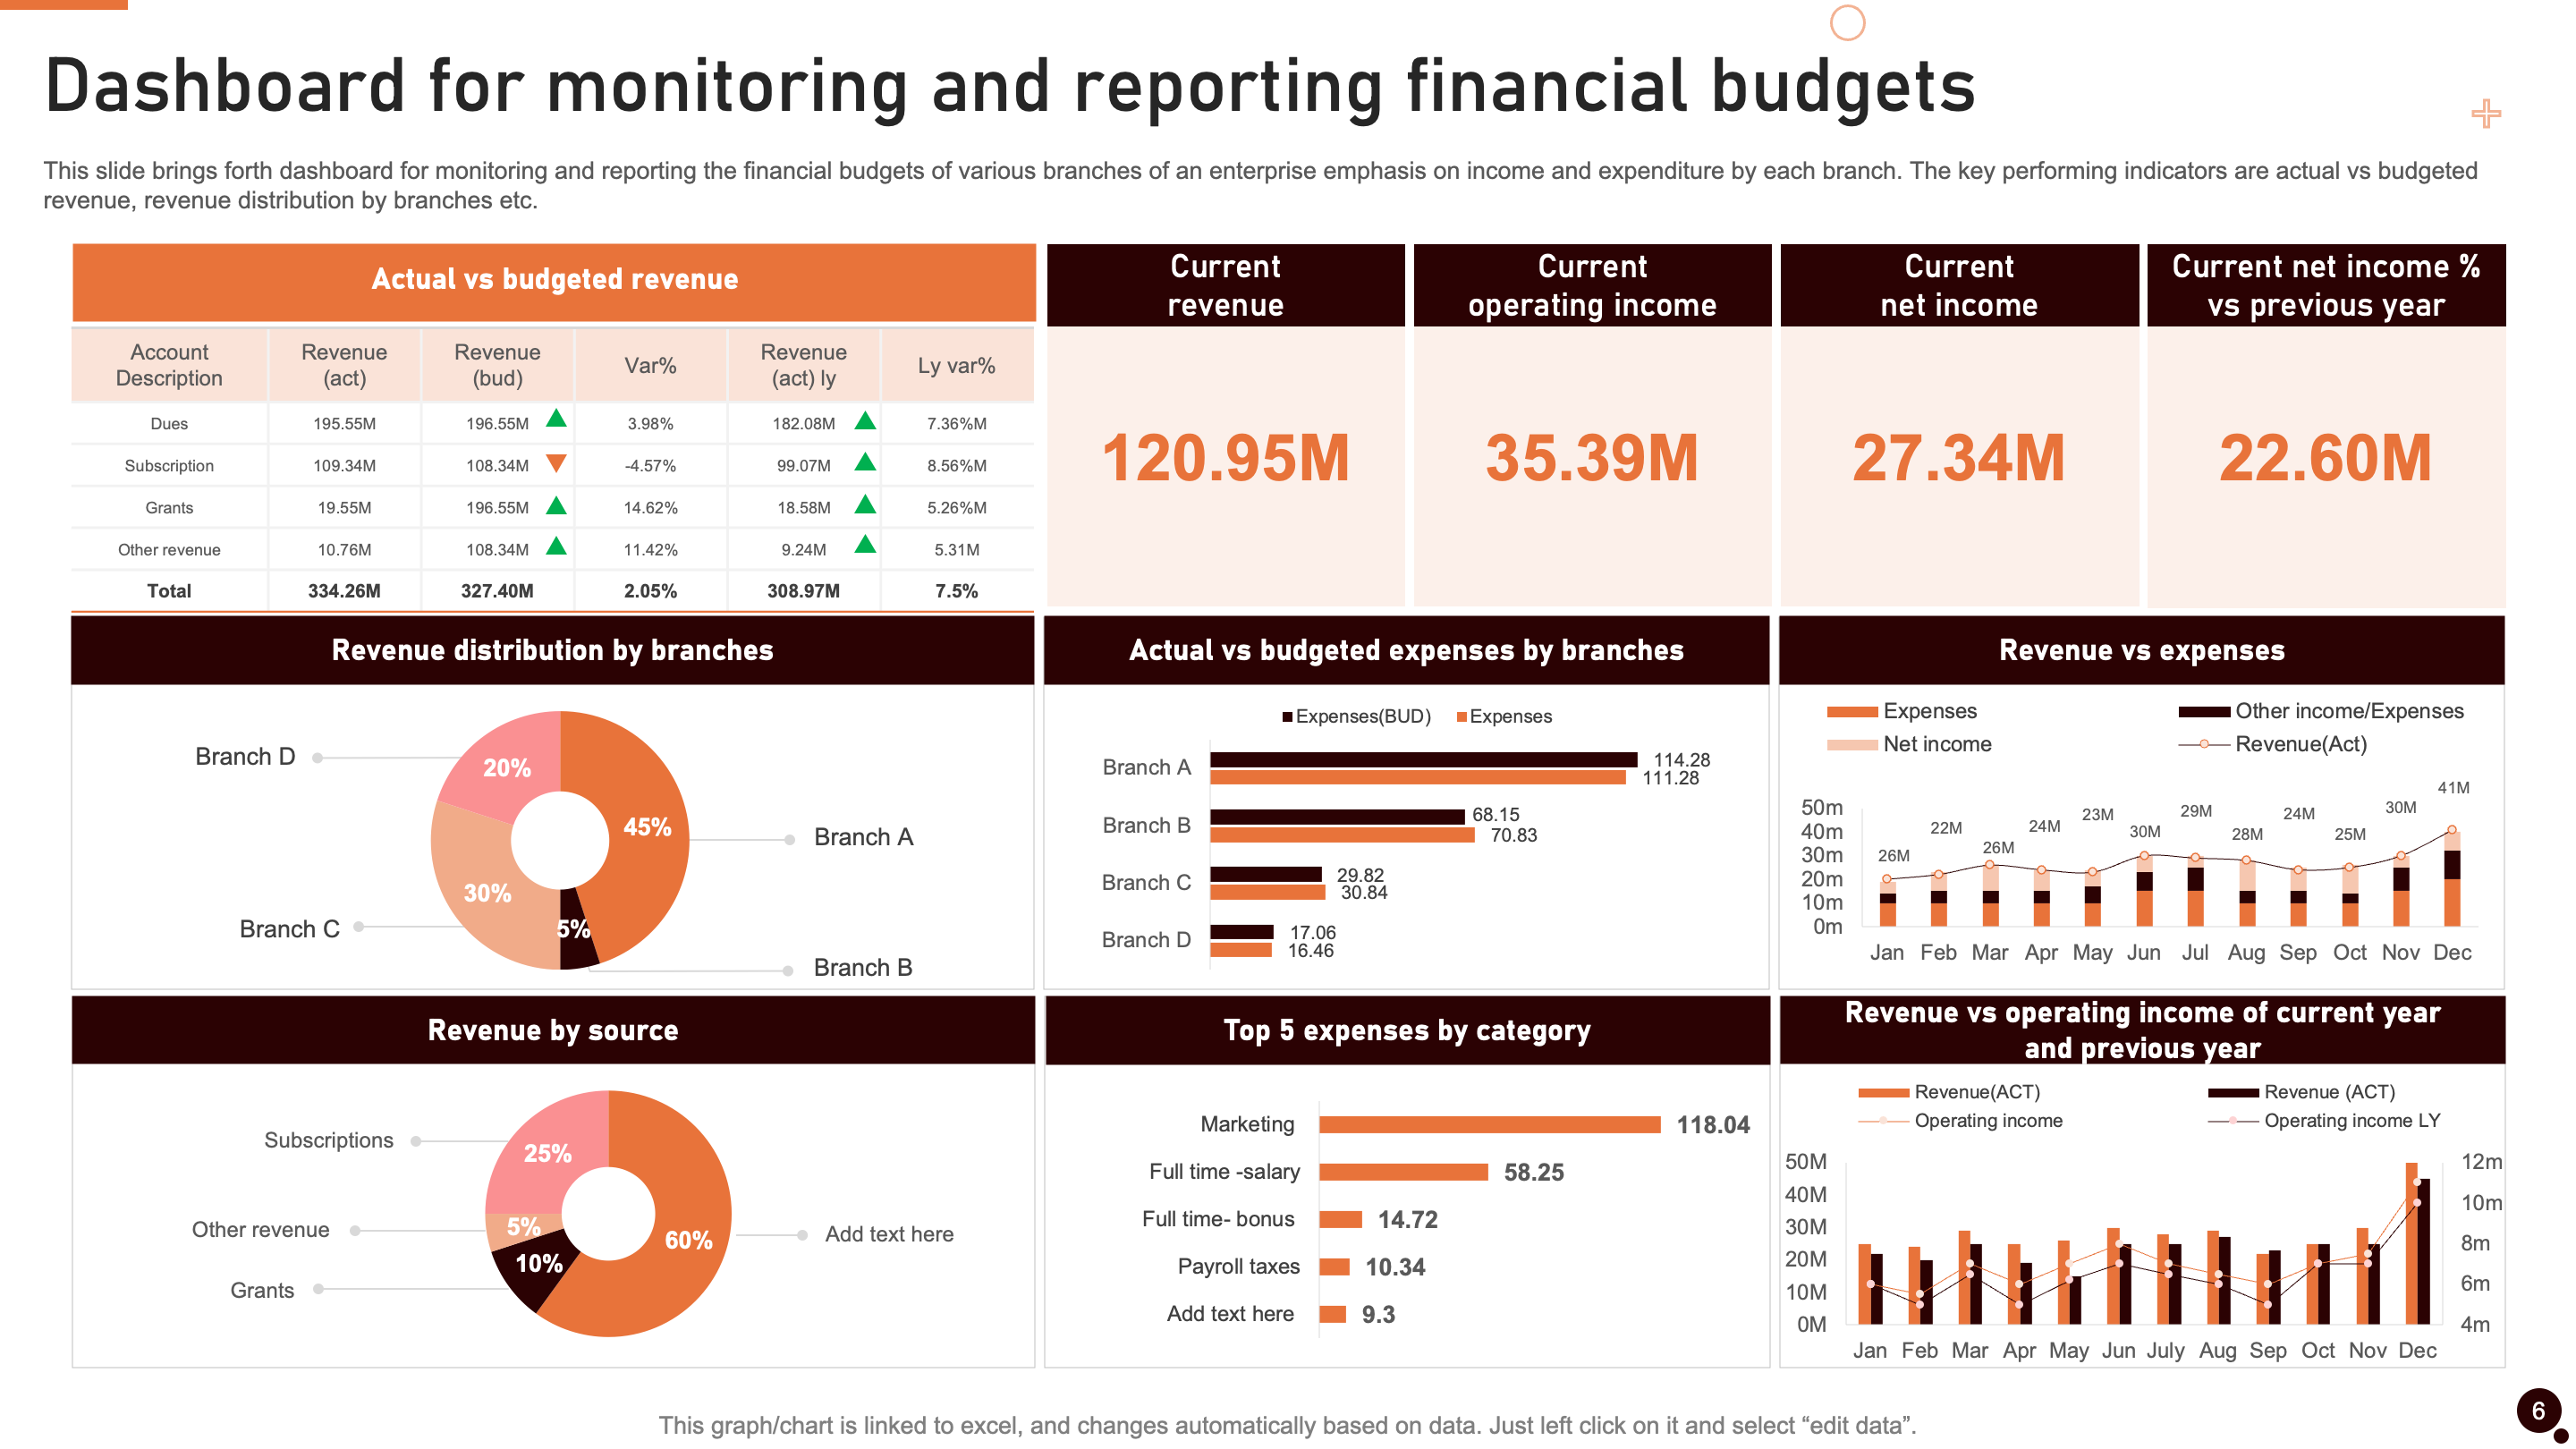
Slide 6: Dashboard for Monitoring and Reporting Financial Budgets
This slide showcases a detailed financial dashboard designed for monitoring and reporting the budgets of diverse branches within an enterprise, with a specific focus on income and expenditure analysis. Key performance indicators include the insightful comparison between actual and budgeted revenue, providing insight into the financial performance of each branch.
Additionally, the dashboard provides a detailed breakdown of revenue distribution across branches, improving visibility into their contributions. This strategic template facilitates a clear understanding of budget compliance and empowers decision-makers to pinpoint areas of strength and improvement within each branch.
The visual representation of these critical metrics ensures a simplified and efficient assessment of financial performance across the enterprise.
Download this PowerPoint Template Now!
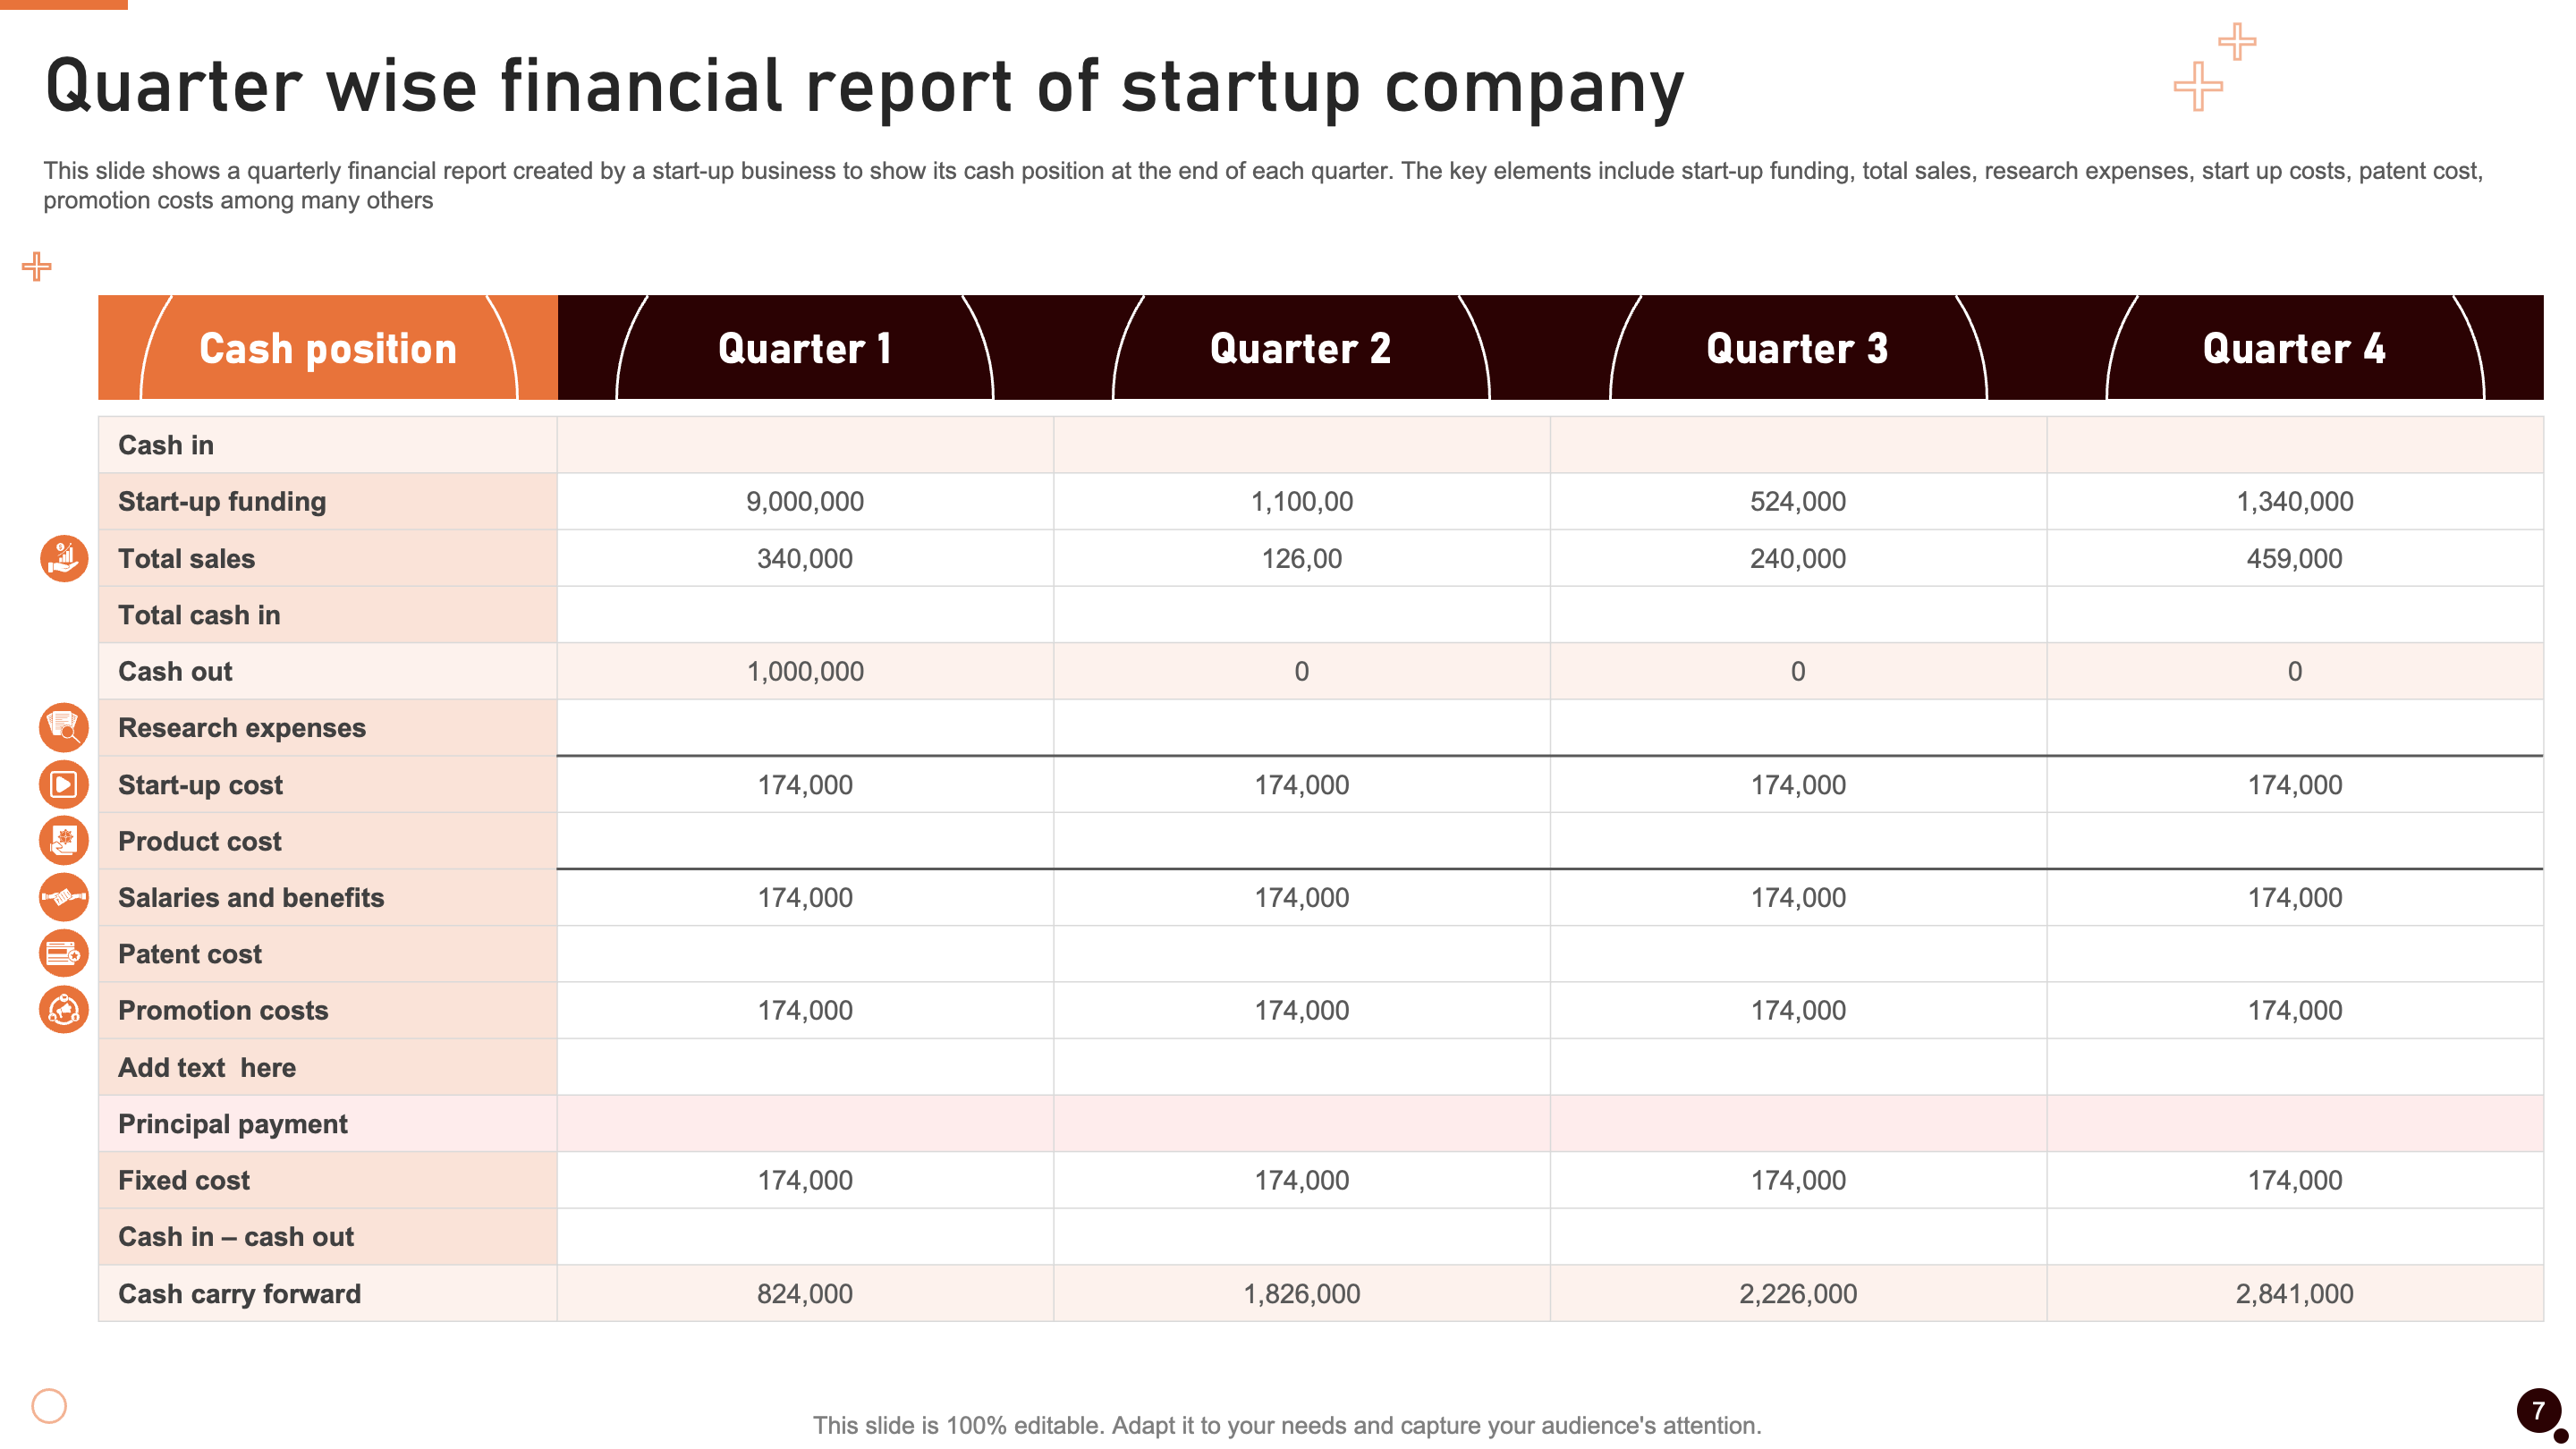
Slide 7: Quarter Wise Financial Report of Startup Company
This slide showcases a comprehensive quarterly financial report meticulously crafted by a startup business, offering a transparent report of its cash position at each quarter's ending. Key elements featured in this slide include startup funding, total sales, research expenses, startup costs, patent expenditures, promotion costs, and various other critical financial metrics.
Covering these diverse elements, the report provides stakeholders with a detailed view of the startup's financial landscape, describing the allocation of resources and highlighting areas of main focus. The transparent examination of expenditures and revenues empowers informed decision-making. It also enables a deeper understanding of the startup's financial health and trajectory, crucial for both internal management and external stakeholders.
Download this PowerPoint Template Now!
Slide 8: Scorecard for Reporting Financial Performance of Companies
This slide presents a scorecard for assessing the financial performance of specific companies by measuring key performance indicators. The scorecard serves as a valuable tool for management, offering insightful analyses and pinpointing potential areas of improvement.
Key elements of this assessment include sales, net profit, working capital, and equity. Through a detailed analysis of these financial indicators, management gains actionable insights into the overall health and efficiency of the companies in question.
The scorecard enables informed decision-making and allows management to strategically enhance performance by focusing on specific areas requiring attention. This targeted approach ensures a thorough understanding of financial trends, guiding management toward optimal strategies for sustained growth and success.

Download this PowerPoint Template Now!
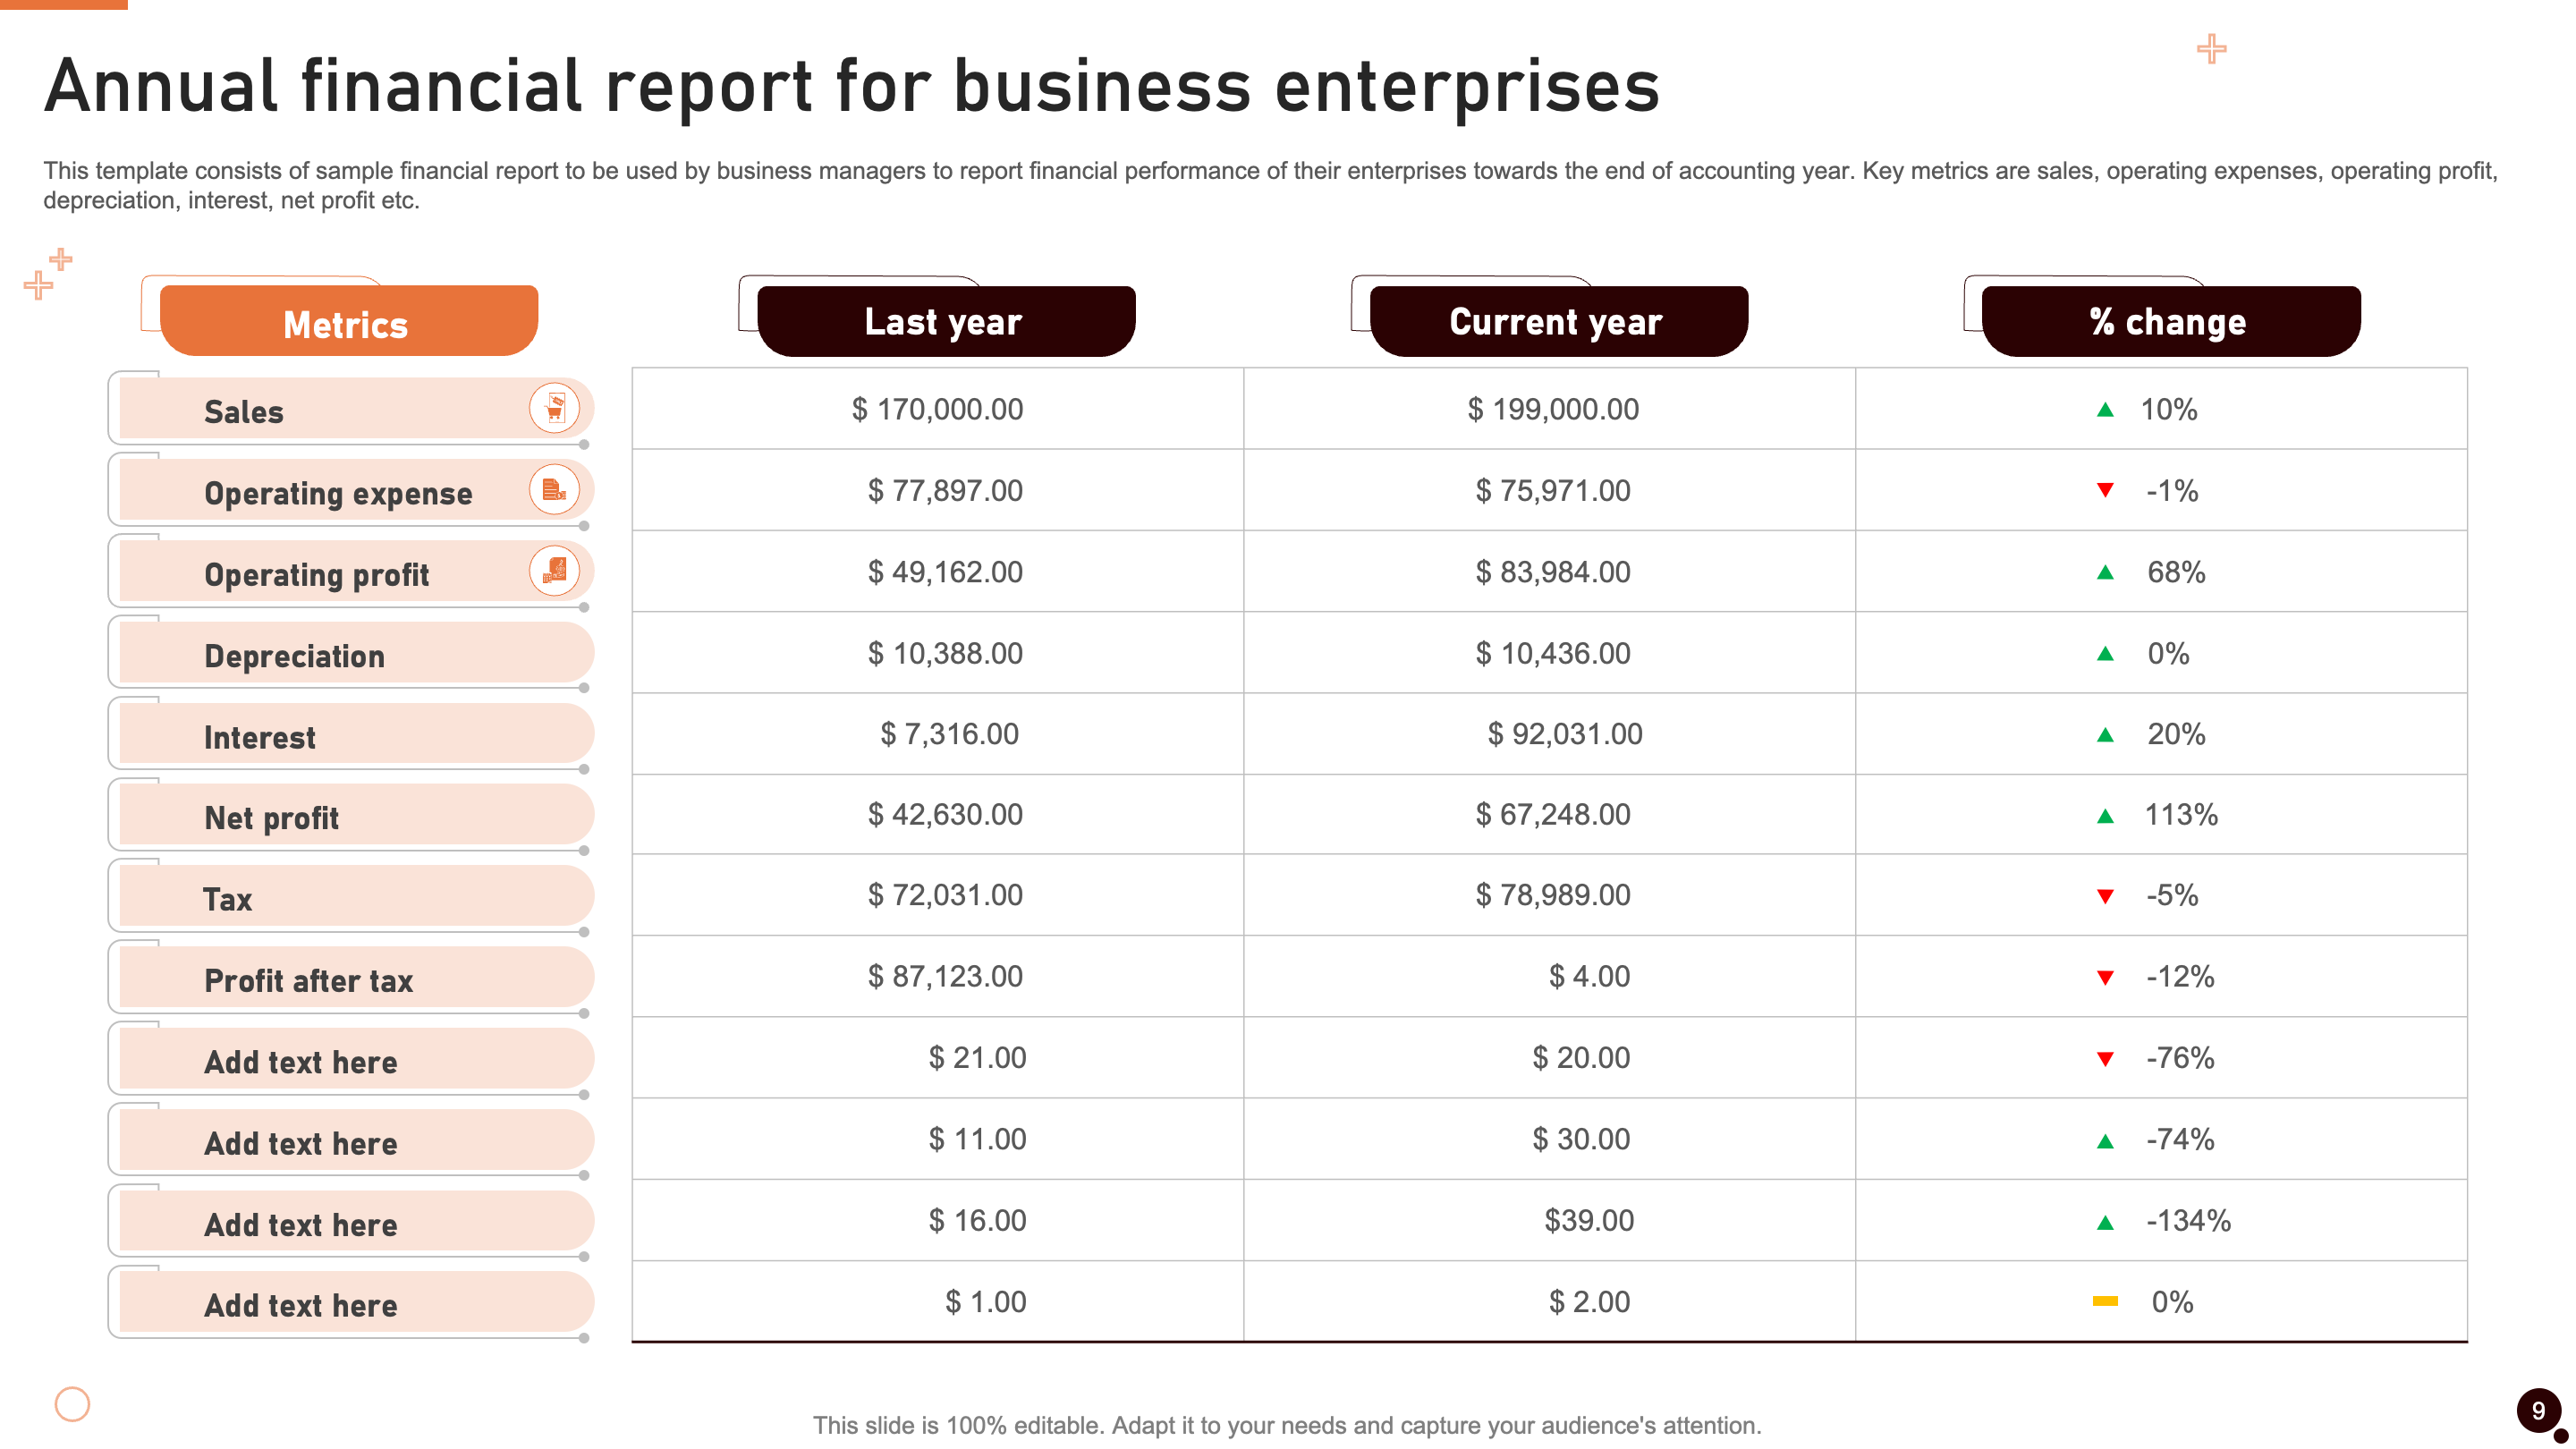
Slide 9: Annual Financial Report for Business Enterprises
This slide displays a sample financial report designed for business managers to convey the financial performance of their firm as the accounting year ends. It includes key metrics critical for a thorough assessment, including sales, operating expenses, operating profit, depreciation, interest, and net profit.
With a structured framework, the template enables managers to communicate the financial standing of their businesses in a clear and concise manner. Including essential metrics ensures an indetail overview, leading to strategic decision-making.
Download this PowerPoint Template Now!
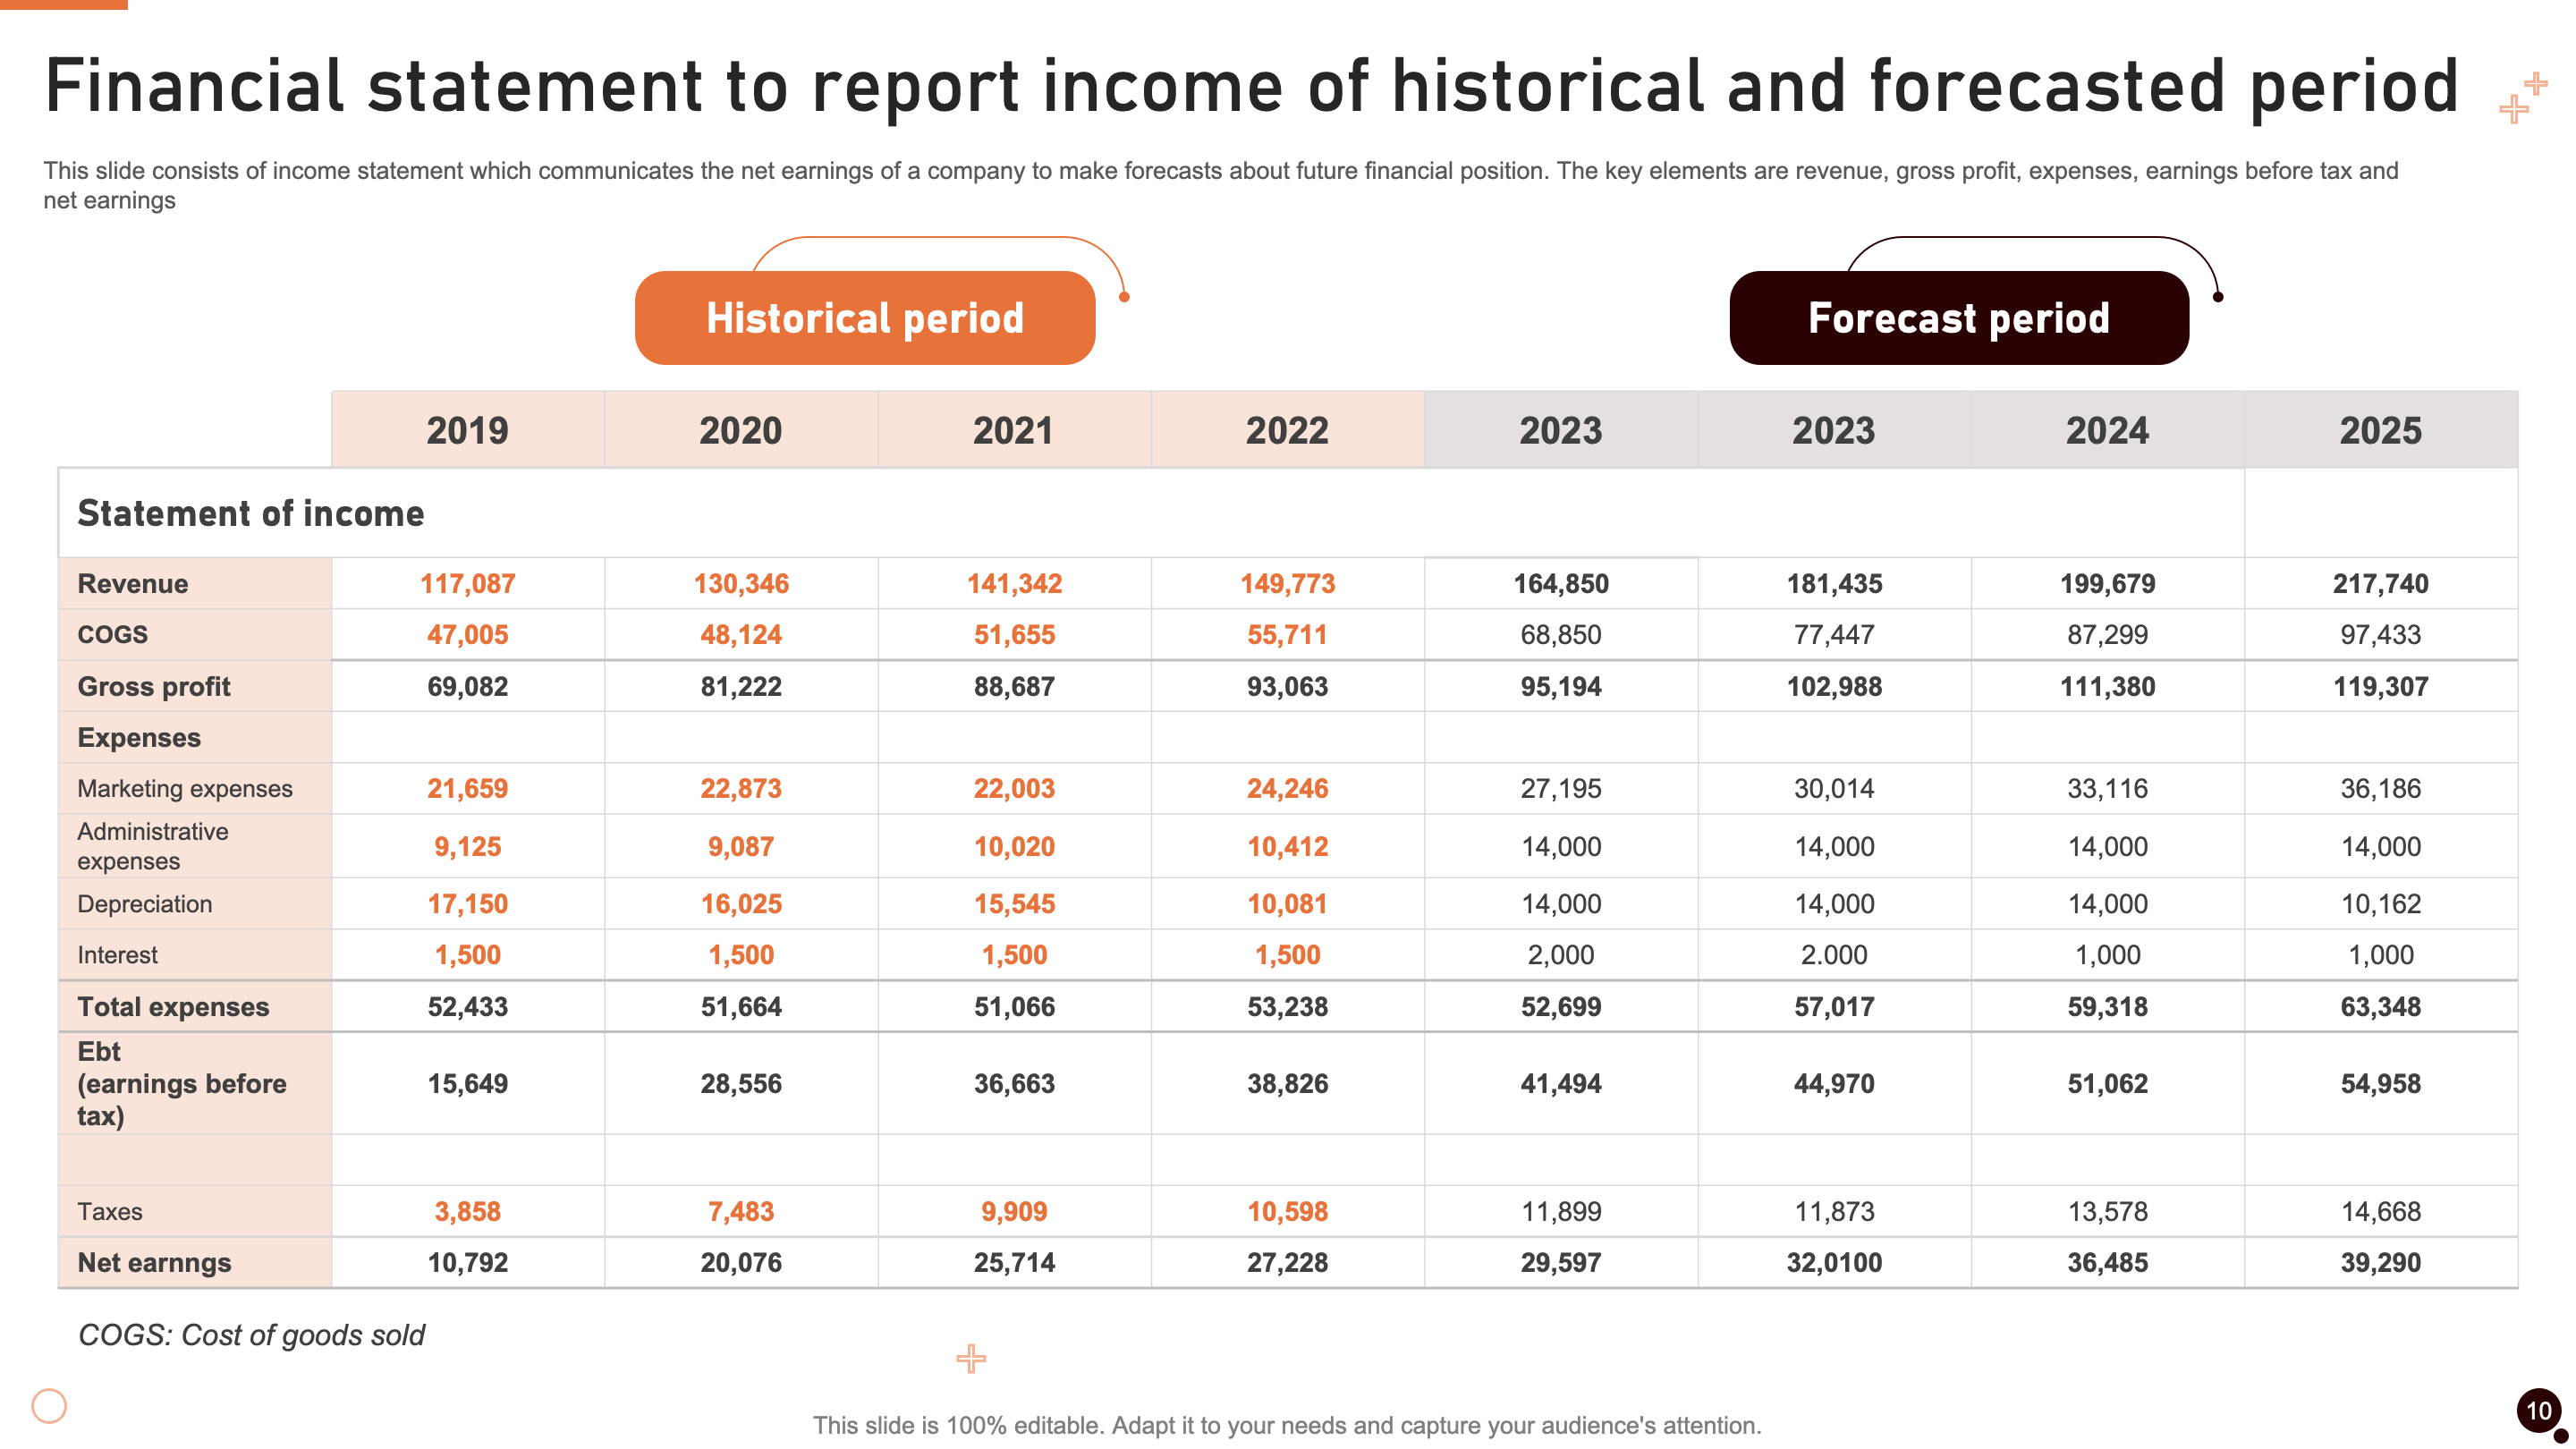
Slide 10: Financial Statement to Report Income of Historical and Forecasted Period
This slide showcases a brief income statement, a key tool for communicating a company's net earnings and projecting its future financial position. The statement includes gross profit, expenses, revenue, earnings before tax, and net earnings.
The income statement clearly and concisely breaks down these key financial components, promoting a complete understanding of the company's financial performance. This information not only serves as a historical record but also allows stakeholders to make informed predictions about the firm's future financial trajectory.
Download this PowerPoint Template Now!
Conclusion
Creating financial reports that government agencies and potential investors will review can be daunting. The pressure to produce a flawless report can be overwhelming.
Fortunately, SlideTeam is here to help ease that stress and improve your financial reporting skills. Whether you create these reports quarterly or annually, you will have a lot of data to analyze. Our financial reporting PowerPoint slides can simplify and accelerate this analysis process.
Our customizable KPI dashboards allow you to visualize and organize all the important data in one place. Not only should these dashboards be visually appealing, but your spreadsheets should also be engaging.
You can download this presentation to fulfill the expectations of your company’s stakeholders and potential partners. However, please be aware that this presentation is exclusively accessible to our members. If you haven't subscribed yet, you can acquire a monthly subscription for as little as $49.99.
For further details regarding our pricing system, click here.
Stay tuned for more thrilling content from us.

Frequently Asked Questions
Q: Why is it crucial for businesses to use financial reporting templates?
Financial reporting templates offer a structured and efficient way to communicate a company's financial performance. They provide a standardized format for presenting key metrics, making it easier for stakeholders, investors, and management to analyze and make informed decisions. These templates streamline the reporting process, ensuring clarity and consistency in financial communication.
Q: How can financial dashboards benefit decision-makers in a company?
Financial dashboards offer decision-makers a visual representation of key performance indicators (KPIs) and financial metrics. This visual clarity allows for quick and easy interpretation of complex financial data, aiding in strategic decision-making. Dashboards enable decision-makers to identify trends, assess financial health, and make timely adjustments, contributing to more informed and effective management decisions.
Q: Are the financial reporting templates customizable to fit specific business needs?
Yes, the financial reporting templates provided by SlideTeam are customizable to accommodate the unique requirements of different businesses. Users can modify the templates to include specific metrics, adjust formatting, and tailor the content to align with their company's financial reporting preferences. This flexibility ensures that the templates can be adapted to suit the specific needs and nuances of individual enterprises.


![10 Best Templates for Data Processing Services [Free PPT & PDF]](https://www.slideteam.net/wp/wp-content/uploads/2024/02/Banner.png)


