Time travel has always been a universal human desire. People are willing to do anything to change their past or see their future.
Businesses also have this wish to capture time, but go about it in a much more practical way. Entrepreneurs use timelines, in the form of infographics, to organize and manage their businesses better and make money faster, also a way of time travel.
A tool to help businesses make better use of resources, set realistic goals, and increase efficiency is a timeline infographic. It helps businesses manage themselves better, establish milestones for staff, and draw up a roadmap for stakeholders. Estimations and projections are visually drawn up to create the maximum audience impact.
With a timeline infographic, business stability is guaranteed and flexibility, that results from sudden changes in business environment, is also faster to execute. In its essence, a timeline infographic has you prepared to bend and stretch time depending on business exigency, as it were.
In this not-so-easy exercise, SlideTeam offers you help. We have curated the best value proposition in terms of timeline infographic templates. From roadmaps to staircase designs to social networks, we have the variety to dazzle and win you clients and win over stakeholders on the strength of both our design and the ready-made expert-level content.
The 100% customizable nature of the templates provides you with the desired flexibility to edit your presentations. The content ready slides give you the much-needed structure.
Let’s take this time-ride through our presentation templates and give you the most fruitful result you expect, a sensible, professional timeline infographic to present before an audience. The roomful of people is looking for concrete plans to move toward better productivity or improved business results, and you will resolve this pain point of theirs using our PPT Templates.
Template 1: Parallel Timeline Infographic Showing Customer Journey Map
This PPT presentation is a unique combination of timelines and customer types. Use it to showcase customer journey map through the stages your business has drawn for them. It is a parallel timeline infographic, where the first stage is 'User signs up', which is followed by 'User goes through onboarding'. The third stage is whether the customer uses the product, abandons your tool, or continues as free user. In the customer journey map, we also profile the fourth stage, which may have the user upgrading to the premium category. Download this presentation now to showcase your expertise in both process and project timelines and its innovative use for mapping customer journey. The timeline (yearly halves) on the left is just an indicator and 100% customizable.
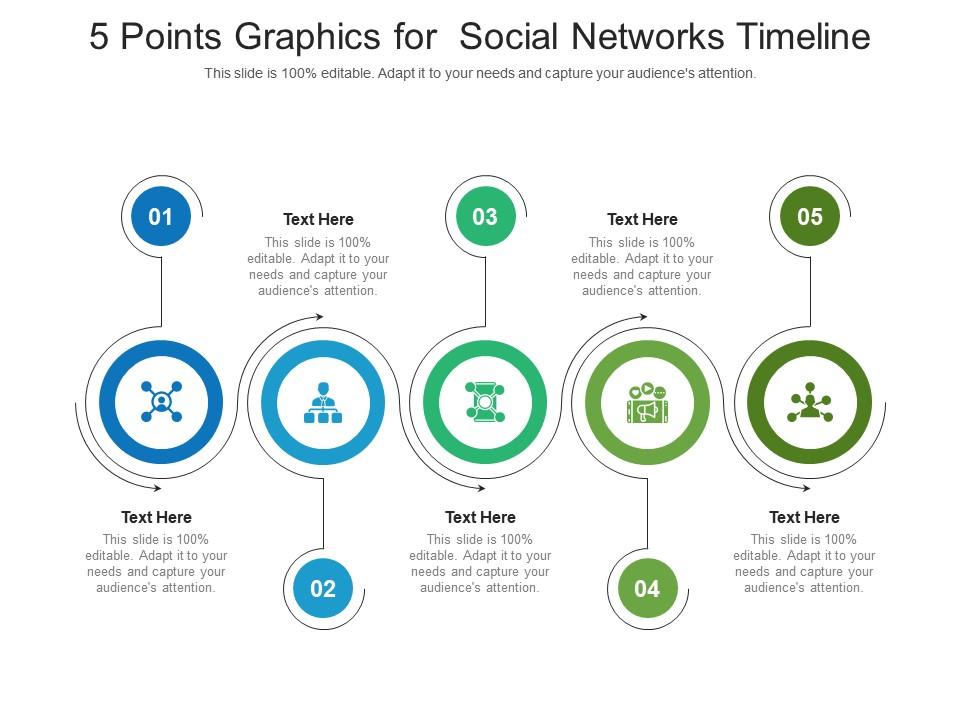
Template 2: Five-Point Graphic for Social Networks Timeline Infographic Template
This attractive PPT presentation design on timelines is meant to give you a five-stage process for your business needs. The icons add that needed zest and provide the much-desired backdrop for social media networks timeline. Use it to grow your network, sensitize your team to deadlines, and deliver results. The timelines function as valuable guidelines to achieve roles and objectives. Download now.
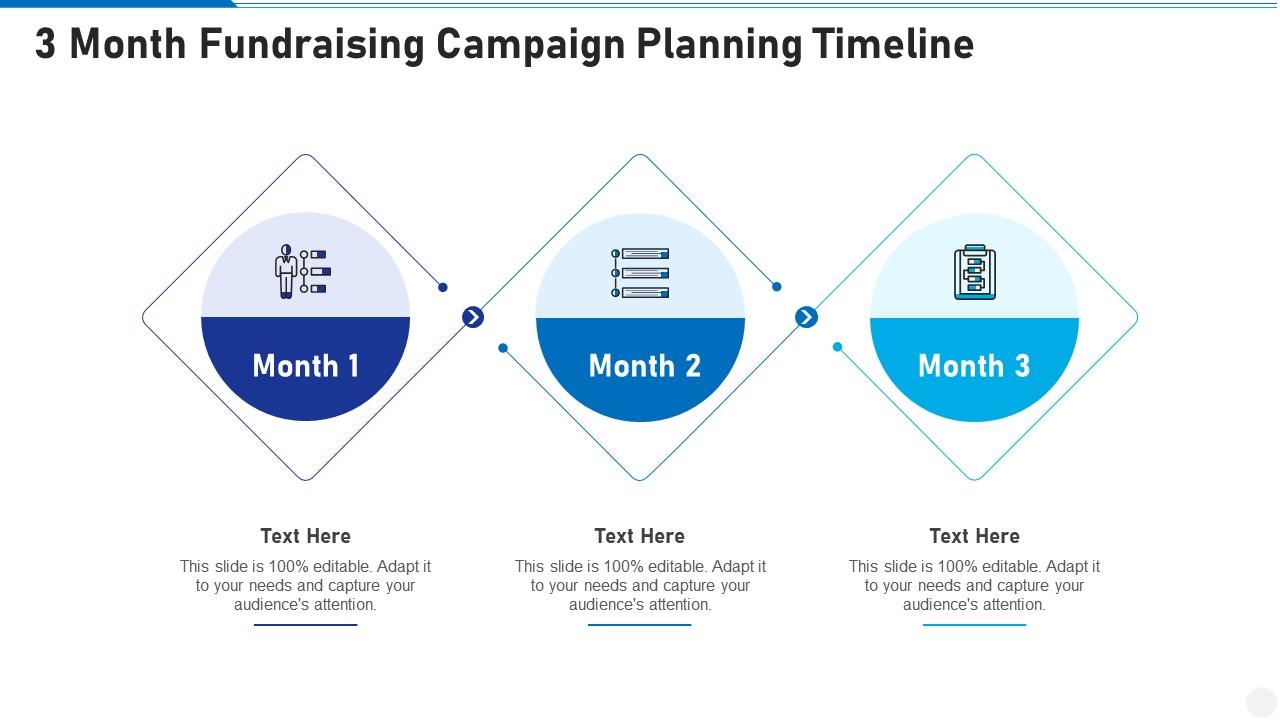
Template 3: Three-month Fundraising Campaign Planning Timeline Infographic Template
Use this PowerPoint Presentation to plan your fundraising campaign in terms of getting the team ready in the first month. For the second month use the icons as the symbol to get everything thing in place, and by Month 3, have something to show for it in the piggy box (the icon). This attractive template design gives you the icons that fit the bill perfectly. Download now to achieve results through your three-month fund-raising campaign planning timeline.
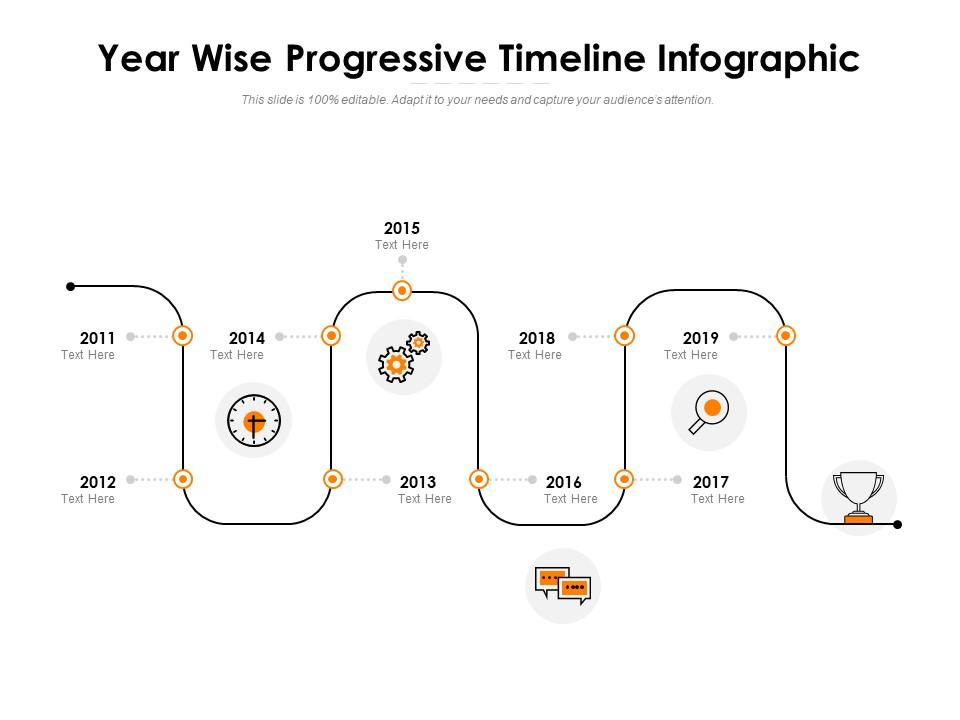
Template 4: Year-wise Progressive Timeline Infographic
Time signals progress, which this PPT Presentation aptly illustrates through its year-wise progressive timeline infographic. The gear icons and the clock signal time and progress with the cup of glory awaiting those who manage it well. This is a nine-stage process, though you can have it in as many stages as you like with the same design elements. Use it to generate curiosity in your audience about your plans. Download now!
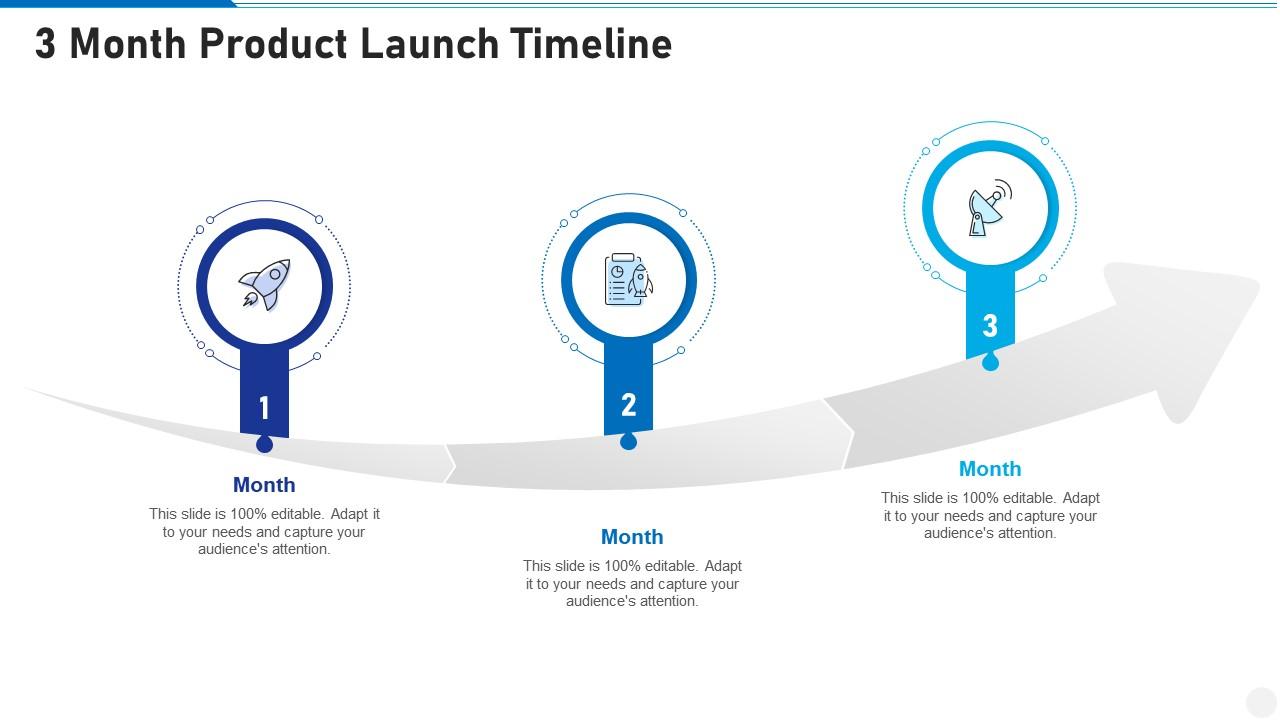
Template 5: Three-month Product Launch Timeline Infographic Template
This PPT representation is meant to give you the perfect template to showcase your product launch timeline plans. The skilled vector-based graphic uses icons that can represent most major products. The industry standard design, is again curated for three months, as this is the established timeline in which businesses expect results to show, one way or the other. Use this template to help your audience reinforce the positive actions of your target audience. Download this versatile template now.
Template 6: Three-month Business Strategy Timeline Infographic Template
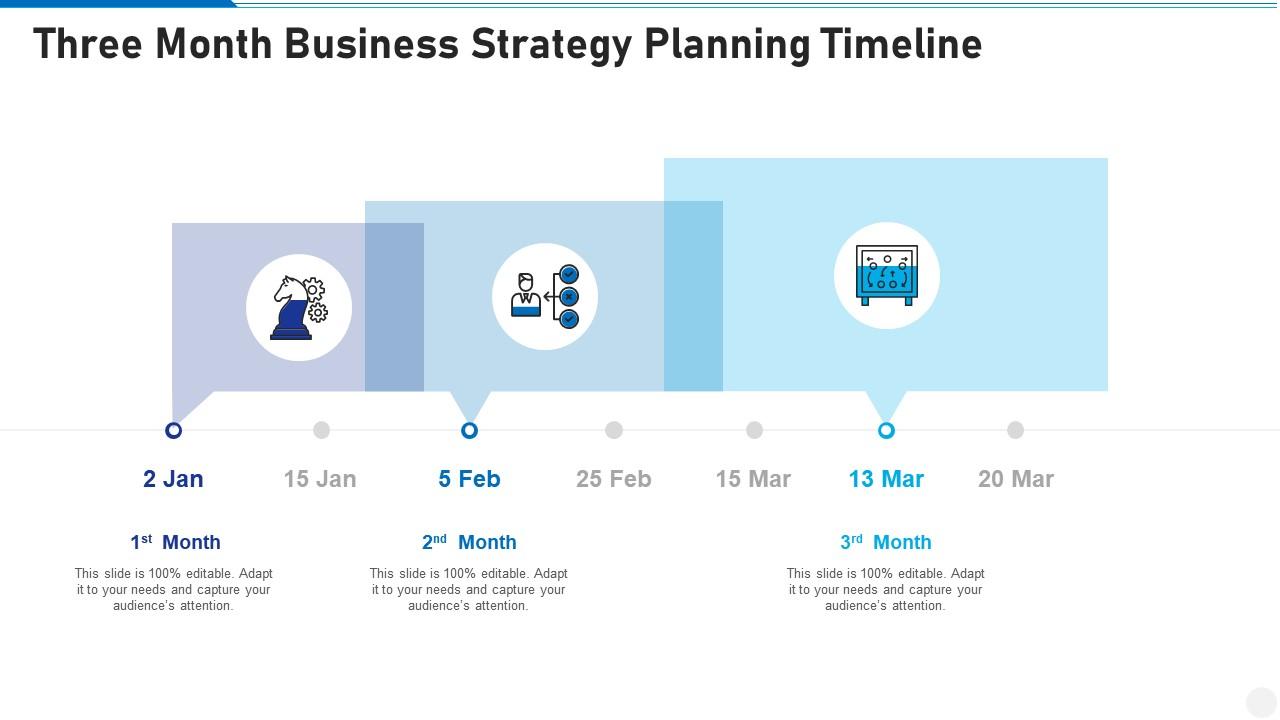
This well-structured format on business strategy planning timeline infographic template is a resourceful set for all business stakeholders. The insightful icons and the horizontal timeline allow you to choose your own three-month period where you want your strategy to deliver results. Besides the timeline, you can add text boxes to explain complex concepts to your audience. Use this template to your advantage using visuals that persuade and convince your clients, team, and the top management. Download now.
Template 7: Six-Phase Timeline Infographic for Financial Planning Process
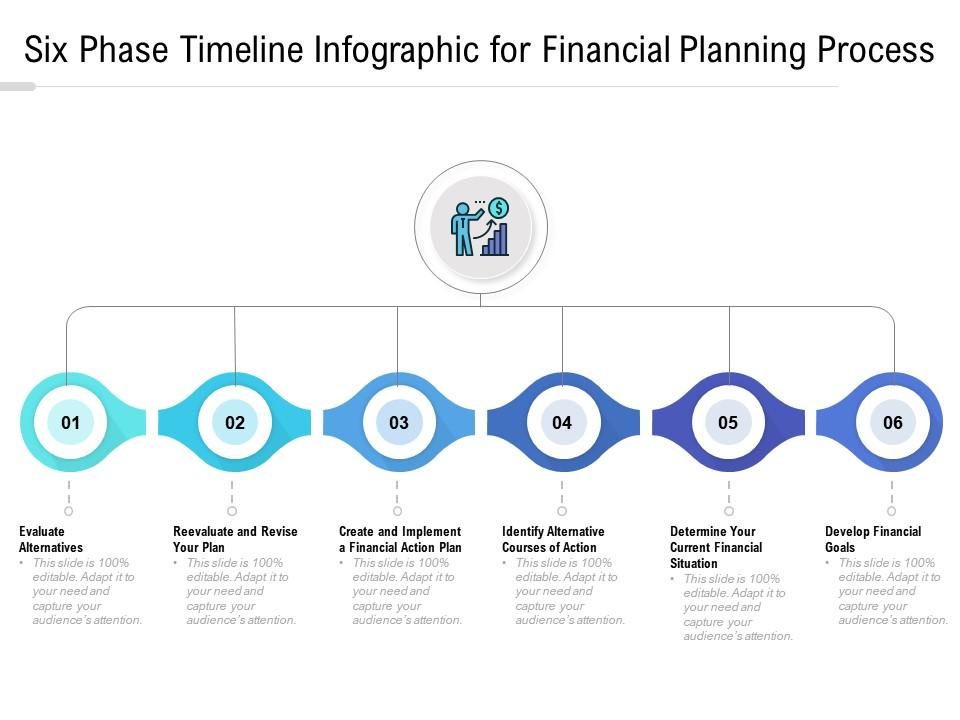
Time is money, so this six-phase timeline infographic is the perfect PPT Presentation that you can have for your financial planning process. Use it to exhibit your mastery in each of the six steps. Evaluating alternatives, revaluating and revising it before creating, and implementing a financial election plan. In the fourth timeline phase, you evaluate alternative courses of action based on your current financial situation. In the last timeline phase, you develop financial goals. Since finance is a sensitive topic with growing your money over time the main aim of business, the suggested timeline is six months for each stage though you can have your own, depending on your business and inclination. Download now!
Template 8: Parallel Timeline Infographic For Business Processes
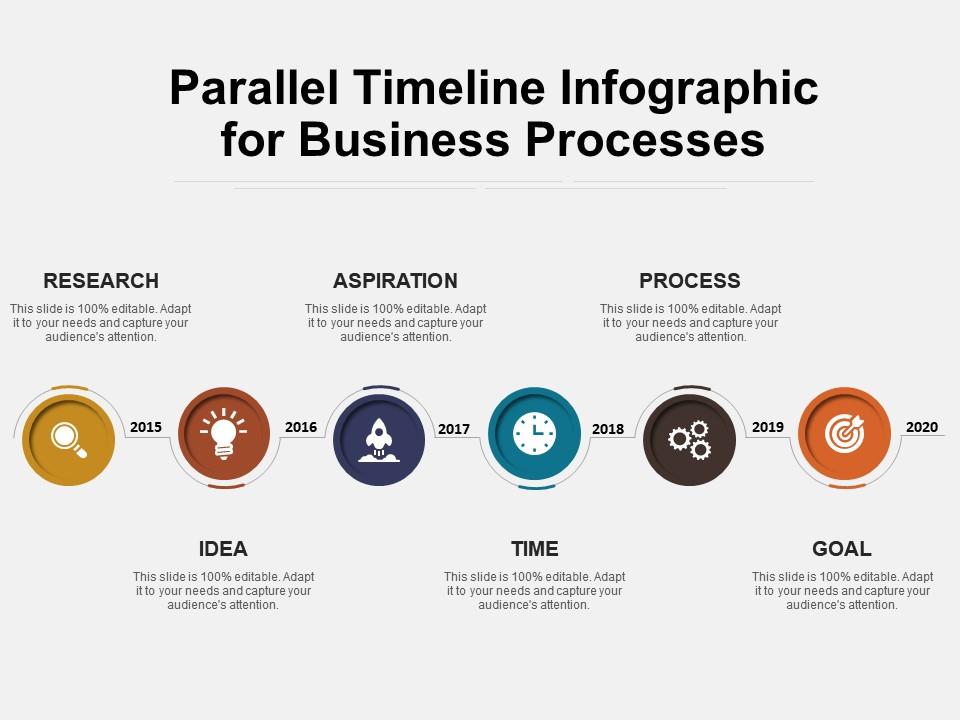
Use this PowerPoint Presentation to crack your business process and turn it into an outstanding resource. Explain to your audience how to go from research to goal, with this parallel timeline infographic, especially for business processes. The six stages in mastering any business process are research; ideate; aspiration (setting ambitious goals); timelines, the process itself, and finally arriving at your goal. The time limit for each of the stages is one year in this case, though for shorter projects, it could be quarterly or half yearly. Download now to help your clients unlock hidden efficiencies and achieve a reputation for consistent quality delivery.
Template 9: 3D Infographic Timeline with Multiple Icons PowerPoint Template
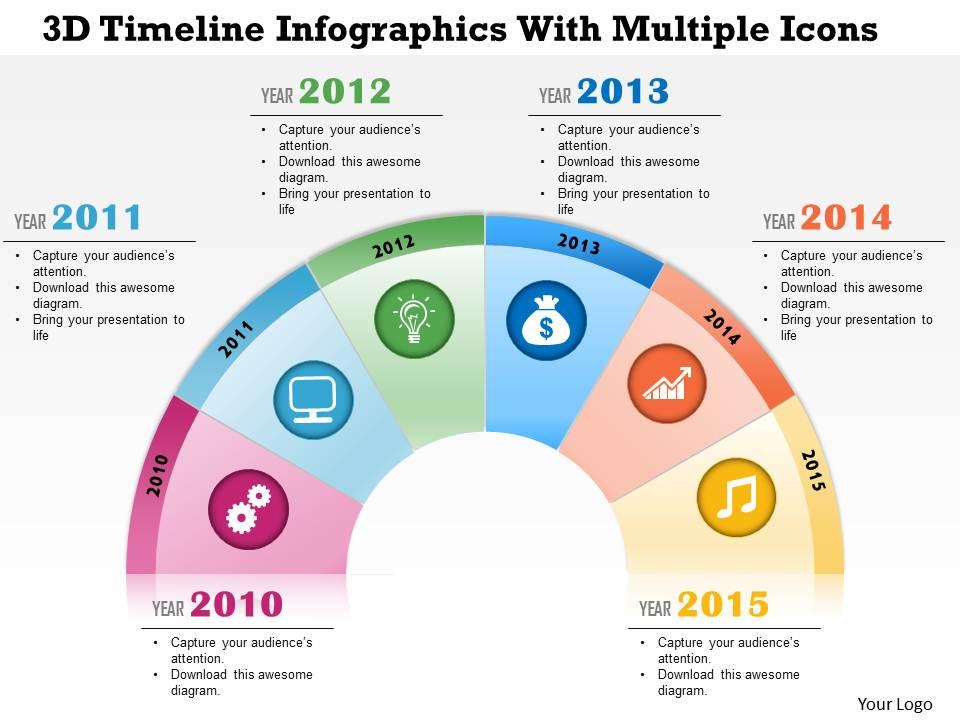
This PPT Presentation will help you promote your business through 3D timeline infographics to make sure your team and clients understand the importance of representing time in a well-designed, symmetrical format. The 3D icons representing processes, marketing, ideas money, progress, and successful execution add up to give the audience supreme confidence in your ability to drive and deliver results. Add your chosen timeframe to this wonderful template, where you also get functional space to express key result areas from each timeline. Download now and impress your clients enough to win deals.
Template 10: Seven-staged Timeline Infographics Diagram PPT Templates
Seven is a highly popular number, be it for habits, or for drawing up a timeline in seven stages. Use this timeline to illustrate how you move from the drawing board to getting support for the idea and finally hitting the bull’s eye in the 7th stage of the timeline. The icons are so wonderfully designed that the purpose of each stage is expressly clear without the use of words, or you having to spell these out, when you deliver the presentation. Still, there are enough bullet points under each staircase-shaped stage to help you make your point before a roomful of audience, comprising stakeholders looking at their unique interests and value-points from the presentation. Get this presentation now to make an impact, and have businesses plan their future.
Template 11: Parallel Timeline Infographic Showing Roadmap
Without a roadmap, timelines can be superfluous. This PPT Presentation, also arranged in the form of the route to achieve goals, is your ticket to winning clients through your expertise in timeline drawing and roadmap planning. The time duration of each step can be customized, and business journey from starting out to having some market say. Download now to make a difference and achieve goals with flair.
Template 12: Parallel Timeline Infographic for Data Analysis
This PPT Presentation showcases data analysis over a timeline in which businesses can subject all their processes to scrutiny. Since this is an intellectually-taxing process, the timeline in this case is a bit compressed. As always, you may have your own lengths of time over which you want results. The steps involved are project kickoff, project alignment, stakeholder buy-in, resource selection, team creation, start of Data collection, analysis, design, testing and analysis, and finally re-design if needed. Download this template now.
RESPECT THE TIME FORCE
There is nothing as important in business as offering the right thing at the right time at the right price. In the triad of RIGHTS, it is time that is the king. Hence, a timeline infographic depicting Key Result Areas (KRAs) from a strategic time-bound plan makes so much more sense. Use SlideTeam’s Timeline Infographic Templates to showcase your mastery of this concept to clients. Master time and business success is as certain as the day following night.
Another critical input to business success is the diversity and inclusion present across its rank and file. You can access our comprehensive training course on diversity, inclusion, and equity to ensure you master its introduction to your business. Inclusive leadership is also part of the course, that has complete training material included. Click here to access the life-transformation course for you, personally, and for your organization to emerge as an institution par excellence in diversity practices and inclusion.
P.S. Another way to respect timelines and make them work according to expectations is to master maintenance, and prevent expensive equipment breakdowns. For this, preventive maintenance is the globally-accepted benchmark. Adopt it into your organization as the best-practice from today onwards. Access the best-in-class presentation templates to master preventive maintenance with a click here.
FAQs on Timeline Infographics
What is a timeline infographic?
Mapping time to business results or strategies in a visually engaging way creates a timeline infographic. It is a wonderful way to organize and manage your goals, linking these to tasks, and finally producing business results that are resource friendly. Timeline infographics can be of many kinds, depending on the purpose and the visual shape you want to give it. Roadmaps, staircase, and circular designs are the most popular. Ultimately, a timeline graphic is a business tool that increase productivity and enhance goal setting capabilities with judicious use.
How do I make an infographic timeline?
There are two aspects to creating an infographic timeline. The first is the design element, which you can get pre-made from software and the second is the use to which the timeline graphic will be subjected. In both cases, we recommend originality as your business situation and design inclinations may not be present in any readymade software. Both structure and flexibility are needed, which most software cannot provide. Using dedicated professionals for your own need is the best way out and SlideTeam is the best option in this. Practically, your own timeline infographic will fit your needs to the T, and we help you do that.
What are the seven types of infographics?
Categorization is always good, and so is the case for timeline infographics. Based on standard designs, business needs, and visualization principles there are seven kinds of infographics. These are Timelines; Data visualizations; Anatomy; Processes; Comparisons; Lists and Maps, especially roadmaps. Each has been mapped to specific business need or pain point, which improves speed as you go about designing one for your own unique need. Yet, as stated in the FAQ above, remember to consult or avail professional services to get the best results. If you do this, you also get more bandwidth to focus on your core business competencies.




 Customer Reviews


