If you don’t know your nearest competitor and cannot tell the distance between them and your businesses, you will likely be behind in the race. Considering this, a business comparison between the two companies is essential.
Not only does this two-company comparison prove to be a source of credible information on business environment, but it also reveals hidden competencies and sources of weaknesses that may not otherwise be obvious. For instance, comparisons on EBITA (Earnings Before Interest, Depreciation, and Tax) may show that Company 1 is way ahead of Company 2. But this must come true through other parameters, such as revenue and sales comparison OR the comparison and market share, etc. With two-company comparison; one can quickly know what is driving growth across companies and to what effect.
Vendor comparison is critical to business efficiency. Get these templates here.
To do this well, the process involves drawing up presentation templates depicting the numbers, the direction of the comparison, and the result. This is tedium personified, a major waste of top executive time if you are working for a major business corporation. At SlideTeam, we work to ensure that we curate top-quality templates that are content-ready and serve to amplify the point you are making when addressing stakeholders.
Comparison over time is also a way to evaluate businesses. Find the best slides here.
Each presentation is 100% editable and customizable, offering structure and a starting point. The editability feature means you can tailor each presentation to the audience you are about to address.
Let's explore!
TEMPLATE 1 Data-Driven Comparison Between Two Companies
Use this PPT Template to compare two companies of equal sizes on growth. The slide provides many exciting comparisons to help you analyze sectors, growth areas, revenue, sales, employees, and more. In any case, the template acts as a source of great utility and strength in ensuring that a comparison between two companies is carried out well and is helpful for stakeholders, including investors, prospective customers, and so on. The point to be mindful of is to use numbers well and arrive at some definite view on the variables we are comparing vis-à-vis the two companies. Get the template now!
TEMPLATE 2 Comparison Butterfly Chart between 2 Companies and Products
Create a proper and aligned two-company comparison framework that meets your business expectations. Deploy this ready-to-use PowerPoint Template to design a structure or butterfly chart or compare two data sets simultaneously. This chart plots the data as two horizontal bars with the same X-axis in the center, resembling the butterfly wings represented in two different colors for the two companies. The slide uses this framework to compare such revenue from phones of two big companies, for instance. Then, businesses can use this same butterfly chart to compare debt, cost of capital, profit, revenue, number of employees, and more.
TEMPLATE 3 Comparing 2 Companies Table PPT Examples Slides
Use this PPT Template to compare two companies on five crucial and critical parameters that feed into the basic behavior and choices that companies can make. Thus, you can compare overview and profile, competitive advantage, target market, market share, and marketing strategies. Deploy this flexible and predesigned PowerPoint Graphic to make comparisons between you and your biggest competitor visible and clear to your team and management.
TEMPLATE 4 Different Companies Quarterly Sales Data Comparisons in Two Years PPT
Compare up to 10 companies on Year-on-Year percentage growth in sales over the same quarter. It could be Q1 2016 over Q1 2017, as shown in the samples, or any other years and quarters you choose, but follow the same formula. The key to making this PPT Template super-useful is understanding that such a comparison gives you a total of the companies, indicating the economy's health.
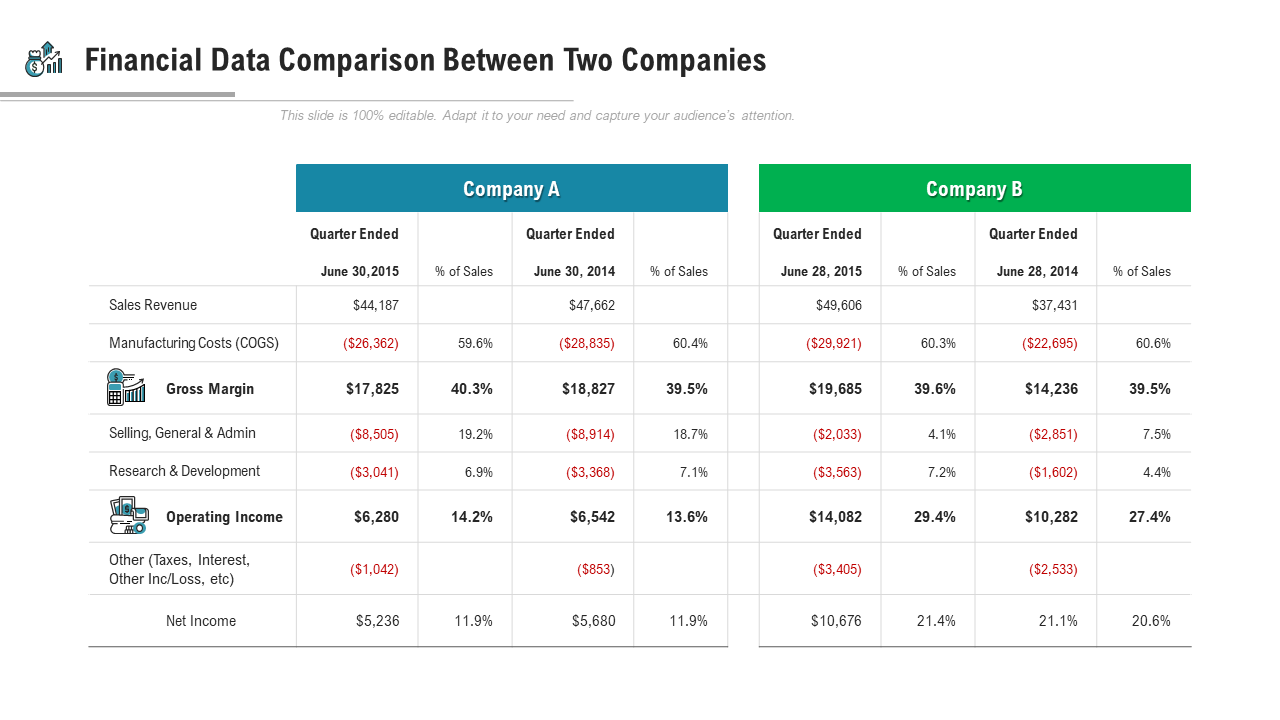
TEMPLATE 5 Financial data comparison between two companies
This comprehensive PPT Template on financial data comparison is an excellent tool for comparing two companies. Its strength and the USP is the depth to which it takes the comparison: Over two years and on the same data Y-o-Y. Even better, each dozen-odd variable is compared and tabulated as a % of sales, with finance always carrying a cost to it. We have collated the leading gross margin, operating income, and net income figures for those needing the headlines. Get this template now to understand how companies' finances place them vis-à-vis each other.
TEMPLATE 6 Comparing two companies showing cash equivalents and accounts receivable
To understand which company is better placed to handle a liquidity crisis and is more solvent in general, we can compare cash equivalents using this PPT Template. This company comparison between two well-run enterprises involves placing and analyzing each company's significant cash indices equivalents on this well-designed slide. The parameters compared include short-term investments, accounts receivables, inventories, property, plant and equipment, net goodwill, accounts payable, and long-term debt.
TEMPLATE 7 Comparing 2 Companies' Balance Sheet PPT Diagrams
This is a readymade PowerPoint Template to help you create a framework to compare two companies' balance sheets. Explain the actual financial position of your company to the investors with this readymade PPT template, where you need to replace the sample text with your company's figures. This way, your investors can get a clear idea about the assets and liabilities of your company and can compare it with the other company. This comparative analysis provides significant details to your investors, shareholders, and employees. Using this slide, you can get a clear idea of the cash, plant and machinery, land and building, and the amount invested by the investors.
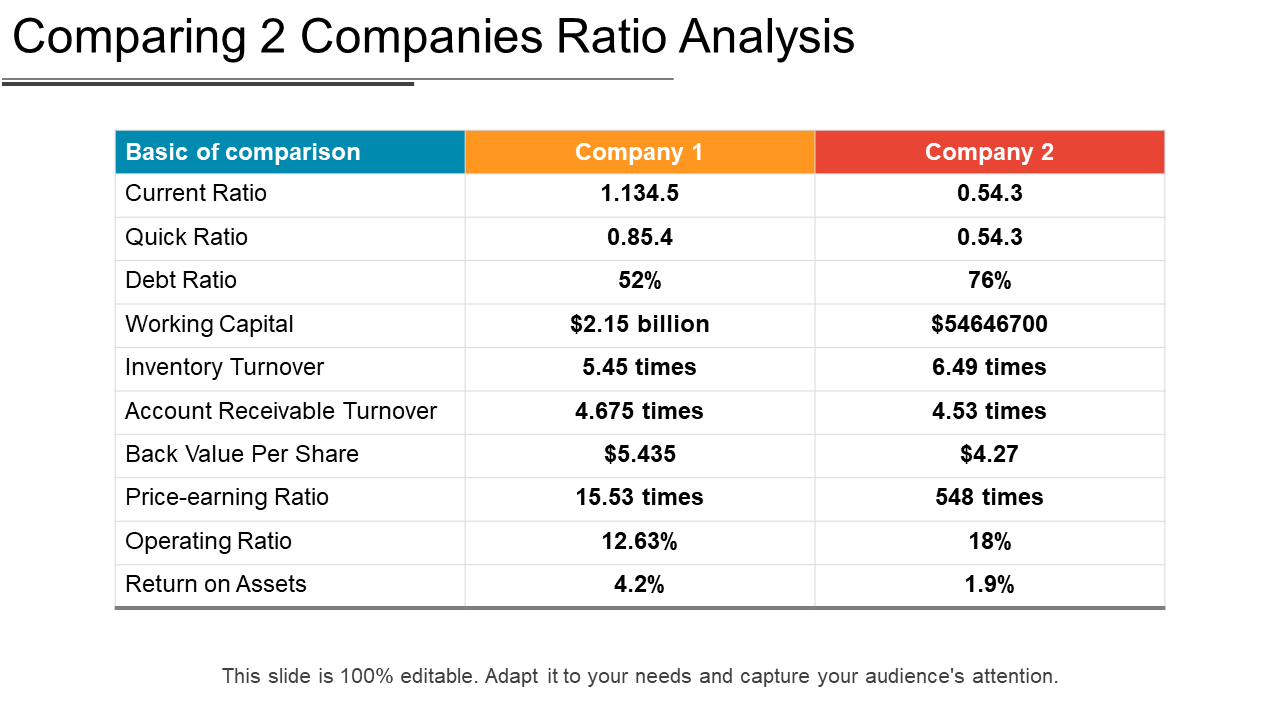
TEMPLATE 8 Comparing 2 Companies Ratio Analysis PPT Icon
Ratios are easy to understand and simple to compute. Use the financial ratios PPT chart to compare your company with different industries. Analyze where your business stands financially with the help of our financial ratio company valuation PPT slide. You can help both the management and investors evaluate your company's ability to convert its investments in assets into profits. Show how efficiently your company can convert the money to purchase assets into net income or profits. You can gauge your firm's ability to generate profits from its shareholder's investments in the company. Create a company comparison chart to evaluate your financial standing in the market.
TEMPLATE 9 Comparing 2 Companies' Brand Specifications
Businesses can also analyze using this brand specification template and know why your competitors' brand is superior to yours. You can add more fields or remove specific fields per your requirements. It is a two-stage brand comparison template. By comparing the brands using this slide, you can emphasize those that need more attention or improvement. This way, your audience will also get a clear idea of which brands your company is better. Use this pricing breakdown PPT Template to demonstrate a clear investment structure for hiring your agency's collaboration solutions services. This presentation template includes pricing information for services like customer analysis and consultation and work descriptions, costs per task, unit costs, and quantity costs. Clients will be making informed financial decisions and comprehend their return on investment (ROI) much better after a look at this resource. Get it now!
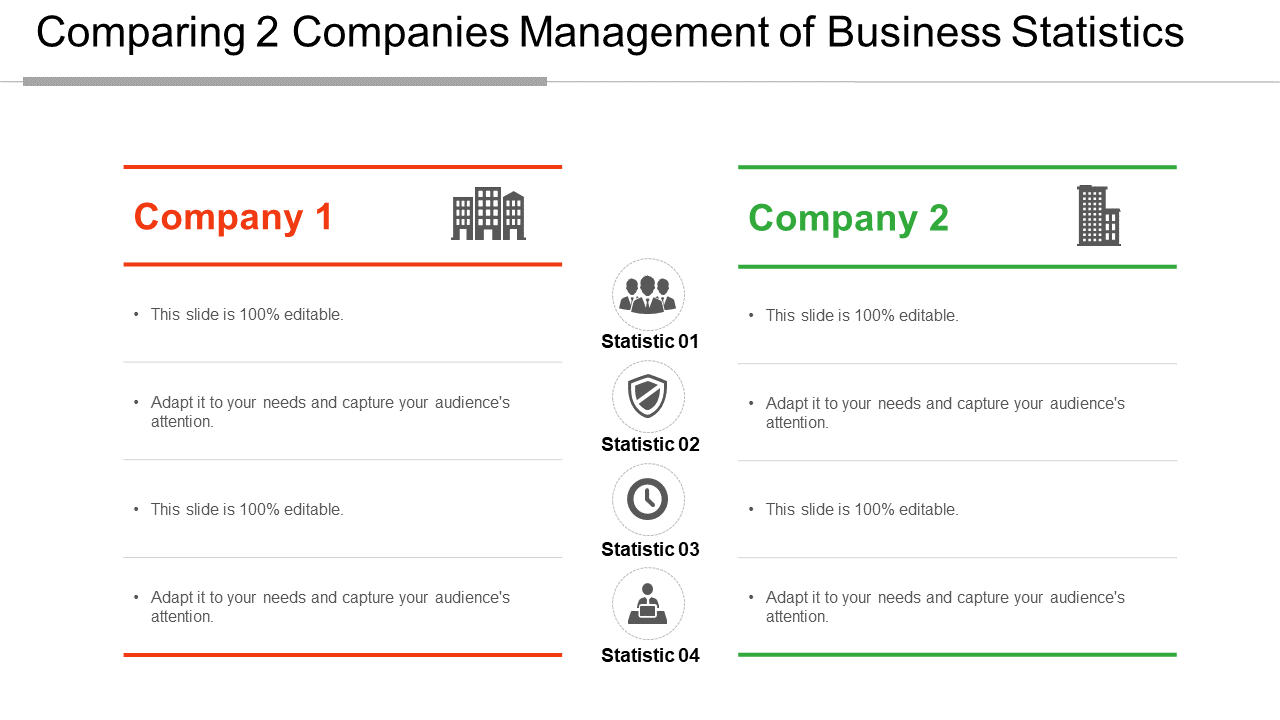
TEMPLATE 10 Comparing 2 Companies Management of Business Statistics PPT Slides
Imagine having all your comparison points with another company organized well. This dynamic template allows you to make good decisions related to financial analysis, auditing, production, etc. Using this PPT slide, you can easily demonstrate the tools and techniques used in managerial problems for decision making. Visual communication with our PPT templates enhances the employees' core competencies for achieving the objectives. With his PPT presentation slide, you can develop strategic plans for your organization directing your employees. You can compare the business statics of your organization with that of the others. The slide helps you analyze areas to improve to manage statistics well. Get the slide today!
SCAN THE ENVIRONMENT
Comparisons in business are environment, as they throw up qualitative differences and quantitative gaps for analysis and improvement for both the winner and the loser. Hence, two-company comparisons are required and mandatory exercises for the entire ecosystem to gain. There is no better way to do this than SlideTeam Templates on the two-company comparison.
PS Appropriate assessment is the need of the hour, Be it financials, operational factors, or any other parameter. Find best-in-class company snapshots here.


 Customer Reviews


