KPI Dashboard, Excel and Metrics PPT Templates
-
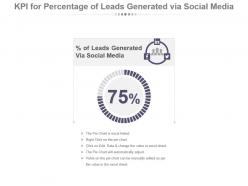 Kpi for percentage of leads generated via social media ppt slide
Presenting kpi for percentage of leads generated via social media ppt slide. This presentation slide shows one Key Performance Indicators or KPIs in a Dashboard style design. The first KPI that can be shown is percentage of Leads Generated Via Social Media. These KPI Powerpoint graphics are all data driven, and the shape automatically adjusts according to your data. Just right click on the KPI graphic, enter the right value and the shape will adjust automatically. Make a visual impact with our KPI slides.
-
 Social media marketing kpi for product ideas people feedback powerpoint slide
Presenting social media marketing kpi for product ideas people feedback powerpoint slide. This presentation slide shows three Key Performance Indicators or KPIs in a Dashboard style design. The first KPI that can be shown is Number of Product Ideas Submitted to Brand in an Open Online Forum. The second KPI is Number of People That Submitted Product Ideas Brand in an Open Online Forum and the third is Number of People That Provided Feedback on Brand Website. These KPI Powerpoint graphics are all data driven, and the shape automatically adjusts according to your data. Just right click on the KPI graphic, enter the right value and the shape will adjust automatically. Make a visual impact with our KPI slides.
-
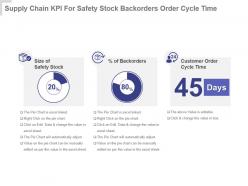 Supply chain kpi for safety stock backorders order cycle time presentation slide
Presenting supply chain kpi for safety stock backorders order cycle time presentation slide. This presentation slide shows three Key Performance Indicators or KPIs in a Dashboard style design. The first KPI that can be shown is Size of Safety Stock. The second KPI is percentage of Backorders and the third is Customer Order Cycle Time. These KPI Powerpoint graphics are all data driven, and the shape automatically adjusts according to your data. Just right click on the KPI graphic, enter the right value and the shape will adjust automatically. Make a visual impact with our KPI slides.
-
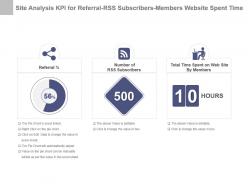 Site analysis kpi for referral rss subscribers members website spent time ppt slide
Presenting site analysis kpi for referral rss subscribers members website spent time ppt slide. This presentation slide shows three Key Performance Indicators or KPIs in a Dashboard style design. The first KPI that can be shown is Referral Percentage. The second KPI is Number of RSS Subscribers and the third is Total Time Spent on Web Site By Members. These KPI Powerpoint graphics are all data driven, and the shape automatically adjusts according to your data. Just right click on the KPI graphic, enter the right value and the shape will adjust automatically. Make a visual impact with our KPI slides.
-
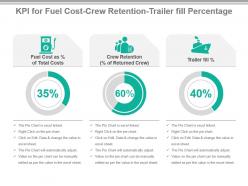 Kpi for fuel cost crew retention trailer fill percentage powerpoint slide
Presenting kpi for fuel cost crew retention trailer fill percentage powerpoint slide. This presentation slide shows three Key Performance Indicators or KPIs in a Dashboard style design. The first KPI that can be shown is Fuel Cost as percentage of Total Costs. The second KPI is Crew Retention percentage of Returned Crew and the third is Trailer fill percentage. These KPI Powerpoint graphics are all data driven, and the shape automatically adjusts according to your data. Just right click on the KPI graphic, enter the right value and the shape will adjust automatically. Make a visual impact with our KPI slides.
-
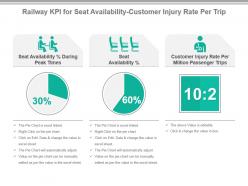 Railway kpi for seat availability customer injury rate per trip ppt slide
Presenting railway kpi for seat availability customer injury rate per trip ppt slide. This presentation slide shows Three Key Performance Indicators or KPIs in a Dashboard style design. The first KPI that can be shown is Seat Availability Percentage During Peak Times. The second KPI is Seat Availability Percentage. The third is Customer Injury Rate Per Million Passenger Trips. These KPI Powerpoint graphics are all data driven, and the shape automatically adjusts according to your data. Just right click on the KPI graphic, enter the right value and the shape will adjust automatically. Make a visual impact with our KPI slides.
-
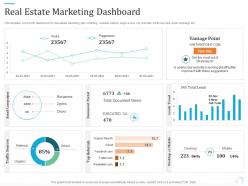 Real estate marketing dashboard marketing plan for real estate project
This template covers KPI dashboard for real estate marketing plan including website visitors, page review, top referrals, traffic sources, email campaign etc. Present the topic in a bit more detail with this Real Estate Marketing Dashboard Marketing Plan For Real Estate Project. Use it as a tool for discussion and navigation on Real Estate Marketing Dashboard. This template is free to edit as deemed fit for your organization. Therefore download it now.
-
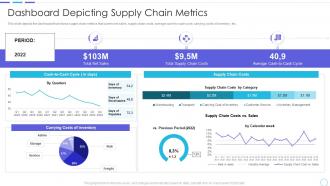 Cost benefits iot digital twins implementation dashboard depicting supply chain metrics
This slide depicts the dashboard that shows supply chain metrics that covers net sales, supply chain costs, average cash-to-cash cycle, carrying costs of inventory, etc. Deliver an outstanding presentation on the topic using this Cost Benefits Iot Digital Twins Implementation Dashboard Depicting Supply Chain Metrics. Dispense information and present a thorough explanation of Dashboard Depicting Supply Chain Metrics using the slides given. This template can be altered and personalized to fit your needs. It is also available for immediate download. So grab it now.
-
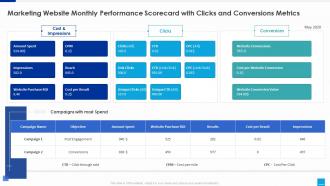 Marketing website marketing website monthly performance scorecard clicks conversions metrics
Present the topic in a bit more detail with this Marketing Website Marketing Website Monthly Performance Scorecard Clicks Conversions Metrics. Use it as a tool for discussion and navigation on Performance, Scorecard, Conversions. This template is free to edit as deemed fit for your organization. Therefore download it now.
-
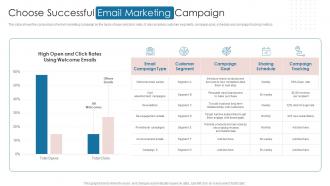 Choose Successful Email Marketing Campaign Digital Automation To Streamline Sales Operations
This slide shows the comparison of email marketing campaign on the basis of open and click rates. It also includes customer segments, campaign goal, schedule and campaign tracking metrics. Present the topic in a bit more detail with this Choose Successful Email Marketing Campaign Digital Automation To Streamline Sales Operations. Use it as a tool for discussion and navigation on Successful, Marketing, Campaign. This template is free to edit as deemed fit for your organization. Therefore download it now.
-
 Measure facebook kpi content powerpoint ppt template bundles
Introduce your topic and host expert discussion sessions with this Measure Facebook KPI Content Powerpoint Ppt Template Bundles. This template is designed using high-quality visuals, images, graphics, etc, that can be used to showcase your expertise. Different topics can be tackled using the eleven slides included in this template. You can present each topic on a different slide to help your audience interpret the information more effectively. Apart from this, this PPT slideshow is available in two screen sizes, standard and widescreen making its delivery more impactful. This will not only help in presenting a birds-eye view of the topic but also keep your audience engaged. Since this PPT slideshow utilizes well-researched content, it induces strategic thinking and helps you convey your message in the best possible manner. The biggest feature of this design is that it comes with a host of editable features like color, font, background, etc. So, grab it now to deliver a unique presentation every time.
-
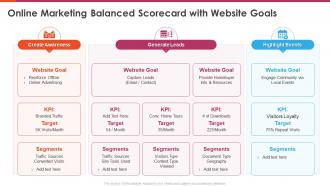 Marketing balanced scorecard online marketing balanced scorecard with website goals
Present the topic in a bit more detail with this Marketing Balanced Scorecard Online Marketing Balanced Scorecard With Website Goals. Use it as a tool for discussion and navigation on Create Awareness, Generate Leads, Highlight Events, Goal, Kpi, Target, Segments. This template is free to edit as deemed fit for your organization. Therefore download it now.
-
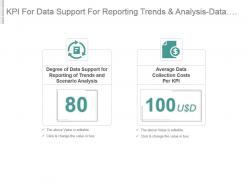 Kpi for data support for reporting trends and analysis data collection costs powerpoint slide
Presenting kpi for data support for reporting trends and analysis data collection costs powerpoint slide. This presentation slide shows two Key Performance Indicators or KPIs in a Dashboard style design. The first KPI that can be shown is Degree of Data Support for Reporting of Trends and Scenario Analysis. The second KPI is Average Data Collection Costs Per KPI. These KPI Powerpoint graphics are all data driven, and the shape automatically adjusts according to your data. Just right click on the KPI graphic, enter the right value and the shape will adjust automatically. Make a visual impact with our KPI slides.
-
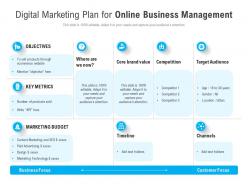 Digital marketing plan for online business management
Introducing our Digital Marketing Plan For Online Business Management set of slides. The topics discussed in these slides are Objectives, Key Metrics, Marketing Budget, Timeline, Channels. This is an immediately available PowerPoint presentation that can be conveniently customized. Download it and convince your audience.
-
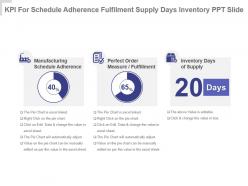 Kpi for schedule adherence fulfilment supply days inventory ppt slide
Presenting kpi for schedule adherence fulfilment supply days inventory ppt slide. This presentation slide shows three Key Performance Indicators or KPIs in a Dashboard style design. The first KPI that can be shown is Manufacturing Schedule Adherence. The second KPI is Perfect Order Measure Fulfillment and the third is Inventory Days Of Supply. These KPI Powerpoint graphics are all data driven, and the shape automatically adjusts according to your data. Just right click on the KPI graphic, enter the right value and the shape will adjust automatically. Make a visual impact with our KPI slides.
-
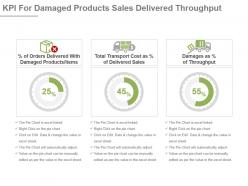 Kpi for damaged products sales delivered throughput presentation slide
Presenting kpi for damaged products sales delivered throughput presentation slide. This presentation slide shows Three Key Performance Indicators or KPIs in a Dashboard style design. The first KPI that can be shown is Percentage of Orders Delivered With Damaged Products Items. The second KPI is Total Transport Cost as Percentage of Delivered Sales. The third is Damages as Percentage of Throughput. These KPI Powerpoint graphics are all data driven, and the shape automatically adjusts according to your data. Just right click on the KPI graphic, enter the right value and the shape will adjust automatically. Make a visual impact with our KPI slides.
-
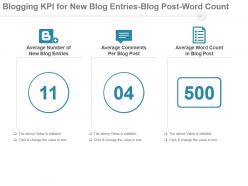 Blogging Kpi For New Blog Entries Blog Post Word Count Ppt Slide
Presenting blogging kpi for new blog entries blog post word count ppt slide. This presentation slide shows Three Key Performance Indicators or KPIs in a Dashboard style design. The first KPI that can be shown is Average Number of New Blog Entries. The second KPI is Average Comments Per Blog Post. The third is Average Word Count in Blog Post. These KPI Powerpoint graphics are all data driven, and the shape automatically adjusts according to your data. Just right click on the KPI graphic, enter the right value and the shape will adjust automatically. Make a visual impact with our KPI slides.
-
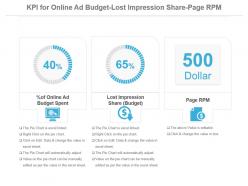 Kpi for online ad budget lost impression share page rpm ppt slide
Presenting kpi for online ad budget lost impression share page rpm ppt slide. This presentation slide shows Three Key Performance Indicators or KPIs in a Dashboard style design. The first KPI that can be shown is Percentage of Online Ad Budget Spent. The second KPI is Lost Impression Share Budget. The third is Page RPM. These KPI Powerpoint graphics are all data driven, and the shape automatically adjusts according to your data. Just right click on the KPI graphic, enter the right value and the shape will adjust automatically. Make a visual impact with our KPI slides.
-
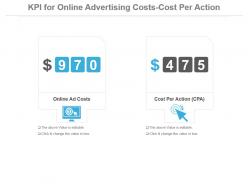 Kpi for online advertising costs cost per action presentation slide
Presenting kpi for online advertising costs cost per action presentation slide. This presentation slide shows Two Key Performance Indicators or KPIs in a Dashboard style design. The first KPI that can be shown is Online Ad Costs . The second KPI is Cost Per Action or CPA. These KPI Powerpoint graphics are all data driven, and the shape automatically adjusts according to your data. Just right click on the KPI graphic, enter the right value and the shape will adjust automatically. Make a visual impact with our KPI slides.
-
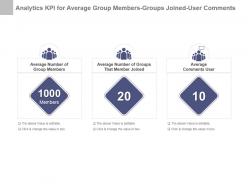 Analytics kpi for average group members groups joined user comments powerpoint slide
Presenting analytics kpi for average group members groups joined user comments powerpoint slide. This presentation slide shows three Key Performance Indicators or KPIs in a Dashboard style design. The first KPI that can be shown is Average Number of Group Members. The second KPI is Average Number of Groups That Member Joined and the third is Average Comments User. These KPI Powerpoint graphics are all data driven, and the shape automatically adjusts according to your data. Just right click on the KPI graphic, enter the right value and the shape will adjust automatically. Make a visual impact with our KPI slides.
-
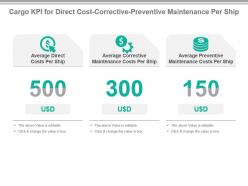 Cargo kpi for direct cost corrective preventive maintenance per ship powerpoint slide
Presenting cargo kpi for direct cost corrective preventive maintenance per ship powerpoint slide. This presentation slide shows three Key Performance Indicators or KPIs in a Dashboard style design. The first KPI that can be shown is Average Direct Costs Per Ship. The second KPI is Average Corrective Maintenance Costs Per Ship and the third is Average Preventive Maintenance Costs Per Ship. These KPI Powerpoint graphics are all data driven, and the shape automatically adjusts according to your data. Just right click on the KPI graphic, enter the right value and the shape will adjust automatically. Make a visual impact with our KPI slides.
-
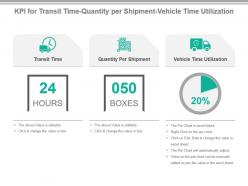 Kpi for transit time quantity per shipment vehicle time utilization presentation slide
Presenting kpi for transit time quantity per shipment vehicle time utilization presentation slide. This presentation slide shows three Key Performance Indicators or KPIs in a Dashboard style design. The first KPI that can be shown is Transit Time. The second KPI is Quantity Per Shipment and the third is Vehicle Time Utilization. These KPI Powerpoint graphics are all data driven, and the shape automatically adjusts according to your data. Just right click on the KPI graphic, enter the right value and the shape will adjust automatically. Make a visual impact with our KPI slides.
-
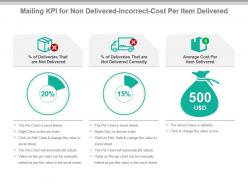 Mailing kpi for non delivered incorrect cost per item delivered ppt slide
Presenting mailing kpi for non delivered incorrect cost per item delivered ppt slide. This presentation slide shows Three Key Performance Indicators or KPIs in a Dashboard style design. The first KPI that can be shown is Percentage of Deliveries That are Not Delivered. The second KPI is Percentage of Deliveries That are Not Delivered Correctly. The third is Average Cost Per Item Delivered. These KPI Powerpoint graphics are all data driven, and the shape automatically adjusts according to your data. Just right click on the KPI graphic, enter the right value and the shape will adjust automatically. Make a visual impact with our KPI slides.
-
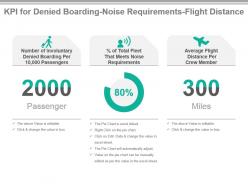 Kpi for denied boarding noise requirements flight distance ppt slide
Presenting kpi for denied boarding noise requirements flight distance ppt slide. This presentation slide shows three Key Performance Indicators or KPIs in a Dashboard style design. The first KPI that can be shown is Number of Involuntary Denied Boarding Per 10,000 Passengers. The second KPI is percentage of Total Fleet That Meets Noise Requirements and the third is Average Flight Distance Per Crew Member. These KPI Powerpoint graphics are all data driven, and the shape automatically adjusts according to your data. Just right click on the KPI graphic, enter the right value and the shape will adjust automatically. Make a visual impact with our KPI slides.
-
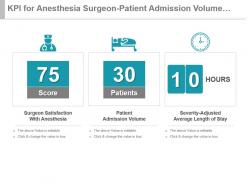 Kpi for anesthesia surgeon patient admission volume severity adjusted powerpoint slide
Presenting kpi for anesthesia surgeon patient admission volume severity adjusted powerpoint slide. This presentation slide shows three Key Performance Indicators or KPIs in a Dashboard style design. The first KPI that can be shown is Surgeon Satisfaction With Anesthesia. The second KPI is Patient Admission Volume and the third is Severity Adjusted Average Length of Stay. These KPI Powerpoint graphics are all data driven, and the shape automatically adjusts according to your data. Just right click on the KPI graphic, enter the right value and the shape will adjust automatically. Make a visual impact with our KPI slides.
-
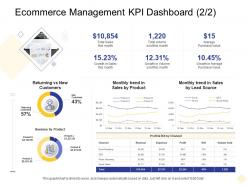 Ecommerce management kpi dashboard returning digital business management ppt elements
Present the topic in a bit more detail with this Ecommerce Management Kpi Dashboard Returning Digital Business Management Ppt Elements. Use it as a tool for discussion and navigation on Returning Vs New Customers, Monthly Trend In Sales By Product, Revenue By Product. This template is free to edit as deemed fit for your organization. Therefore download it now.
-
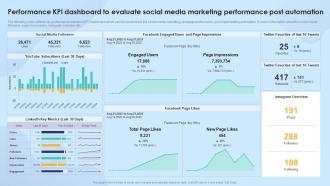 Strengthening Process Improvement Performance KPI Dashboard To Evaluate Social Media Marketing
The following slide outlines key performance indicator KPI dashboard which can be used to track the social media marketing campaign performance, post implementing automation. It covers information about the social media followers, page impressions, instagram overview, etc. Present the topic in a bit more detail with this Strengthening Process Improvement Performance KPI Dashboard To Evaluate Social Media Marketing. Use it as a tool for discussion and navigation on Social Media Followers, Facebook Engaged Users And Page Impressions, Twitter Favorites Of Last 10 Tweets, Facebook Page Likes, Page Impressions, Engaged Users. This template is free to edit as deemed fit for your organization. Therefore download it now.
-
 KPI Dashboard Snapshot Showing Warehouse Data And Fleet Status
Presenting our well structured KPI Dashboard Snapshot Showing Warehouse Data And Fleet Status. The topics discussed in this slide are Profit, Costs, Revenue. This is an instantly available PowerPoint presentation that can be edited conveniently. Download it right away and captivate your audience.
-
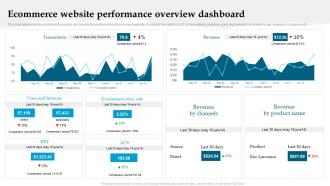 Ecommerce Website Performance Overview Dashboard Analyzing And Implementing Management System
This slide represents the dashboard to analyze and monitor the performance of ecommerce website. It includes key metrics such as transactions, revenue, users and sessions, ecommerce rate, revenue by channels etc. Present the topic in a bit more detail with this Ecommerce Website Performance Overview Dashboard Analyzing And Implementing Management System. Use it as a tool for discussion and navigation on Performance, Overview, Dashboard. This template is free to edit as deemed fit for your organization. Therefore download it now.
-
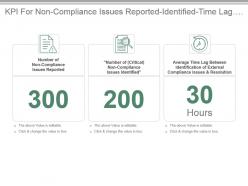 Kpi for non compliance issues reported identified time lag for identification presentation slide
Presenting kpi for non compliance issues reported identified time lag for identification presentation slide. This presentation slide shows three Key Performance Indicators or KPIs in a Dashboard style design. The first KPI that can be shown is Number of Non Compliance Issues Reported. The second KPI is Number of Critical Non Compliance Issues Identified and the third is Average Time Lag Between Identification of External Compliance Issues and Resolution. These KPI Powerpoint graphics are all data driven,and the shape automatically adjusts according to your data. Just right click on the KPI graphic,enter the right value and the shape will adjust automatically. Make a visual impact with our KPI slides.
-
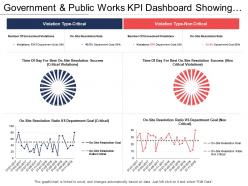 Government and public works kpi dashboard showing violation type and departmental goals
Presenting this set of slides with name - Government And Public Works Kpi Dashboard Showing Violation Type And Departmental Goals. This is a four stage process. The stages in this process are Government And Public Works, Government And Public Tasks.
-
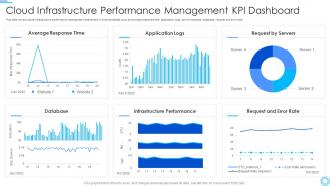 Cloud Infrastructure Performance Management KPI Dashboard
This slide covers cloud infrastructure performance management dashboard. It involves details such as average response time, application logs, server requests, database, request and error rate. Introducing our Cloud Infrastructure Performance Management KPI Dashboard set of slides. The topics discussed in these slides are Average Response Time, Infrastructure Performance, Database. This is an immediately available PowerPoint presentation that can be conveniently customized. Download it and convince your audience.
-
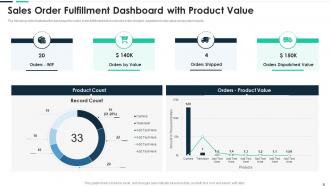 Sales Order Fulfillment Dashboard With Product Value
The following slide illustrates the dashboard for sales order fulfillment which includes order shipped, dispatched order value and product counts. Introducing our Sales Order Fulfillment Dashboard With Product Value set of slides. The topics discussed in these slides are Sales Order Fulfillment Dashboard With Product Value. This is an immediately available PowerPoint presentation that can be conveniently customized. Download it and convince your audience.
-
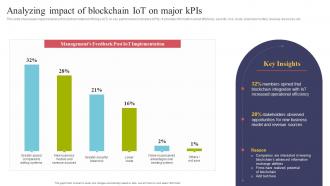 Analyzing Impact Of Blockchain IOT On Major Kpis Using IOT Technologies For Better Logistics
This slide showcases impact analysis of blockchain internet of things IoT on key performance indicators KPIs. It provides information about efficiency, security, risk, costs, business models, revenue resources, etc. Deliver an outstanding presentation on the topic using this Analyzing Impact Of Blockchain IOT On Major Kpis Using IOT Technologies For Better Logistics. Dispense information and present a thorough explanation of Increased Operational, Exiting Systems, Greater Security using the slides given. This template can be altered and personalized to fit your needs. It is also available for immediate download. So grab it now.
-
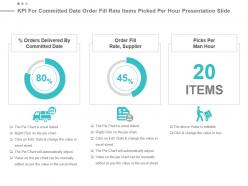 Kpi for committed date order fill rate items picked per hour presentation slide
Presenting kpi for committed date order fill rate items picked per hour presentation slide. This presentation slide shows three Key Performance Indicators or KPIs. The first KPI that can be show is percentage Orders Delivered By Committed Date. The second KPI is Order Fill Rate, Supplier and the third is Picks Per Man Hour. These KPI Powerpoint graphics are all data driven, and the shape automatically adjusts according to your data. Just right click on the KPI graphic, enter the right value and the shape will adjust automatically. Make a visual impact with our KPI slides.
-
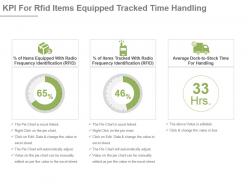 Kpi for rfid items equipped tracked time handling ppt slide
Presenting kpi for rfid items equipped tracked time handling ppt slide. This presentation slide shows Three Key Performance Indicators or KPIs in a Dashboard style design. The first KPI that can be shown is Percentage of Items Equipped With Radio Frequency Identification or RFID. The second KPI is Percentage of Items Tracked With Radio Frequency Identification or RFID. The third is Average Dock to Stock Time For Handling. These KPI Powerpoint graphics are all data driven, and the shape automatically adjusts according to your data. Just right click on the KPI graphic, enter the right value and the shape will adjust automatically. Make a visual impact with our KPI slides.
-
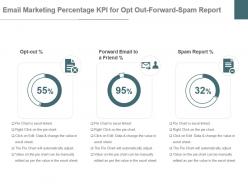 Email Marketing Percentage Kpi For Opt Out Forward Spam Report Ppt Slide
Presenting email marketing percentage kpi for opt out forward spam report ppt slide. This presentation slide shows Three Key Performance Indicators or KPIs in a Dashboard style design. The first KPI that can be shown is Opt out Percentage. The second KPI is Forward Email to a Friend Percentage. The third is Spam Report Percentage. These KPI Powerpoint graphics are all data driven, and the shape automatically adjusts according to your data. Just right click on the KPI graphic, enter the right value and the shape will adjust automatically. Make a visual impact with our KPI slides.
-
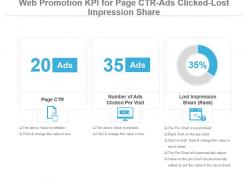 Web promotion kpi for page ctr ads clicked lost impression share powerpoint slide
Presenting web promotion kpi for page ctr ads clicked lost impression share powerpoint slide. This presentation slide shows Three Key Performance Indicators or KPIs in a Dashboard style design. The first KPI that can be shown is Page CTR. The second KPI is Number of Ads Clicked Per Visit. The third is Lost Impression Share Rank. These KPI Powerpoint graphics are all data driven, and the shape automatically adjusts according to your data. Just right click on the KPI graphic, enter the right value and the shape will adjust automatically. Make a visual impact with our KPI slides.
-
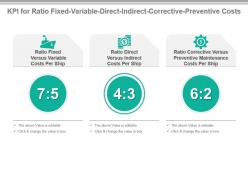 Kpi for ratio fixed variable direct indirect corrective preventive costs presentation slide
Presenting kpi for ratio fixed variable direct indirect corrective preventive costs presentation slide. This presentation slide shows three Key Performance Indicators or KPIs in a Dashboard style design. The first KPI that can be shown is Ratio Fixed Versus Variable Costs Per Ship. The second KPI is Ratio Direct Versus Indirect Costs Per Ship and the third is Ratio Corrective Versus Preventive Maintenance Costs Per Ship. These KPI Powerpoint graphics are all data driven, and the shape automatically adjusts according to your data. Just right click on the KPI graphic, enter the right value and the shape will adjust automatically. Make a visual impact with our KPI slides.
-
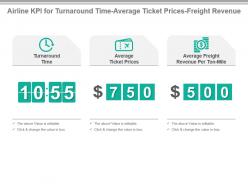 Airline kpi for turnaround time average ticket prices freight revenue presentation slide
Presenting airline kpi for turnaround time average ticket prices freight revenue presentation slide. This presentation slide shows three Key Performance Indicators or KPIs in a Dashboard style design. The first KPI that can be shown is Turnaround Time. The second KPI is Average Ticket Prices and the third is Average Freight Revenue Per Ton Mile. These KPI Powerpoint graphics are all data driven, and the shape automatically adjusts according to your data. Just right click on the KPI graphic, enter the right value and the shape will adjust automatically. Make a visual impact with our KPI slides.
-
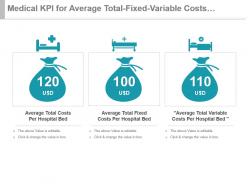 Medical kpi for average total fixed variable costs per hospital bed powerpoint slide
Presenting medical kpi for average total fixed variable costs per hospital bed powerpoint slide. This presentation slide shows three Key Performance Indicators or KPIs in a Dashboard style design. The first KPI that can be shown is Average Total Costs Per Hospital Bed. The second KPI is Average Total Fixed Costs Per Hospital Bed and the third is Average Total Variable Costs Per Hospital Bed. These KPI Powerpoint graphics are all data driven, and the shape automatically adjusts according to your data. Just right click on the KPI graphic, enter the right value and the shape will adjust automatically. Make a visual impact with our KPI slides.
-
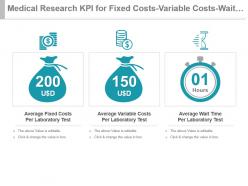 Medical research kpi for fixed costs variable costs wait time per test powerpoint slide
Presenting medical research kpi for fixed costs variable costs wait time per test powerpoint slide. This presentation slide shows three Key Performance Indicators or KPIs in a Dashboard style design. The first KPI that can be shown is Average Fixed Costs Per Laboratory Test. The second KPI is Average Variable Costs Per Laboratory Test and the third is Average Wait Time Per Laboratory Test. These KPI Powerpoint graphics are all data driven, and the shape automatically adjusts according to your data. Just right click on the KPI graphic, enter the right value and the shape will adjust automatically. Make a visual impact with our KPI slides.
-
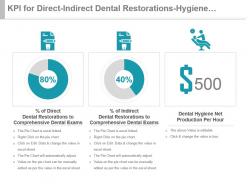 Kpi for direct indirect dental restorations hygiene production per hour presentation slide
Presenting kpi for direct indirect dental restorations hygiene production per hour presentation slide. This presentation slide shows three Key Performance Indicators or KPIs in a Dashboard style design. The first KPI that can be shown is Percentage of Direct Dental Restorations to Comprehensive Dental Exams. The second KPI is Percentage of Indirect Dental Restorations to Comprehensive Dental Exams and the third is Dental Hygiene Net Production Per Hour. These KPI Powerpoint graphics are all data driven, and the shape automatically adjusts according to your data. Just right click on the KPI graphic, enter the right value and the shape will adjust automatically. Make a visual impact with our KPI slides.
-
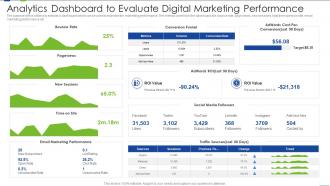 Analytics Dashboard To Evaluate Digital Marketing Performance
The purpose of this slide is to exhibits a dashboard which can be used to examine the marketing performance. The metrics covered in the dashboard are bounce rate, page views, new sessions, total time spent on site, email marketing performance etc. Presenting our well-structured Analytics Dashboard To Evaluate Digital Marketing Performance. The topics discussed in this slide are Analytics Dashboard, Evaluate, Marketing, Performance. This is an instantly available PowerPoint presentation that can be edited conveniently. Download it right away and captivate your audience.
-
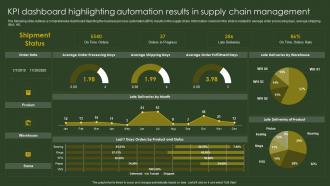 KPI Dashboard Highlighting Automation Results BPA Tools For Process Improvement And Cost Reduction
The following slide outlines a comprehensive dashboard depicting the business process automation BPA results in the supply chain. Information covered in the slide is related to average order processing days, average shipping days, etc. Present the topic in a bit more detail with this KPI Dashboard Highlighting Automation Results BPA Tools For Process Improvement And Cost Reduction. Use it as a tool for discussion and navigation on Shipment Status, Late Deliveries, Warehouse, Product. This template is free to edit as deemed fit for your organization. Therefore download it now.
-
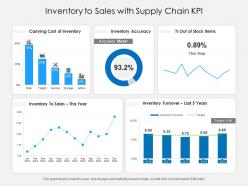 Inventory to sales with supply chain kpi
Presenting this set of slides with name Inventory To Sales With Supply Chain KPI. The topics discussed in these slides are Cost, Inventory, Target. This is a completely editable PowerPoint presentation and is available for immediate download. Download now and impress your audience.
-
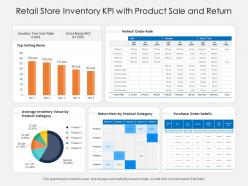 Retail store inventory kpi with product sale and return
Presenting this set of slides with name Retail Store Inventory KPI With Product Sale And Return. The topics discussed in these slides are Inventory, Value, Gross Margin. This is a completely editable PowerPoint presentation and is available for immediate download. Download now and impress your audience.
-
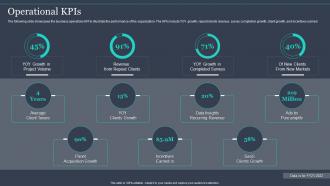 Operational KPIS Pureprofile Company Profile Ppt Powerpoint Presentation Ideas Graphics Download
The following slide showcases the business operations KPI to illustrate the performance of the organization.The KPIs include YOY growth, repeat clients revenue, survey completion growth, client growth, and incentives earned.Deliver an outstanding presentation on the topic using this Operational KPIS Pureprofile Company Profile Ppt Powerpoint Presentation Ideas Graphics Download. Dispense information and present a thorough explanation of Survey Healthcare, Quantum Market, Hall Partners using the slides given. This template can be altered and personalized to fit your needs. It is also available for immediate download. So grab it now.
-
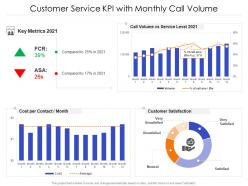 Customer service kpi with monthly call volume
Presenting our well structured Customer Service KPI With Monthly Call Volume The topics discussed in this slide are Cost, Metrics, Service. This is an instantly available PowerPoint presentation that can be edited conveniently. Download it right away and captivate your audience.
-
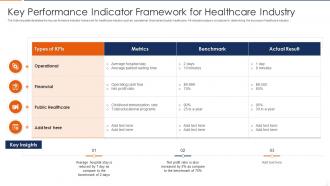 Key Performance Indicator Framework For Healthcare Industry
The following slide illustrates the key performance indicator framework for healthcare industry such as operational, financial and public healthcare. All indicators plays a crucial part in determining the success of healthcare industry. Introducing our Key Performance Indicator Framework For Healthcare Industry set of slides. The topics discussed in these slides are Operational, Public Healthcare, Financial. This is an immediately available PowerPoint presentation that can be conveniently customized. Download it and convince your audience.
-
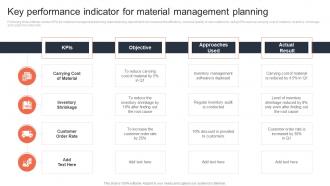 Key Performance Indicator For Material Management Planning
Following slide outlines various KPIs for material management planning. Manufacturing department can measure the efficiency, cost and quality of raw material by using KPIs such as carrying cost of material, inventory shrinkage and customer order rate. Introducing our Key Performance Indicator For Material Management Planning set of slides. The topics discussed in these slides are Carrying Cost Of Material, Customer Order Rate, Inventory Shrinkage. This is an immediately available PowerPoint presentation that can be conveniently customized. Download it and convince your audience.
-
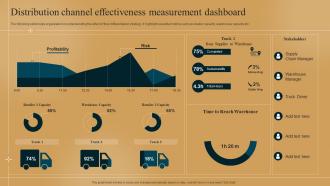 Distribution Channel Effectiveness Measurement Dashboard Differentiation Strategy How To Outshine
The following slide helps organization in understanding the effect of their differentiation strategy. It highlight essential metrics such as retailer capacity, warehouse capacity etc. Present the topic in a bit more detail with this Distribution Channel Effectiveness Measurement Dashboard Differentiation Strategy How To Outshine. Use it as a tool for discussion and navigation on Profitability, Warehouse Capacity, Measurement Dashboard. This template is free to edit as deemed fit for your organization. Therefore download it now.
-
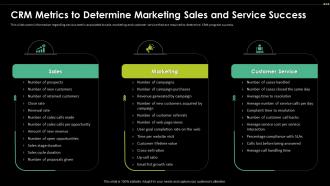 CRM Metrics To Determine Marketing Digital Transformation Driving Customer
This slide covers information regarding various metric associated to sale, marketing and customer service that are required to determine CRM program success. Introducing CRM Metrics To Determine Marketing Digital Transformation Driving Customer to increase your presentation threshold. Encompassed with three stages, this template is a great option to educate and entice your audience. Dispence information on Sales, Marketing, Customer Service, Prospects, using this template. Grab it now to reap its full benefits.
-
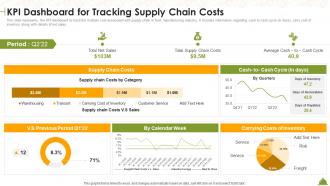 KPI Dashboard For Tracking Supply Chain Costs Industry Overview Of Food
This slide represents the KPI dashboard to track the multiple cost associated with supply chain in food manufacturing industry. It includes information regarding cash to cash cycle in days, carry cost of inventory along with details of net sales. Present the topic in a bit more detail with this KPI Dashboard For Tracking Supply Chain Costs Industry Overview Of Food. Use it as a tool for discussion and navigation on Supply Chain Costs, Sales, Dashboard. This template is free to edit as deemed fit for your organization. Therefore download it now.
-
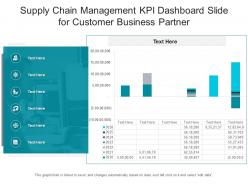 Supply chain management kpi dashboard slide for customer business partner powerpoint template
This Supply Chain Management Kpi Dashboard Slide For Customer Business Partner Powerpoint Template is designed using a data-driven approach to help you display important stats, figures, insights, and metrics related to the topic of your choice. You can also deploy this slide to present reports on a specific business project and strategy. It is tailor-made using a mix of KPIs that make the information easily understandable. Project managers, executives, or other department heads can grab this readily available PowerPoint presentation slide to present relevant information. It can be further used for monitoring and identifying various trends doing rounds in the industry of your choice. The biggest feature of this PowerPoint layout is that it is designed using vector-based and high-quality graphics that can be reproduced as PNGs, JPGs, and PDFs. It also works well with Google Slides and PowerPoint. Therefore, giving a lot of options to work with.
-
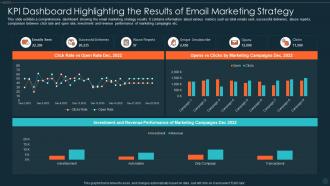 Kpi Dashboard Highlighting The Results Of Email Marketing Strategy
This slide exhibits a comprehensive dashboard showing the email marketing strategy results. It contains information about various metrics such as total emails sent, successful deliveries, abuse reports, comparison between click rate and open rate, investment and revenue performance of marketing campaigns etc. Presenting our well structured KPI Dashboard Highlighting The Results Of Email Marketing Strategy. The topics discussed in this slide are Investment, Revenue Performance, Marketing Campaigns. This is an instantly available PowerPoint presentation that can be edited conveniently. Download it right away and captivate your audience
-
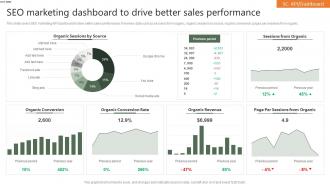 SEO Marketing Dashboard To Drive Better Sales Performance
This slide covers SEO marketing KPI dashboard to drive better sales performance. It involves data such as sessions from organic, organic sessions by source, organic conversion, pages per sessions from organic. Introducing our SEO Marketing Dashboard To Drive Better Sales Performance set of slides. The topics discussed in these slides are Organic Conversion, Organic Conversion Rate, Organic Revenue. This is an immediately available PowerPoint presentation that can be conveniently customized. Download it and convince your audience.
-
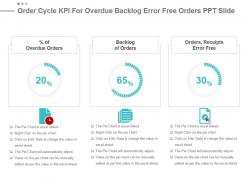 Order cycle kpi for overdue backlog error free orders ppt slide
Presenting order cycle kpi for overdue backlog error free orders ppt slide. This presentation slide shows three Key Performance Indicators or KPIs. The first KPI that can be show is percentage of Overdue Orders. The second KPI is Backlog of Orders and the third is Orders, Receipts Error Free. These KPI Powerpoint graphics are all data driven, and the shape automatically adjusts according to your data. Just right click on the KPI graphic, enter the right value and the shape will adjust automatically. Make a visual impact with our KPI slides.
-
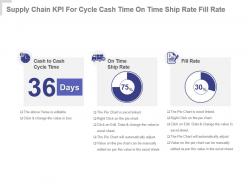 Supply chain kpi for cycle cash time on time ship rate fill rate powerpoint slide
Presenting supply chain kpi for cycle cash time on time ship rate fill rate powerpoint slide. This presentation slide shows three Key Performance Indicators or KPIs in a Dashboard style design. The first KPI that can be shown is Cash To Cash Cycle Time. The second KPI is On Time Ship Rate and the third is Fill Rate. These KPI Powerpoint graphics are all data driven, and the shape automatically adjusts according to your data. Just right click on the KPI graphic, enter the right value and the shape will adjust automatically. Make a visual impact with our KPI slides.
-
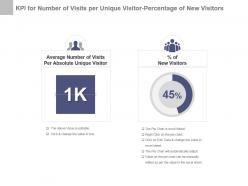 Kpi for number of visits per unique visitor percentage of new visitors ppt slide
Presenting kpi for number of visits per unique visitor percentage of new visitors ppt slide. This presentation slide shows two Key Performance Indicators or KPIs in a Dashboard style design. The first KPI that can be shown is Average Number of Visits Per Absolute Unique Visitor. The second KPI is Percentage of New Visitors. These KPI Powerpoint graphics are all data driven, and the shape automatically adjusts according to your data. Just right click on the KPI graphic, enter the right value and the shape will adjust automatically. Make a visual impact with our KPI slides.


