KPI Dashboard, Excel and Metrics PPT Templates
-
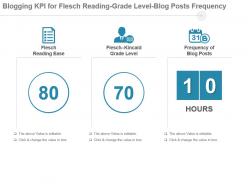 Blogging Kpi For Flesch Reading Grade Level Blog Posts Frequency Powerpoint Slide
Presenting blogging kpi for flesch reading grade level blog posts frequency powerpoint slide. This presentation slide shows Three Key Performance Indicators or KPIs in a Dashboard style design. The first KPI that can be shown is Flesch Reading Ease. The second KPI is Flesch Kincaid Grade Level. The third is Frequency of Blog Posts. These KPI Powerpoint graphics are all data driven, and the shape automatically adjusts according to your data. Just right click on the KPI graphic, enter the right value and the shape will adjust automatically. Make a visual impact with our KPI slides.
-
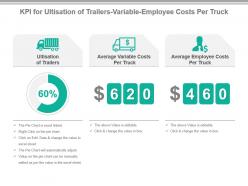 Kpi for ultisation of trailers variable employee costs per truck presentation slide
Presenting kpi for ultisation of trailers variable employee costs per truck presentation slide. This presentation slide shows Three Key Performance Indicators or KPIs in a Dashboard style design. The first KPI that can be shown is Ultisation of Trailers. The second KPI is Average Variable Costs Per Truck. The third is Average Employee Costs Per Truck. These KPI Powerpoint graphics are all data driven, and the shape automatically adjusts according to your data. Just right click on the KPI graphic, enter the right value and the shape will adjust automatically. Make a visual impact with our KPI slides.
-
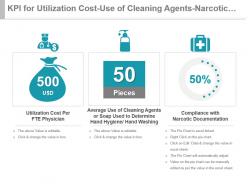 Kpi for utilization cost use of cleaning agents narcotic documentation presentation slide
Presenting kpi for utilization cost use of cleaning agents narcotic documentation presentation slide. This presentation slide shows three Key Performance Indicators or KPIs in a Dashboard style design. The first KPI that can be shown is Utilization Cost Per FTE Physician. The second KPI is Average Use of Cleaning Agents or Soap Used to Determine Hand Hygiene Hand Washing and the third is Compliance with Narcotic Documentation. These KPI Powerpoint graphics are all data driven, and the shape automatically adjusts according to your data. Just right click on the KPI graphic, enter the right value and the shape will adjust automatically. Make a visual impact with our KPI slides.
-
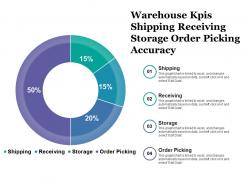 Warehouse kpis shipping receiving storage order picking accuracy
Presenting this set of slides with name - Warehouse Kpis Shipping Receiving Storage Order Picking Accuracy. This is a four stage process. The stages in this process are Warehouse Kpi, Warehouse Dashboard, Warehouse Metrics.
-
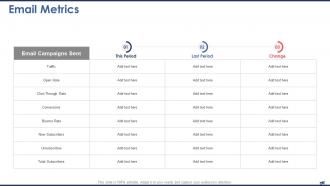 Digital Marketing Report Email Metrics Ppt Infographics
Present the topic in a bit more detail with this Digital Marketing Report Email Metrics Ppt Infographics. Use it as a tool for discussion and navigation on Email Metrics. This template is free to edit as deemed fit for your organization. Therefore download it now.
-
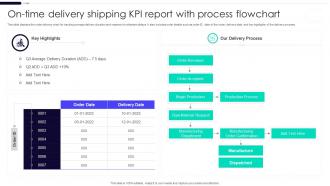 On Time Delivery Shipping KPI Report With Process Flowchart
This slide displays the order delivery chart for tracking average delivery duration and reasons for shipment delays. It also includes order details such as order ID, date of the order, delivery date, and key highlights of the delivery process. Introducing our On Time Delivery Shipping KPI Report With Process Flowchart set of slides. The topics discussed in these slides are Order Received, Order Accepted, Begin Production, Production Process, Dispatched. This is an immediately available PowerPoint presentation that can be conveniently customized. Download it and convince your audience.
-
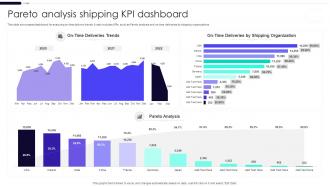 Pareto Analysis Shipping KPI Dashboard
This slide showcases dashboard for analyzing on-time delivery trends. It also includes KPIs such as Pareto analysis and on-time deliveries by shipping organizations Presenting our well-structured Pareto Analysis Shipping KPI Dashboard. The topics discussed in this slide are Pareto Analysis Shipping, KPI Dashboard. This is an instantly available PowerPoint presentation that can be edited conveniently. Download it right away and captivate your audience.
-
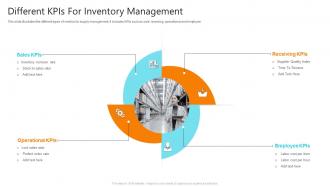 Different kpis For Inventory Management
This slide illustrates the different types of metrics for supply management. It includes KPIs such as sale, receiving, operational and employee. Presenting our set of slides with Different kpis For Inventory Management. This exhibits information on four stages of the process. This is an easy to edit and innovatively designed PowerPoint template. So download immediately and highlight information on Sales Kpis, Operational Kpis, Receiving Kpis, Employee Kpis.
-
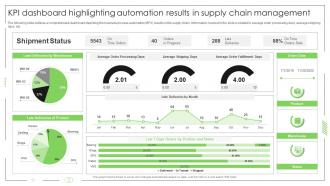 Business Process Automation KPI Dashboard Highlighting Automation Results In Supply Chain Management
The following slide outlines a comprehensive dashboard depicting the business process automation BPA results in the supply chain. Information covered in the slide is related to average order processing days, average shipping days, etc.Deliver an outstanding presentation on the topic using this Business Process Automation KPI Dashboard Highlighting Automation Results In Supply Chain Management. Dispense information and present a thorough explanation of Shipment Status, Late Deliveries, Deliveries Product using the slides given. This template can be altered and personalized to fit your needs. It is also available for immediate download. So grab it now.
-
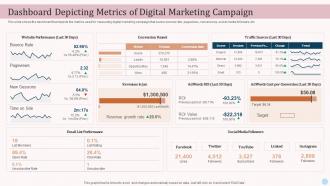 Dashboard Depicting Metrics Of Digital Marketing Campaign Ecommerce Advertising Platforms In Marketing
This slide shows the dashboard that depicts the metrics used for measuring digital marketing campaign that covers bounce rate pageviews conversions social media followers etc.Deliver an outstanding presentation on the topic using this Dashboard Depicting Metrics Of Digital Marketing Campaign Ecommerce Advertising Platforms In Marketing. Dispense information and present a thorough explanation of Conversion Funnel, Bounce Rate, Social Media using the slides given. This template can be altered and personalized to fit your needs. It is also available for immediate download. So grab it now.
-
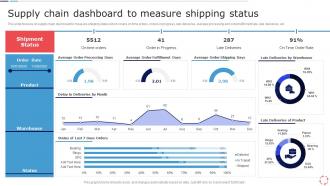 Supply Chain Dashboard To Measure Shipping Status Models For Improving Supply Chain Management
This slide focuses on supply chain dashboard to measure shipping status which covers on time orders, orders in progress, late deliveries, average processing and order fulfillment rate, late deliveries, etc. Present the topic in a bit more detail with this Supply Chain Dashboard To Measure Shipping Status Models For Improving Supply Chain Management. Use it as a tool for discussion and navigation on Supply Chain Dashboard, Measure Shipping Status. This template is free to edit as deemed fit for your organization. Therefore download it now.
-
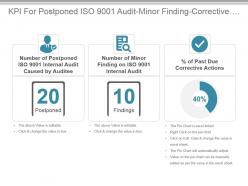 Kpi for postponed iso 9001 audit minor finding corrective actions presentation slide
Presenting kpi for postponed iso 9001 audit minor finding corrective actions presentation slide. This presentation slide shows three Key Performance Indicators or KPIs in a Dashboard style design. The first KPI that can be shown is Number of Postponed ISO 9001 Internal Audit Caused by Auditee. The second KPI is Number of Minor Finding on ISO 9001 Internal Audit and the third is percentage of Past Due Corrective Actions. These KPI Powerpoint graphics are all data driven,and the shape automatically adjusts according to your data. Just right click on the KPI graphic,enter the right value and the shape will adjust automatically. Make a visual impact with our KPI slides.
-
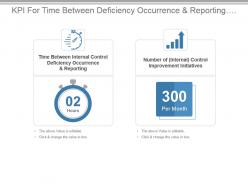 Kpi for time between deficiency occurrence and reporting improvement steps powerpoint slide
Presenting kpi for time between deficiency occurrence and reporting improvement steps powerpoint slide. This presentation slide shows two Key Performance Indicators or KPIs in a Dashboard style design. The first KPI that can be shown is Time Between Internal Control Deficiency Occurrence and Reporting. The second KPI is Number of Internal Control Improvement Initiatives. These KPI Powerpoint graphics are all data driven,and the shape automatically adjusts according to your data. Just right click on the KPI graphic,enter the right value and the shape will adjust automatically. Make a visual impact with our KPI slides.
-
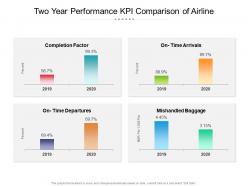 Two year performance kpi comparison of airline
Presenting this set of slides with name Two Year Performance KPI Comparison Of Airline. The topics discussed in these slides are Two Year Performance KPI Comparison Of Airline. This is a completely editable PowerPoint presentation and is available for immediate download. Download now and impress your audience.
-
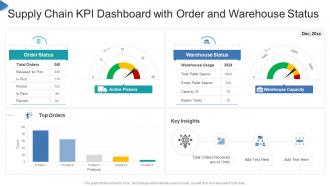 Supply chain kpi dashboard with order and warehouse status
Introducing our Supply Chain KPI Dashboard With Order And Warehouse Status set of slides. The topics discussed in these slides are Supply Chain KPI Dashboard With Order And Warehouse Status. This is an immediately available PowerPoint presentation that can be conveniently customized. Download it and convince your audience.
-
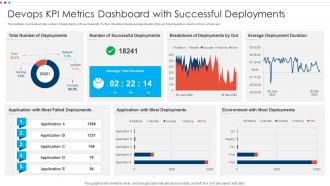 Devops KPI Metrics Dashboard With Successful Deployments
This template covers about total number of deployments with success ratio. Further, this slide includes average duration time and total breakdown due to errors in whole year. Introducing our Devops KPI Metrics Dashboard With Successful Deployments set of slides. The topics discussed in these slides are Devops KPI Metrics Dashboard with Successful Deployments. This is an immediately available PowerPoint presentation that can be conveniently customized. Download it and convince your audience.
-
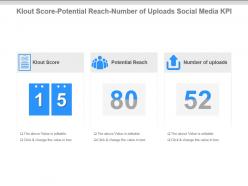 Klout score potential reach number of uploads social media kpi ppt slide
Presenting klout score potential reach number of uploads social media kpi ppt slide. This presentation slide shows three Key Performance Indicators or KPIs in a Dashboard style design. The first KPI that can be shown is Klout Score. The second KPI is Potential Reach and the third is Number of uploads. These KPI Powerpoint graphics are all data driven, and the shape automatically adjusts according to your data. Just right click on the KPI graphic, enter the right value and the shape will adjust automatically. Make a visual impact with our KPI slides.
-
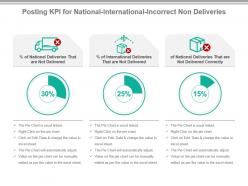 Posting kpi for national international incorrect non deliveries powerpoint slide
Presenting posting kpi for national international incorrect non deliveries powerpoint slide. This presentation slide shows Three Key Performance Indicators or KPIs in a Dashboard style design. The first KPI that can be shown is Percentage of National Deliveries That are Not Delivered. The second KPI is Percentage of International Deliveries That are Not Delivered. The third is of National Deliveries That are Not Delivered Correctly. These KPI Powerpoint graphics are all data driven, and the shape automatically adjusts according to your data. Just right click on the KPI graphic, enter the right value and the shape will adjust automatically. Make a visual impact with our KPI slides.
-
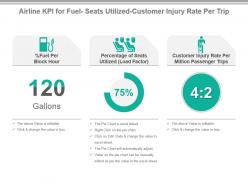 Airline kpi for fuel seats utilized customer injury rate per trip ppt slide
Presenting airline kpi for fuel seats utilized customer injury rate per trip ppt slide. This presentation slide shows three Key Performance Indicators or KPIs in a Dashboard style design. The first KPI that can be shown is Percentage Fuel Per Block Hour. The second KPI is Percentage of Seats Utilized Load Factor and the third is Customer Injury Rate Per Million Passenger Trips. These KPI Powerpoint graphics are all data driven, and the shape automatically adjusts according to your data. Just right click on the KPI graphic, enter the right value and the shape will adjust automatically. Make a visual impact with our KPI slides.
-
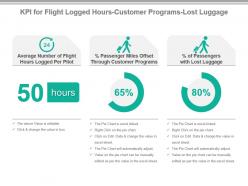 Kpi for flight logged hours customer programs lost luggage powerpoint slide
Presenting kpi for flight logged hours customer programs lost luggage powerpoint slide. This presentation slide shows three Key Performance Indicators or KPIs in a Dashboard style design. The first KPI that can be shown is Average Number of Flight Hours Logged Per Pilot. The second KPI is percentage Passenger Miles Offset Through Customer Programs and the third is percentage of Passengers with Lost Luggage. These KPI Powerpoint graphics are all data driven, and the shape automatically adjusts according to your data. Just right click on the KPI graphic, enter the right value and the shape will adjust automatically. Make a visual impact with our KPI slides.
-
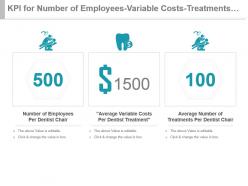 Kpi for number of employees variable costs treatments per dentist chair presentation slide
Presenting kpi for number of employees variable costs treatments per dentist chair presentation slide. This presentation slide shows three Key Performance Indicators or KPIs in a Dashboard style design. The first KPI that can be shown is Number of Employees Per Dentist Chair. The second KPI is Average Variable Costs Per Dentist Treatment and the third is Average Number of Treatments Per Dentist Chair. These KPI Powerpoint graphics are all data driven, and the shape automatically adjusts according to your data. Just right click on the KPI graphic, enter the right value and the shape will adjust automatically. Make a visual impact with our KPI slides.
-
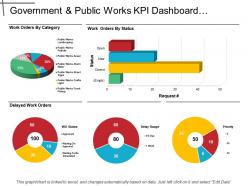 Government and public works kpi dashboard showing work order by category and status
Presenting the KPI dashboard presentation layout. This dashboard template is completely customizable and is professionally designed. You can modify the objects in the template like font color and font size without going through any fuss. This presentation slide is fully compatible with Google Slide and can be saved in JPG or PDF file format without any hassle. Fast download this at the click of the button.
-
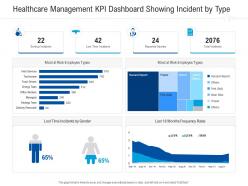 Healthcare management kpi dashboard showing incident by type healthcare management system ppt ideas
Present the topic in a bit more detail with this Healthcare Management KPI Dashboard Showing Incident By Type Healthcare Management System Ppt Ideas. Use it as a tool for discussion and navigation on Serious Incidents, Lost Time Incidents, Reported Injuries, Total Incidents. This template is free to edit as deemed fit for your organization. Therefore download it now.
-
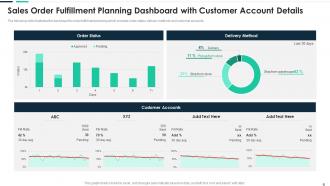 Sales Order Fulfillment Planning Dashboard With Customer Account Details
The following slide illustrates the dashboard for order fulfillment planning which includes order status, delivery methods and customer accounts. Presenting our well structured Sales Order Fulfillment Planning Dashboard With Customer Account Details. The topics discussed in this slide are Order Status, Customer Accounts, Delivery Method. This is an instantly available PowerPoint presentation that can be edited conveniently. Download it right away and captivate your audience.
-
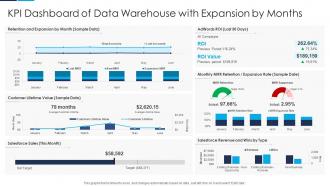 KPI Dashboard Snapshot Of Data Warehouse With Expansion By Months
Introducing our KPI Dashboard Snapshot Of Data Warehouse With Expansion By Months set of slides. The topics discussed in these slides are Salesforce Sales, Customer Lifetime Value, Expansion Rate. This is an immediately available PowerPoint presentation that can be conveniently customized. Download it and convince your audience.
-
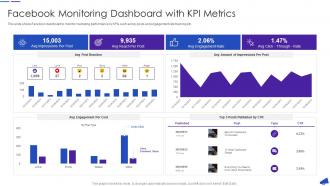 Facebook Monitoring Dashboard With KPI Metrics Facebook For Business Marketing
This slide shows Facebook dashboard to monitor marketing performance by KPIs such as top posts and engagement rate tracking etc.Deliver an outstanding presentation on the topic using this Facebook Monitoring Dashboard With KPI Metrics Facebook For Business Marketing Dispense information and present a thorough explanation of Facebook Monitoring Dashboard With Kpi Metrics using the slides given. This template can be altered and personalized to fit your needs. It is also available for immediate download. So grab it now.
-
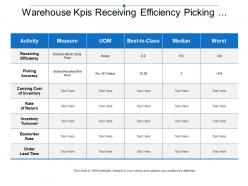 Warehouse kpis receiving efficiency picking accuracy carrying inventory
Presenting this set of slides with name - Warehouse Kpis Receiving Efficiency Picking Accuracy Carrying Inventory. This is a five stage process. The stages in this process are Warehouse Kpi, Warehouse Dashboard, Warehouse Metrics.
-
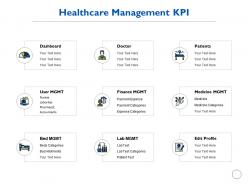 Healthcare management kpi dashboard ppt powerpoint presentation gallery shapes
Presenting this set of slides with name Healthcare Management Kpi Dashboard Ppt Powerpoint Presentation Gallery Shapes. This is a nine stage process. The stages in this process are Healthcare, Management, Kpi Dashboard, Strategy, Planning. This is a completely editable PowerPoint presentation and is available for immediate download. Download now and impress your audience.
-
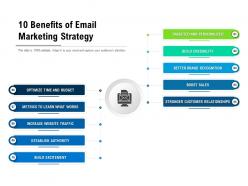 10 Benefits Of Email Marketing Strategy
Introducing our premium set of slides with 10 Benefits Of Email Marketing Strategy. Ellicudate the ten stages and present information using this PPT slide. This is a completely adaptable PowerPoint template design that can be used to interpret topics like Optimize Time And Budget, Metrics To Learn What Works, Increase Website Traffic, Establish Authority, Build Excitement. So download instantly and tailor it with your information.
-
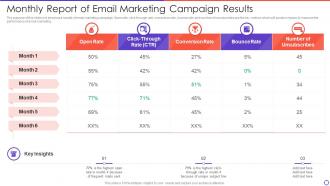 Monthly Report Of Email Marketing Campaign Results
The purpose of this slide is to showcase results of email marketing campaign. Open rate, click-through rate, conversion rate, bounce rate and number of unsubscribes are the key metrics which will assist company to measure the performance of email marketing. Introducing our Monthly Report Of Email Marketing Campaign Results set of slides. The topics discussed in these slides are Monthly Report Of Email Marketing Campaign Results. This is an immediately available PowerPoint presentation that can be conveniently customized. Download it and convince your audience.
-
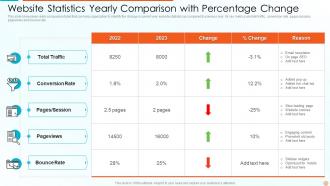 Website Statistics Yearly Comparison With Percentage Change
This slide showcases yearly comparison table that can help organization to identify the change in current year website statistics as compared to previous year. Its key metrics are total traffic, conversion rate, pages or session, pageviews and bounce rate Introducing our Website Statistics Yearly Comparison With Percentage Change set of slides. The topics discussed in these slides are Statistics, Comparison, Percentage. This is an immediately available PowerPoint presentation that can be conveniently customized. Download it and convince your audience.
-
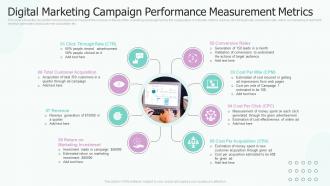 Digital Marketing Campaign Performance Measurement Metrics
This slide shows the key performance indicators to measure the success or failure of the marketing campaign held by the organization. It includes metrics such as click through rate, conversion rate, return on marketing investment, revenue generated, total customer acquisition etc. Presenting our set of slides with name Digital Marketing Campaign Performance Measurement Metrics. This exhibits information on eight stages of the process. This is an easy to edit and innovatively designed PowerPoint template. So download immediately and highlight information on Total Customer Acquisition, Return On Marketing Investment, Conversion Rates.
-
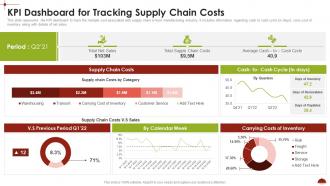 KPI Dashboard For Tracking Supply Chain Costs Comprehensive Analysis
This slide represents the KPI dashboard to track the multiple cost associated with supply chain in food manufacturing industry. It includes information regarding cash to cash cycle in days, carry cost of inventory along with details of net sales. Present the topic in a bit more detail with this KPI Dashboard For Tracking Supply Chain Costs Comprehensive Analysis. Use it as a tool for discussion and navigation on Supply Chain Costs, Previous Period, Calendar Week. This template is free to edit as deemed fit for your organization. Therefore download it now.
-
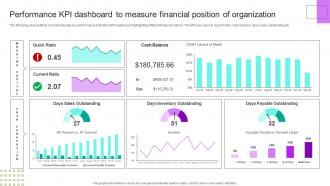 Performance Kpi Dashboard Measure Financial Position Financial Planning Analysis Guide Small Large Businesses
The following slide outlines a comprehensive key performance indicator KPI dashboard highlighting different financial metrics. The KPIs are quick and current ratio, cash balance, days sales outstanding etc. Deliver an outstanding presentation on the topic using this Performance Kpi Dashboard Measure Financial Position Financial Planning Analysis Guide Small Large Businesses. Dispense information and present a thorough explanation of Organization, Performance, Dashboard using the slides given. This template can be altered and personalized to fit your needs. It is also available for immediate download. So grab it now.
-
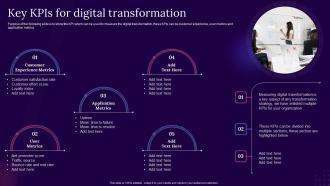 Digital Transformation Guide For Corporates Key Kpis For Digital Transformation
Purpose of the following slide is to show the KPI which can be used to measure the digital transformation, these KPIs can be customer experience, user metrics and application metrics. Introducing Digital Transformation Guide For Corporates Key Kpis For Digital Transformation to increase your presentation threshold. Encompassed with five stages, this template is a great option to educate and entice your audience. Dispence information on Transformation, Customer Experience Metrics, Application Metrics, using this template. Grab it now to reap its full benefits.
-
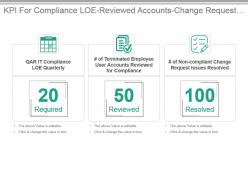 Kpi for compliance loe reviewed accounts change request issues resolved presentation slide
Presenting kpi for compliance loe reviewed accounts change request issues resolved presentation slide. This presentation slide shows three Key Performance Indicators or KPIs in a Dashboard style design. The first KPI that can be shown is QAR IT Compliance LOE Quarterly. The second KPI is of Terminated Employee User Accounts Reviewed for Compliance and the third is of Non compliant Change Request Issues Resolved. These KPI Powerpoint graphics are all data driven,and the shape automatically adjusts according to your data. Just right click on the KPI graphic,enter the right value and the shape will adjust automatically. Make a visual impact with our KPI slides.
-
 Percentage kpi for emission quality waste discharge compliance powerpoint slide
Presenting percentage kpi for emission quality waste discharge compliance powerpoint slide. This presentation slide shows three Key Performance Indicators or KPIs in a Dashboard style design. The first KPI that can be shown is percentage of Air Emission Compliance. The second KPI is percentage of Air Quality Compliance and the third is percentage of Waste Discharge Compliance. These KPI Powerpoint graphics are all data driven,and the shape automatically adjusts according to your data. Just right click on the KPI graphic,enter the right value and the shape will adjust automatically. Make a visual impact with our KPI slides.
-
 Transportation Metrics Graph Chart Monotone Icon In Powerpoint Pptx Png And Editable Eps Format
Make your presentation profoundly eye-catching leveraging our easily customizable Transportation metrics graph chart monotone icon in powerpoint pptx png and editable eps format. It is designed to draw the attention of your audience. Available in all editable formats, including PPTx, png, and eps, you can tweak it to deliver your message with ease.
-
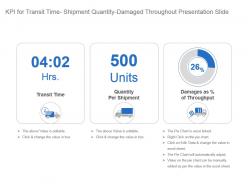 Kpi for transit time shipment quantity damaged throughout presentation slide
Presenting kpi for transit time shipment quantity damaged throughout presentation slide. This presentation slide shows three Key Performance Indicators or KPIs in a Dashboard style design. The first KPI that can be shown is Transit Time. The second KPI is Quantity Per Shipment and the third is Damages as percentage of Throughput. These KPI Powerpoint graphics are all data driven, and the shape automatically adjusts according to your data. Just right click on the KPI graphic, enter the right value and the shape will adjust automatically. Make a visual impact with our KPI slides.
-
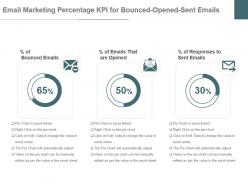 Email Marketing Percentage Kpi For Bounced Opened Sent Emails Powerpoint Slide
Presenting email marketing percentage kpi for bounced opened sent emails powerpoint slide. This presentation slide shows Three Key Performance Indicators or KPIs in a Dashboard style design. The first KPI that can be shown is Percentage of Bounced Emails. The second KPI is Percentage of Emails That are Opened. The third is Percentage of Responses to Sent Emails. These KPI Powerpoint graphics are all data driven, and the shape automatically adjusts according to your data. Just right click on the KPI graphic, enter the right value and the shape will adjust automatically. Make a visual impact with our KPI slides.
-
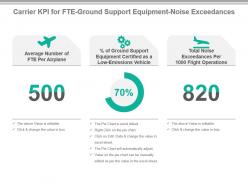 Carrier kpi for fte ground support equipment noise exceedances powerpoint slide
Presenting carrier kpi for fte ground support equipment noise exceedances powerpoint slide. This presentation slide shows three Key Performance Indicators or KPIs in a Dashboard style design. The first KPI that can be shown is Average Number of FTE Per Airplane. The second KPI is percentage of Ground Support Equipment Certified as a Low Emissions Vehicle and the third is Total Noise Exceedances Per 1000 Flight Operations. These KPI Powerpoint graphics are all data driven, and the shape automatically adjusts according to your data. Just right click on the KPI graphic, enter the right value and the shape will adjust automatically. Make a visual impact with our KPI slides.
-
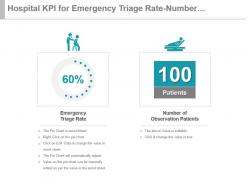 Hospital kpi for emergency triage rate number of observation patients presentation slide
Presenting hospital kpi for emergency triage rate number of observation patients presentation slide. This presentation slide shows two Key Performance Indicators or KPIs in a Dashboard style design. The first KPI that can be shown is Emergency Triage Rate. The second KPI is Number of Observation Patients. These KPI Powerpoint graphics are all data driven, and the shape automatically adjusts according to your data. Just right click on the KPI graphic, enter the right value and the shape will adjust automatically. Make a visual impact with our KPI slides.
-
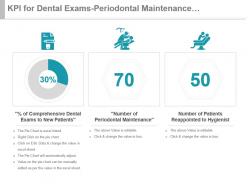 Kpi for dental exams periodontal maintenance reappointed patients ppt slide
Presenting kpi for dental exams periodontal maintenance reappointed patients ppt slide. This presentation slide shows three Key Performance Indicators or KPIs in a Dashboard style design. The first KPI that can be shown is Percentage of Comprehensive Dental Exams to New Patients. The second KPI is Number of Periodontal Maintenance and the third is Number of Patients Reappointed to Hygienist. These KPI Powerpoint graphics are all data driven, and the shape automatically adjusts according to your data. Just right click on the KPI graphic, enter the right value and the shape will adjust automatically. Make a visual impact with our KPI slides.
-
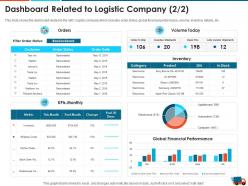 Dashboard related to logistic company metric logistics strategy to increase the supply chain performance
This slide shows the dashboard related to the ABC logistic company which includes order status, global financial performance, volume, inventory details, etc. Present the topic in a bit more detail with this Dashboard Related To Logistic Company Metric Logistics Strategy To Increase The Supply Chain Performance. Use it as a tool for discussion and navigation on Dashboard Related To Logistic Company. This template is free to edit as deemed fit for your organization. Therefore download it now.
-
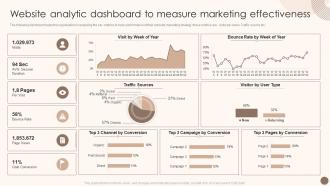 Utilizing Marketing Strategy To Optimize Website Analytic Dashboard To Measure Marketing
The following dashboard helps the organization in analyzing the key metrics to track performance of their website marketing strategy, these metrics are visits per week. Traffic source etc. Present the topic in a bit more detail with this Utilizing Marketing Strategy To Optimize Website Analytic Dashboard To Measure Marketing. Use it as a tool for discussion and navigation on Bounce Rate, Traffic Sources, Goal Conversion. This template is free to edit as deemed fit for your organization. Therefore download it now.
-
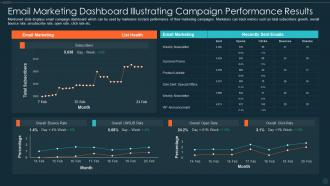 Email Marketing Dashboard Illustrating Campaign Performance Results
Mentioned slide displays email campaign dashboard which can be used by marketers to track performance of their marketing campaigns. Marketers can track metrics such as total subscribers growth, overall bounce rate, unsubscribe rate, open rate, click rate etc. Presenting our well structured Email Marketing Dashboard Illustrating Campaign Performance Results. The topics discussed in this slide are Email Marketing Dashboard Illustrating Campaign Performance Results. This is an instantly available PowerPoint presentation that can be edited conveniently. Download it right away and captivate your audience
-
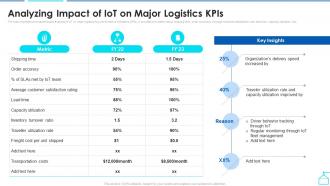 Analyzing Impact Of Iot On Major Logistics Kpis Enabling Smart Shipping And Logistics Through Iot
The following slide showcases impact analysis of IoT on major logistics key performance indicators KPIs. It provides information about shipping time, order accuracy, average customer satisfaction rate, lead time, capacity utilization, etc. Present the topic in a bit more detail with this Analyzing Impact Of Iot On Major Logistics Kpis Enabling Smart Shipping And Logistics Through Iot. Use it as a tool for discussion and navigation on Analyzing, Management, Utilization. This template is free to edit as deemed fit for your organization. Therefore download it now.
-
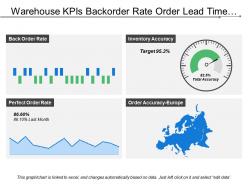 Warehouse kpis backorder rate order lead time inventory accuracy
Presenting this set of slides with name - Warehouse Kpis Backorder Rate Order Lead Time Inventory Accuracy. This is a four stage process. The stages in this process are Warehouse Kpi, Warehouse Dashboard, Warehouse Metrics.
-
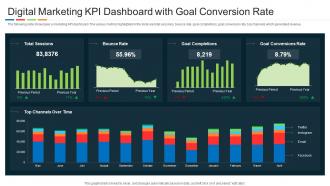 Digital Marketing KPI Dashboard With Goal Conversion Rate
The following slide showcases a marketing KPI dashboard. The various metrics highlighted in the slide are total sessions, bounce rate, goal completions, goal conversion rate, top channels which generated revenue. Presenting our well structured Digital Marketing KPI Dashboard With Goal Conversion Rate. The topics discussed in this slide are Total Sessions, Bounce Rate, Goal Completions, Goal Conversions Rate, Top Channels Over Time. This is an instantly available PowerPoint presentation that can be edited conveniently. Download it right away and captivate your audience.
-
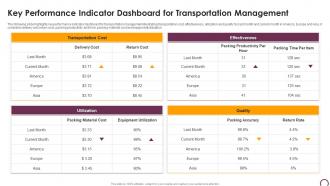 Key Performance Indicator Dashboard For Transportation Management
The following slide highlights key performance indicator dashboard for transportation management illustrating transportation cost, effectiveness, utilization and quality for last month and current month in America, Europe and Asia, it considers delivery and return cost, packing productivity and time, packing material cost and equipment utilization Presenting our well structured Key Performance Indicator Dashboard For Transportation Management. The topics discussed in this slide are Performance, Dashboard, Management. This is an instantly available PowerPoint presentation that can be edited conveniently. Download it right away and captivate your audience.
-
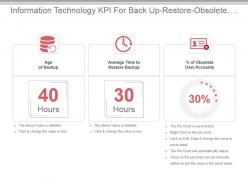 Information technology kpi for back up restore obsolete user accounts presentation slide
Presenting information technology kpi for back up restore obsolete user accounts presentation slide. This presentation slide shows three Key Performance Indicators or KPIs in a Dashboard style design. The first KPI that can be shown is Age of Backup. The second KPI is Average Time to Restore Backup and the third is percentage of Obsolete User Accounts. These KPI Powerpoint graphics are all data driven,and the shape automatically adjusts according to your data. Just right click on the KPI graphic,enter the right value and the shape will adjust automatically. Make a visual impact with our KPI slides.
-
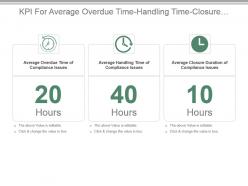 Kpi for average overdue time handling time closure duration compliance issues presentation slide
Presenting kpi for average overdue time handling time closure duration compliance issues presentation slide. This presentation slide shows three Key Performance Indicators or KPIs in a Dashboard style design. The first KPI that can be shown is Average Overdue Time of Compliance Issues. The second KPI is Average Handling Time of Compliance Issues and the third is Average Closure Duration of Compliance Issues. These KPI Powerpoint graphics are all data driven,and the shape automatically adjusts according to your data. Just right click on the KPI graphic,enter the right value and the shape will adjust automatically. Make a visual impact with our KPI slides.
-
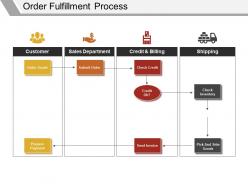 Order fulfillment process presentation ideas
Presenting Order Fulfillment Process Presentation Ideas PPT template. The slide is designed in such a way that editing is quite easy. Our team of PPT designers has used the best PowerPoint templates, images, icons, and layouts. Not only this, but you can also add inclusive of impressive, editable data visualization tools like charts, graphs, and tables. The layout is also compatible with Google Slides. Easily save it into the various image or document formats such as JPG or PDF.
-
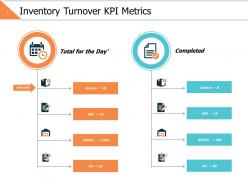 Inventory turnover kpi metrics ppt powerpoint presentation file display
Presenting this set of slides with name - Inventory Turnover Kpi Metrics Ppt Powerpoint Presentation File Display. This is a two stage process. The stages in this process are Business, Management, Strategy, Analysis, Icons.
-
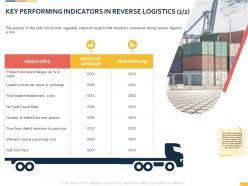 Key performing indicators in reverse logistics ppt powerpoint presentation templates
The purpose of this slide is to provide regarding important aspects that should be considered during reverse logistics in firm. Presenting this set of slides with name Key Performing Indicators In Reverse Logistics Ppt Powerpoint Presentation Templates. The topics discussed in these slides are Key Performing, Indicators Reverse, Logistics. This is a completely editable PowerPoint presentation and is available for immediate download. Download now and impress your audience.
-
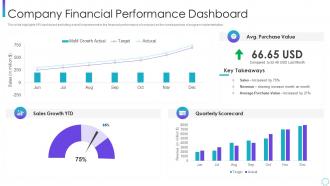 Company financial performance corporate program improving work team productivity
This slide highlights KPI dashboard exhibiting overall improvement in the financial performance of company as the consequences of program implementation. Deliver an outstanding presentation on the topic using this Company Financial Performance Corporate Program Improving Work Team Productivity. Dispense information and present a thorough explanation of Company Financial Performance Dashboard using the slides given. This template can be altered and personalized to fit your needs. It is also available for immediate download. So grab it now.
-
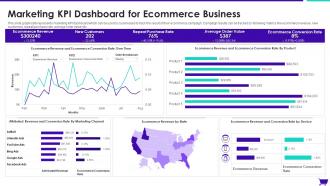 Marketing KPI Dashboard For Ecommerce Business
This slide graphically represents marketing KPI dashboard which can be used by businesses to track the result of their ecommerce campaign. Campaign results can be tracked by following metrics like ecommerce revenue, new customers, repeat purchase rate, average order value etc. Introducing our Marketing KPI Dashboard For Ecommerce Business set of slides. The topics discussed in these slides are Average, Purchase Rate, Customers. This is an immediately available PowerPoint presentation that can be conveniently customized. Download it and convince your audience.
-
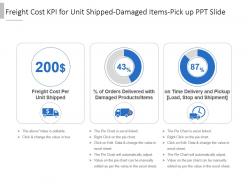 Freight cost kpi for unit shipped damaged items pick up ppt slide
Presenting freight cost kpi for unit shipped damaged items pick up ppt slide. This presentation slide shows three Key Performance Indicators or KPIs in a Dashboard style design. The first KPI that can be shown is Freight Cost Per Unit Shipped. The second KPI is percentage of Orders Delivered with Damaged Products Items and the third is on Time Delivery and Pickup Load, Stop and Shipment. These KPI Powerpoint graphics are all data driven, and the shape automatically adjusts according to your data. Just right click on the KPI graphic, enter the right value and the shape will adjust automatically. Make a visual impact with our KPI slides.
-
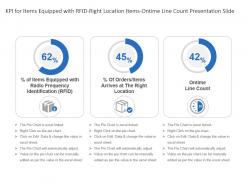 Kpi for items equipped with rfid right location items ontime line count presentation slide
Presenting kpi for items equipped with rfid right location items ontime line count presentation slide. This presentation slide shows three Key Performance Indicators or KPIs in a Dashboard style design. The first KPI that can be shown is percentage of Items Equipped with Radio Frequency Identification or RFID. The second KPI is percentage Of Orders Items Arrives at The Right Location and the third is Ontime Line Count. These KPI Powerpoint graphics are all data driven, and the shape automatically adjusts according to your data. Just right click on the KPI graphic, enter the right value and the shape will adjust automatically. Make a visual impact with our KPI slides.
-
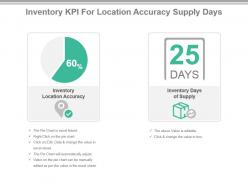 Inventory kpi for location accuracy supply days powerpoint slide
Presenting inventory kpi for location accuracy supply days powerpoint slide. This presentation slide shows Two Key Performance Indicators or KPIs in a Dashboard style design. The first KPI that can be shown is Inventory Location Accuracy. The second KPI is Inventory Days of Supply. These KPI Powerpoint graphics are all data driven, and the shape automatically adjusts according to your data. Just right click on the KPI graphic, enter the right value and the shape will adjust automatically. Make a visual impact with our KPI slides.


