KPI Dashboard, Excel and Metrics PPT Templates
-
 4 Week Roadmap For Website Statistics Improvement
This slide showcases roadmap for website statistics improvement that can help to decide the weekly milestones to enhance the website performance metrics and visitors experience. Its key steps are - measure website statistics, leverage strategies, measure progress and review progress regularly. Presenting our set of slides with name 4 Week Roadmap For Website Statistics Improvement. This exhibits information on four stages of the process. This is an easy-to-edit and innovatively designed PowerPoint template. So download immediately and highlight information on Leverage Strategiesreview Progress Regularly, Measure Progress, Website Statistics.
-
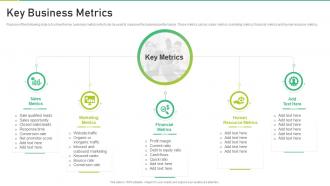 Key Business Metrics Corporate Business Playbook
Purpose of the following slide is to show the key business metrics which can be used to measure the business performance. These metrics can be sales metrics, marketing metrics, financial metrics and human resource metrics. Introducing Key Business Metrics Corporate Business Playbook to increase your presentation threshold. Encompassed with five stages, this template is a great option to educate and entice your audience. Dispence information on Marketing Metrics, Sales Metrics, Financial Metrics, Resource Metrics, using this template. Grab it now to reap its full benefits.
-
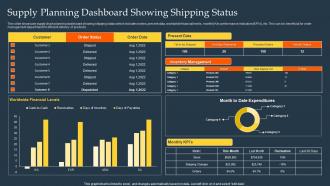 Supply Planning Dashboard Snapshot Showing Shipping Status
This slide showcase supply chain planning dashboard snapshot showing shipping status which includes orders, present data, worldwide financial levels, monthly Key performance indicators KPIs, etc. This can be beneficial for order management department for efficient delivery of products. Introducing our Supply Planning Dashboard Showing Shipping Status set of slides. The topics discussed in these slides are Supply Planning, Dashboard Showing Shipping, Status. This is an immediately available PowerPoint presentation that can be conveniently customized. Download it and convince your audience.
-
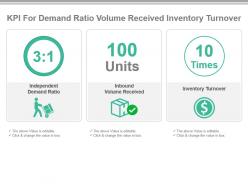 Kpi for demand ratio volume received inventory turnover powerpoint slide
Presenting kpi for demand ratio volume received inventory turnover powerpoint slide. This presentation slide shows Three Key Performance Indicators or KPIs in a Dashboard style design. The first KPI that can be shown is Independent Demand Ratio. The second KPI is Inbound Volume Received. The third is Inventory Turnover. These KPI Powerpoint graphics are all data driven, and the shape automatically adjusts according to your data. Just right click on the KPI graphic, enter the right value and the shape will adjust automatically. Make a visual impact with our KPI slides.
-
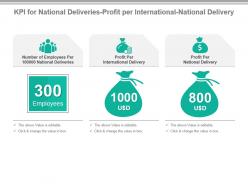 Kpi for national deliveries profit per international national delivery powerpoint slide
Presenting kpi for national deliveries profit per international national delivery powerpoint slide. This presentation slide shows Three Key Performance Indicators or KPIs in a Dashboard style design. The first KPI that can be shown is Number of Employees Per 100000 National Deliveries. The second KPI is Profit Per International Delivery. The third is Profit Per National Delivery. These KPI Powerpoint graphics are all data driven, and the shape automatically adjusts according to your data. Just right click on the KPI graphic, enter the right value and the shape will adjust automatically. Make a visual impact with our KPI slides.
-
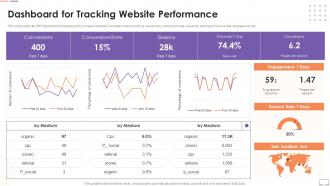 Dashboard For Tracking Website Performance Customer Touchpoint Guide To Improve User Experience
This slide covers the KPI dashboard for analyzing the company website. It includes metrics such as conversions, conversion rate, sessions, stickiness, bounce rate, engagement, etc. Present the topic in a bit more detail with this Dashboard For Tracking Website Performance Customer Touchpoint Guide To Improve User Experience. Use it as a tool for discussion and navigation on Performance, Dashboard, Conversions. This template is free to edit as deemed fit for your organization. Therefore download it now.
-
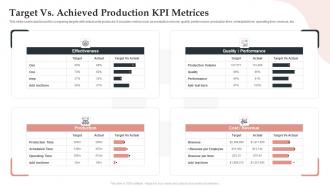 Target Vs Achieved Production KPI Metrices
This slide covers dashboard for comparing targets with actual units produced. It includes metrics such as production volume, quality, performance, production time, scheduled time, operating time, revenue, etc. Introducing our Target Vs Achieved Production KPI Metrices set of slides. The topics discussed in these slides are Production, Effectiveness, Quality Performance, Cost. This is an immediately available PowerPoint presentation that can be conveniently customized. Download it and convince your audience.
-
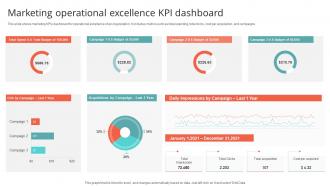 Marketing Operational Excellence KPI Dashboard
This slide shows marketing KPIs dashboard for operational excellence of an organization. It includes metrics such as total spending, total clicks, cost per acquisition, and campaigns Introducing our Marketing Operational Excellence KPI Dashboard set of slides. The topics discussed in these slides are Marketing, Operational Excellence, KPI Dashboard. This is an immediately available PowerPoint presentation that can be conveniently customized. Download it and convince your audience.
-
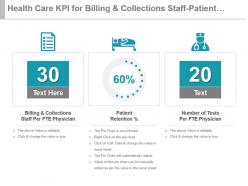 Health care kpi for billing and collections staff patient retention tests presentation slide
Presenting health care kpi for billing and collections staff patient retention tests presentation slide. This presentation slide shows three Key Performance Indicators or KPIs in a Dashboard style design. The first KPI that can be shown is Billing And Collections Staff Per FTE Physician. The second KPI is Patient Retention Percentage and the third is Number of Tests Per FTE Physician. These KPI Powerpoint graphics are all data driven, and the shape automatically adjusts according to your data. Just right click on the KPI graphic, enter the right value and the shape will adjust automatically. Make a visual impact with our KPI slides.
-
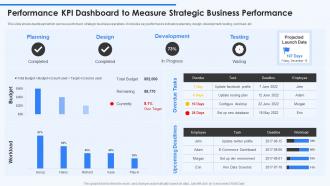 Performance KPI Dashboard To Measure Strategic Business Performance
This slide shows dashboard which can be used to track strategic business operations. It includes key performance indicators planning, design, development, testing, workload, etc. Presenting our well structured Performance KPI Dashboard To Measure Strategic Business Performance. The topics discussed in this slide are Planning, Development, Testing. This is an instantly available PowerPoint presentation that can be edited conveniently. Download it right away and captivate your audience.
-
 Financial Performance KPI Cash Balance Icon
Presenting our set of slides with name Financial Performance KPI Cash Balance Icon. This exhibits information on three stages of the process. This is an easy-to-edit and innovatively designed PowerPoint template. So download immediately and highlight information on Financial Performance KPI, Cash Balance Icon.
-
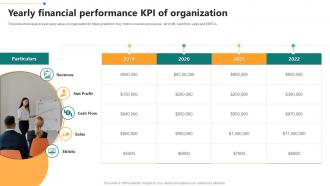 Yearly Financial Performance KPI Of Organization
This slide showcases to past years values of organization for future prediction. Key metrics covered are revenue, net profit, cash flow, sales and EBITDA. Presenting our set of slides with name Yearly Financial Performance KPI Of Organization. This exhibits information on five stages of the process. This is an easy-to-edit and innovatively designed PowerPoint template. So download immediately and highlight information on Revenue, Net Profit, Cash Flow, Sales.
-
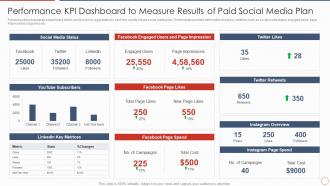 Performance KPI Dashboard To Measure Results Of Paid Social Media Plan
Following slide showcases a dashboard which can be used by organization to track the results of paid social media plan. The template provides information about key metrices such as social media status, engaged users, page impressions, page likes etc. Presenting our well structured Performance KPI Dashboard To Measure Results Of Paid Social Media Plan. The topics discussed in this slide are Performance KPI Dashboard To Measure Results Of Paid Social Media Plan. This is an instantly available PowerPoint presentation that can be edited conveniently. Download it right away and captivate your audience.
-
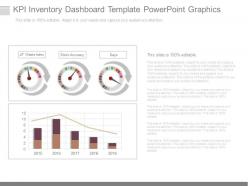 Kpi inventory dashboard template powerpoint graphics
Presenting kpi inventory dashboard template powerpoint graphics. This is a kpi inventory dashboard template powerpoint graphics. This is a three stage process. The stages in this process are jit waste index, stock accuracy, days.
-
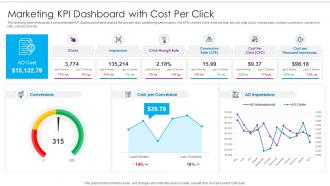 Marketing KPI Dashboard With Cost Per Click
The following slide showcases a comprehensive KPI dashboard used to analyze the pay per click advertising performance. The KPIs covered in the slide are total ad cost, total clicks, impressions, cost per conversion, conversion rate, cost per click etc. Presenting our well structured Marketing KPI Dashboard With Cost Per Click. The topics discussed in this slide are Clicks Impression, Click Though Rate, Conversion Rate, Cost Per, Click, Cost Per, Thousand Impressop. This is an instantly available PowerPoint presentation that can be edited conveniently. Download it right away and captivate your audience.
-
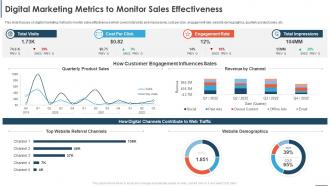 Automating Sales Processes To Improve Revenues Digital Marketing Metrics To Monitor Sales
This slide focuses on digital marketing metrics to monitor sales effectiveness which covers total visits and impressions, cost per click, engagement rate, website demographics, quarterly product sales, etc. Deliver an outstanding presentation on the topic using this Automating Sales Processes To Improve Revenues Digital Marketing Metrics To Monitor Sales. Dispense information and present a thorough explanation of Cost Per Click, Engagement Rate, Total Impressions, Total Visits using the slides given. This template can be altered and personalized to fit your needs. It is also available for immediate download. So grab it now.
-
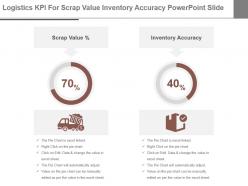 Logistics kpi for scrap value inventory accuracy powerpoint slide
Presenting logistics kpi for scrap value inventory accuracy powerpoint slide. This presentation slide shows two Key Performance Indicators or KPIs in a Dashboard style design. The first KPI that can be shown is Scrap Value percentage. The second KPI is Inventory Accuracy. These KPI Powerpoint graphics are all data driven, and the shape automatically adjusts according to your data. Just right click on the KPI graphic, enter the right value and the shape will adjust automatically. Make a visual impact with our KPI slides.
-
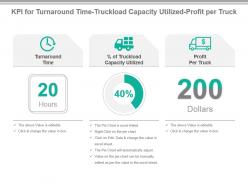 Kpi for turnaround time truckload capacity utilized profit per truck ppt slide
Presenting kpi for turnaround time truckload capacity utilized profit per truck ppt slide. This presentation slide shows Three Key Performance Indicators or KPIs in a Dashboard style design. The first KPI that can be shown is Turnaround Time. The second KPI is Percentage of Truckload Capacity Utilized. The third is Profit Per Truck. These KPI Powerpoint graphics are all data driven, and the shape automatically adjusts according to your data. Just right click on the KPI graphic, enter the right value and the shape will adjust automatically. Make a visual impact with our KPI slides.
-
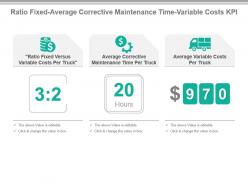 Ratio fixed average corrective maintenance time variable costs kpi presentation slide
Presenting ratio fixed average corrective maintenance time variable costs kpi presentation slide. This presentation slide shows Three Key Performance Indicators or KPIs in a Dashboard style design. The first KPI that can be shown is Ratio Fixed Versus Variable Costs Per Truck. The second KPI is Average Corrective Maintenance Time Per Truck. The third is Average Variable Costs Per Truck. These KPI Powerpoint graphics are all data driven, and the shape automatically adjusts according to your data. Just right click on the KPI graphic, enter the right value and the shape will adjust automatically. Make a visual impact with our KPI slides.
-
 Kpi for average maintenance costs time aircraft emissions presentation slide
Presenting kpi for average maintenance costs time aircraft emissions presentation slide. This presentation slide shows three Key Performance Indicators or KPIs in a Dashboard style design. The first KPI that can be shown is Average Maintenance Costs Per Airplane. The second KPI is Average Maintenance Time Per Airplane and the third is Aircraft Emissions Per Payload Capacity. These KPI Powerpoint graphics are all data driven, and the shape automatically adjusts according to your data. Just right click on the KPI graphic, enter the right value and the shape will adjust automatically. Make a visual impact with our KPI slides.
-
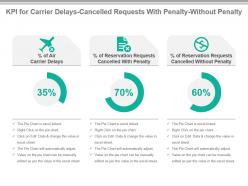 Kpi for carrier delays cancelled requests with penalty without penalty ppt slide
Presenting kpi for carrier delays cancelled requests with penalty without penalty ppt slide. This presentation slide shows three Key Performance Indicators or KPIs in a Dashboard style design. The first KPI that can be shown is Percentage of Air Carrier Delays. The second KPI is Percentage of Reservation Requests Cancelled With Penalty and the third is Percentage of Reservation Requests Cancelled Without Penalty. These KPI Powerpoint graphics are all data driven, and the shape automatically adjusts according to your data. Just right click on the KPI graphic, enter the right value and the shape will adjust automatically. Make a visual impact with our KPI slides.
-
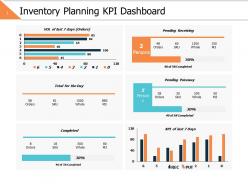 Inventory planning kpi dashboard ppt powerpoint presentation file clipart images
Presenting this set of slides with name - Inventory Planning Kpi Dashboard Ppt Powerpoint Presentation File Clipart Images. This is a six stage process. The stages in this process are Business, Management, Strategy, Analysis, Finance.
-
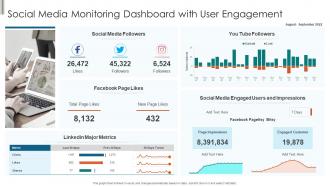 Social Media Monitoring Dashboard With User Engagement
Presenting our well structured Social Media Monitoring Dashboard With User Engagement. The topics discussed in this slide are Social Media, Major Metrics, Customer. This is an instantly available PowerPoint presentation that can be edited conveniently. Download it right away and captivate your audience.
-
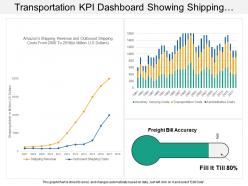 Transportation kpi dashboard showing shipping revenue and outbound shipping costs
Presenting transportation KPI dashboard showing shipping revenue and outbound shipping costs PPT slide. Simple data input like company logo, name or trademark. User can edit the data in linked excel sheet and graphs and charts gets customized accordingly .This PPT slide offers you plenty of space to put in titles and sub titles. High resolution based presentation layout, does not change the image even after resizing. This presentation icon is data driven and template can be downloaded via excel file to incorporate data.
-
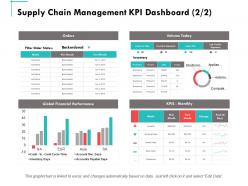 Supply chain management kpi dashboard business ppt powerpoint presentation summary maker
Presenting this set of slides with name - Supply Chain Management Kpi Dashboard Business Ppt Powerpoint Presentation Summary Maker. This is a four stages process. The stages in this process are Finance, Marketing, Management, Investment, Analysis.
-
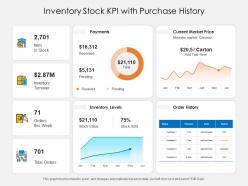 Inventory stock kpi with purchase history
Presenting this set of slides with name Inventory Stock KPI With Purchase History. The topics discussed in these slides are Inventory, Value, Market. This is a completely editable PowerPoint presentation and is available for immediate download. Download now and impress your audience.
-
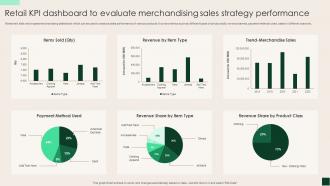 Retail KPI Dashboard To Evaluate Merchandising Sales Strategy Performance
Mentioned slide showcases merchandising dashboard which can be used to analyze sales performance of various products. It covers metrics such as different types of product sold, revenue earned, payment methods used, sales in different years etc. Introducing our Retail KPI Dashboard To Evaluate Merchandising Sales Strategy Performance set of slides. The topics discussed in these slides are Retail KPI, Dashboard, Merchandising, Sales Strategy, Performance. This is an immediately available PowerPoint presentation that can be conveniently customized. Download it and convince your audience.
-
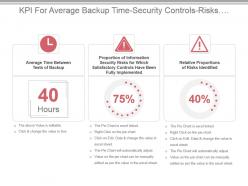 Kpi for average backup time security controls risks identified powerpoint slide
Presenting kpi for average backup time security controls risks identified powerpoint slide. This presentation slide shows three Key Performance Indicators or KPIs in a Dashboard style design. The first KPI that can be shown is Average Time Between Tests of Backup. The second KPI is Proportion of Information Security Risks for Which Satisfactory Controls Have Been Fully Implemented and the third is Relative Proportions of Risks Identified. These KPI Powerpoint graphics are all data driven,and the shape automatically adjusts according to your data. Just right click on the KPI graphic,enter the right value and the shape will adjust automatically. Make a visual impact with our KPI slides.
-
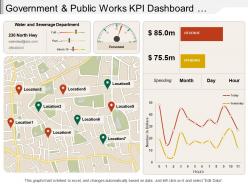 Government and public works kpi dashboard showing water sewerage department
Presenting the KPI dashboard PPT template. This KPI presentation layout is 100% modifiable and is designed professionally. You can edit the objects in this slide like font color and font size without going through any fuss. This presentation template is 100% compatible with Google Slide and can be saved in JPG or PDF file format hassle-free. To download this, click on the button below.
-
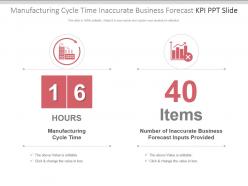 Manufacturing cycle time inaccurate business forecast kpi ppt slide
Presenting manufacturing cycle time inaccurate business forecast kpi ppt slide. This presentation slide shows two Key Performance Indicators or KPIs in a Dashboard style design. The first KPI that can be shown is Manufacturing Cycle Time. The second KPI is Number of Inaccurate Business Forecast Inputs Provided. These KPI Powerpoint graphics are all data driven, and the shape automatically adjusts according to your data. Just right click on the KPI graphic, enter the right value and the shape will adjust automatically. Make a visual impact with our KPI slides.
-
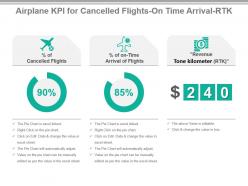 Airplane kpi for cancelled flights ontime arrival rtk powerpoint slide
Presenting airplane kpi for cancelled flights ontime arrival rtk powerpoint slide. This presentation slide shows three Key Performance Indicators or KPIs in a Dashboard style design. The first KPI that can be shown is percentage of Cancelled Flights. The second KPI is percentage of on Time Arrival of Flights and the third is Revenue Tone kilometer RTK. These KPI Powerpoint graphics are all data driven, and the shape automatically adjusts according to your data. Just right click on the KPI graphic, enter the right value and the shape will adjust automatically. Make a visual impact with our KPI slides.
-
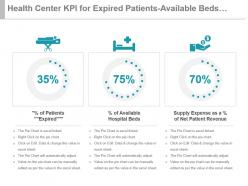 Health center kpi for expired patients available beds supply expense powerpoint slide
Presenting health center kpi for expired patients available beds supply expense powerpoint slide. This presentation slide shows three Key Performance Indicators or KPIs in a Dashboard style design. The first KPI that can be shown is Percentage of Patients Expired. The second KPI is Percentage of Available Hospital Beds and the third is Supply Expense as a percentage of Net Patient Revenue. These KPI Powerpoint graphics are all data driven, and the shape automatically adjusts according to your data. Just right click on the KPI graphic, enter the right value and the shape will adjust automatically. Make a visual impact with our KPI slides.
-
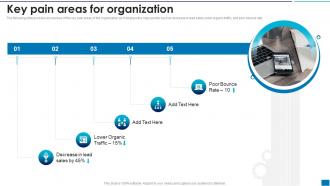 Developing New Search Engine Key Pain Areas For Organization
The following slide provides an overview of the key pain areas of the organization as it displays the major points such as decrease in lead sales, lower organic traffic, and poor bounce rate. Increase audience engagement and knowledge by dispensing information using Purpose of the following slide is to show the key metrics of measuring the organizations SEO performance, these metrics can be lead generated, organic traffic, keywords ranking, bounce rate, page per session etc.. This template helps you present information on five stages. You can also present information on Decrease Lead Sales, Lower Organic Traffic, Poor Bounce Rate using this PPT design. This layout is completely editable so personaize it now to meet your audiences expectations.
-
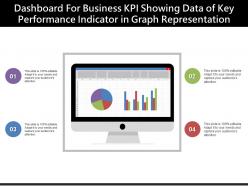 Dashboard for business kpi showing data of key performance indicator in graph representation
Presenting this set of slides with name - Dashboard For Business Kpi Showing Data Of Key Performance Indicator In Graph Representation. This is a four stage process. The stages in this process are Business Kpi, Business Dashboard, Business Metrics.
-
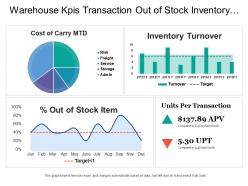 Warehouse kpis transaction out of stock inventory return carry cost
Presenting this set of slides with name - Warehouse Kpis Transaction Out Of Stock Inventory Return Carry Cost. This is a four stage process. The stages in this process are Warehouse Kpi, Warehouse Dashboard, Warehouse Metrics.
-
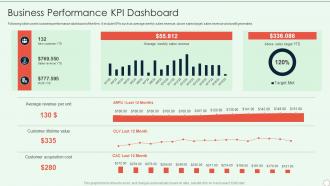 Brand Development Guide Business Performance KPI Dashboard
Following slide covers business performance dashboard of the firm. It include KPIs such as average weekly sales revenue, above sales target, sales revenue and profit generated. Present the topic in a bit more detail with this Brand Development Guide Business Performance KPI Dashboard. Use it as a tool for discussion and navigation on Average Revenue Per Unit, Customer Lifetime Value, Customer Acquisition Cost. This template is free to edit as deemed fit for your organization. Therefore download it now.
-
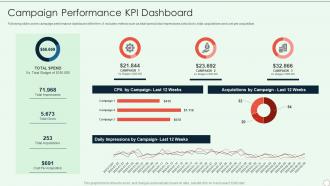 Brand Development Guide Campaign Performance KPI Dashboard
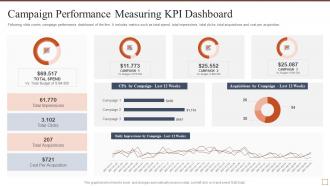
Following slide covers campaign performance dashboard of the firm. It includes metrics such as total spend, total impressions, total clicks, total acquisitions and cost per acquisition. Deliver an outstanding presentation on the topic using this Brand Development Guide Campaign Performance KPI Dashboard. Dispense information and present a thorough explanation of Acquisitions By Campaign, CPA By Campaign, Impressions, Daily Impressions By Campaign, Acquisitions using the slides given. This template can be altered and personalized to fit your needs. It is also available for immediate download. So grab it now.
-
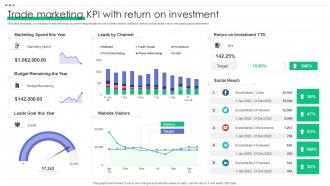 Trade Marketing KPI With Return On Investment
This slide templates covers about trade marketing key performing indicators with website visitors, leads by channel, social media reach with yearly goal achievement. Presenting our well structured Trade Marketing KPI With Return On Investment. The topics discussed in this slide are Marketing Spend, Return Investment YTD, Budget Remaining Year. This is an instantly available PowerPoint presentation that can be edited conveniently. Download it right away and captivate your audience.
-
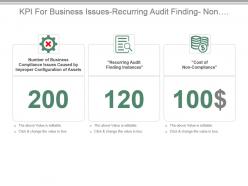 Kpi for business issues recurring audit finding non compliance cost powerpoint slide
Presenting kpi for business issues recurring audit finding non compliance cost powerpoint slide. This presentation slide shows three Key Performance Indicators or KPIs in a Dashboard style design. The first KPI that can be shown is Number of Business Compliance Issues Caused by Improper Configuration of Assets. The second KPI is Recurring Audit Finding Instances and the third is Cost of Non Compliance. These KPI Powerpoint graphics are all data driven,and the shape automatically adjusts according to your data. Just right click on the KPI graphic,enter the right value and the shape will adjust automatically. Make a visual impact with our KPI slides.
-
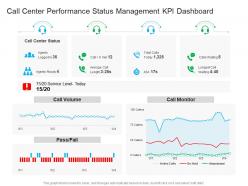 Call center performance status management kpi dashboard
Introducing our Call Center Performance Status Management KPI Dashboard set of slides. The topics discussed in these slides are Call Center Performance Status Management KPI Dashboard. This is an immediately available PowerPoint presentation that can be conveniently customized. Download it and convince your audience.
-
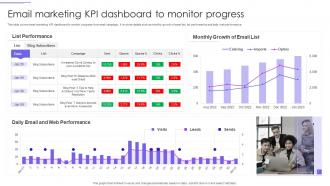 Email Marketing Kpi Dashboard To Monitor Progress
This slide covers email marketing KPI dashboard to monitor progress from email campaign. It involves details such as monthly growth of email list, list performance and daily web performance. Presenting our well structured Email Marketing KPI Dashboard To Monitor Progress. The topics discussed in this slide are List Performance, Monthly Growth, Email List, Web Performance, Daily Email. This is an instantly available PowerPoint presentation that can be edited conveniently. Download it right away and captivate your audience.
-
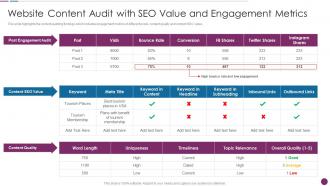 F414 Website Content Audit With Seo Value And Engagement Procedure To Perform Digital Marketing Audit
This slide highlights the content auditing findings which includes engagement metrics of different posts, content quality and content SEO value. Present the topic in a bit more detail with this F414 Website Content Audit With Seo Value And Engagement Procedure To Perform Digital Marketing Audit. Use it as a tool for discussion and navigation on Post Engagement Audit, Content Seo Value, Content Quality. This template is free to edit as deemed fit for your organization. Therefore download it now.
-
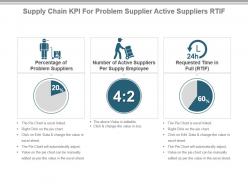 Supply chain kpi for problem supplier active suppliers rtif ppt slide
Presenting supply chain kpi for problem supplier active suppliers rtif ppt slide. This presentation slide shows three Key Performance Indicators or KPIs in a Dashboard style design. The first KPI that can be shown is Percentage of Problem Suppliers. The second KPI is Number of Active Suppliers Per Supply Employee and the third is Requested Time in Full or RTIF. These KPI Powerpoint graphics are all data driven, and the shape automatically adjusts according to your data. Just right click on the KPI graphic, enter the right value and the shape will adjust automatically. Make a visual impact with our KPI slides.
-
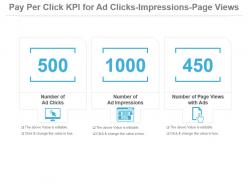 Pay per click kpi for ad clicks impressions page views presentation slide
Presenting pay per click kpi for ad clicks impressions page views presentation slide. This presentation slide shows Three Key Performance Indicators or KPIs in a Dashboard style design. The first KPI that can be shown is Number of Ad Clicks. The second KPI is Number of Ad Impressions. The third is Number of Page Views with Ads. These KPI Powerpoint graphics are all data driven, and the shape automatically adjusts according to your data. Just right click on the KPI graphic, enter the right value and the shape will adjust automatically. Make a visual impact with our KPI slides.
-
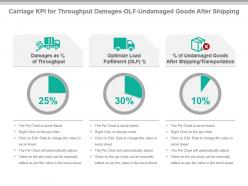 Carriage kpi for throughput damages olf undamaged goods after shipping ppt slide
Presenting carriage kpi for throughput damages olf undamaged goods after shipping ppt slide. This presentation slide shows three Key Performance Indicators or KPIs in a Dashboard style design. The first KPI that can be shown is Damages as percentage of Throughput. The second KPI is Optimize Load Fulfilment OLF percentage and the third is percentage of Undamaged Goods After Shipping Transportation. These KPI Powerpoint graphics are all data driven, and the shape automatically adjusts according to your data. Just right click on the KPI graphic, enter the right value and the shape will adjust automatically. Make a visual impact with our KPI slides.
-
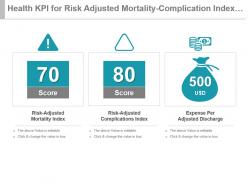 Health kpi for risk adjusted mortality complication index expense per discharge ppt slide
Presenting health kpi for risk adjusted mortality complication index expense per discharge ppt slide. This presentation slide shows three Key Performance Indicators or KPIs in a Dashboard style design. The first KPI that can be shown is Risk Adjusted Mortality Index. The second KPI is Risk Adjusted Complications Index and the third is Expense Per Adjusted Discharge. These KPI Powerpoint graphics are all data driven, and the shape automatically adjusts according to your data. Just right click on the KPI graphic, enter the right value and the shape will adjust automatically. Make a visual impact with our KPI slides.
-
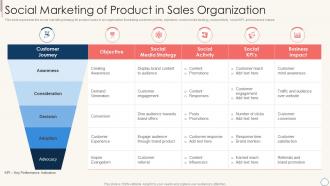 Social Marketing Of Product In Sales Organization
This slide represents the social marketing strategy for product sales in an organization illustrating customer journey, objectives, social media strategy, social activity, social KPI, and business impact. Presenting our well structured Social Marketing Of Product In Sales Organization. The topics discussed in this slide are Awareness, Consideration, Decision. This is an instantly available PowerPoint presentation that can be edited conveniently. Download it right away and captivate your audience.
-
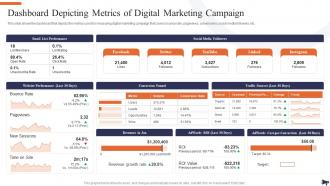 Dashboard Depicting Metrics Of Digital Marketing Campaign Optimization Of E Commerce Marketing Services
This slide shows the dashboard that depicts the metrics used for measuring digital marketing campaign that covers bounce rate, pageviews, conversions, social media followers, etc. Present the topic in a bit more detail with this Dashboard Depicting Metrics Of Digital Marketing Campaign Optimization Of E Commerce Marketing Services. Use it as a tool for discussion and navigation on Dashboard, Marketing Campaign, Conversions. This template is free to edit as deemed fit for your organization. Therefore download it now.
-
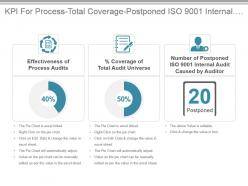 Kpi for process total coverage postponed iso 9001 internal audit ppt slide
Presenting kpi for process total coverage postponed iso 9001 internal audit ppt slide. This presentation slide shows three Key Performance Indicators or KPIs in a Dashboard style design. The first KPI that can be shown is Effectiveness of Process Audits. The second KPI is percentage Coverage of Total Audit Universe and the third is Number of Postponed ISO 9001 Internal Audit Caused by Auditor. These KPI Powerpoint graphics are all data driven,and the shape automatically adjusts according to your data. Just right click on the KPI graphic,enter the right value and the shape will adjust automatically. Make a visual impact with our KPI slides.
-
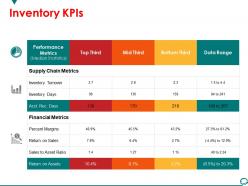 Inventory kpis powerpoint slide design templates
Presenting inventory kpis powerpoint slide design templates. This is a inventory kpis powerpoint slide design templates. This is a three stage process. The stages in this process are supply chain metrics, financial metrics, return on assets, performance metrics, top third.
-
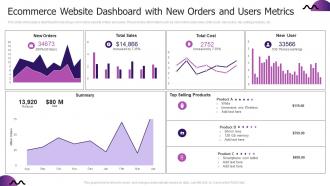 Ecommerce Website Dashboard With New Orders And Users Metrics
This slide showcases a dashboard for tracking e commerce website orders and users. This provides information such as new orders, total sales, total costs, new users, top-selling products, etc. Introducing our Ecommerce Website Dashboard With New Orders And Users Metrics set of slides. The topics discussed in these slides are Ecommerce Website Dashboard, New Orders, Users Metrics. This is an immediately available PowerPoint presentation that can be conveniently customized. Download it and convince your audience.
-
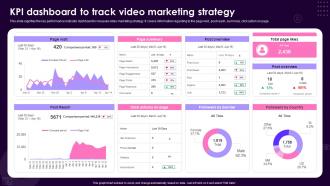 KPI Dashboard Snapshot To Track Video Marketing Strategy
This slide signifies the key performance indicator dashboard to measure video marketing strategy. It covers information regarding to the page visit, post reach, summary, click action on page. Introducing our KPI Dashboard Snapshot To Track Video Marketing Strategy set of slides. The topics discussed in these slides are KPI Dashboard, Video Marketing Strategy. This is an immediately available PowerPoint presentation that can be conveniently customized. Download it and convince your audience.
-
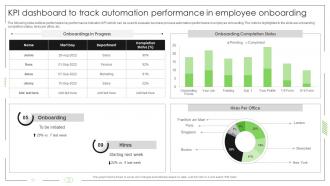 Business Process Automation KPI Dashboard To Track Automation Performance In Employee Onboarding
The following slide outlines performance key performance indicator KPI which can be used to evaluate business process automation performance in employee onboarding. The metrics highlighted in the slide are onboarding completion status, hires per office, etc.Present the topic in a bit more detail with this Business Process Automation KPI Dashboard To Track Automation Performance In Employee Onboarding. Use it as a tool for discussion and navigation on Onboarding, Completion Status, Hires Office. This template is free to edit as deemed fit for your organization. Therefore download it now.
-
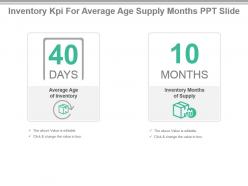 Inventory kpi for average age supply months ppt slide
Presenting inventory kpi for average age supply months ppt slide. This presentation slide shows Two Key Performance Indicators or KPIs. The first KPI that can be show is Average Age of Inventory. The second KPI is Inventory Months of Supply. These KPI Powerpoint graphics are all data driven, and the shape automatically adjusts according to your data. Just right click on the KPI graphic, enter the right value and the shape will adjust automatically. Make a visual impact with our KPI slides.
-
 Supply chain kpi for lead time items equipped items tracked presentation slide
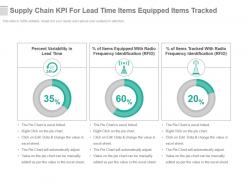
Presenting supply chain kpi for lead time items equipped items tracked presentation slide. This presentation slide shows three Key Performance Indicators or KPIs in a Dashboard style design. The first KPI that can be shown is Percent Variability in Lead Time. The second KPI is percentage of Items Equipped With Radio Frequency Identification or RFID and the third is percentage of Items Tracked With Radio Frequency Identification or RFID. These KPI Powerpoint graphics are all data driven, and the shape automatically adjusts according to your data. Just right click on the KPI graphic, enter the right value and the shape will adjust automatically. Make a visual impact with our KPI slides.
-
 Shipping kpi for empty miles on time pickups freight bill accuracy powerpoint slide
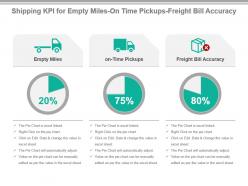
Presenting shipping kpi for empty miles on time pickups freight bill accuracy powerpoint slide. This presentation slide shows three Key Performance Indicators or KPIs in a Dashboard style design. The first KPI that can be shown is Empty Miles. The second KPI is on Time Pickups and the third is Freight Bill Accuracy. These KPI Powerpoint graphics are all data driven, and the shape automatically adjusts according to your data. Just right click on the KPI graphic, enter the right value and the shape will adjust automatically. Make a visual impact with our KPI slides.
-
 Kpi for patient nights average number of nurses per patient presentation slide
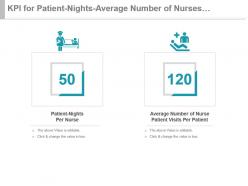
Presenting kpi for patient nights average number of nurses per patient presentation slide. This presentation slide shows two Key Performance Indicators or KPIs in a Dashboard style design. The first KPI that can be shown is Patient Nights Per Nurse. The second KPI is Average Number of Nurse Patient Visits Per Patient. These KPI Powerpoint graphics are all data driven, and the shape automatically adjusts according to your data. Just right click on the KPI graphic, enter the right value and the shape will adjust automatically. Make a visual impact with our KPI slides.
-
 Campaign performance measuring kpi dashboard effective brand building strategy
Present the topic in a bit more detail with this Campaign Performance Measuring KPI Dashboard Effective Brand Building Strategy. Use it as a tool for discussion and navigation on Campaign Performance Measuring KPI DashboardFollowing slide covers campaign performance dashboard of the firm. It includes metrics such as total spend, total impressions, total clicks, total acquisitions and cost per acquisition. . This template is free to edit as deemed fit for your organization. Therefore download it now.
-
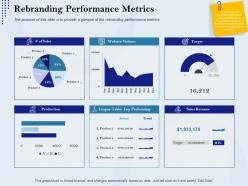 Rebranding performance metrics rebranding approach ppt pictures
The purpose of this slide is to provide a glimpse of the rebranding performance metrics.Deliver an outstanding presentation on the topic using this Rebranding Performance Metrics Rebranding Approach Ppt Pictures. Dispense information and present a thorough explanation of Website Visitors, Target, Sales Revenue, League Table Top Performing, Production using the slides given. This template can be altered and personalized to fit your needs. It is also available for immediate download. So grab it now.
-
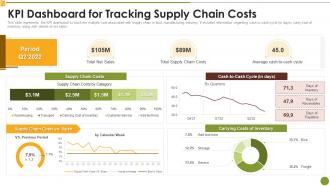 Kpi Dashboard For Tracking Supply Chain Costs Market Research Report
This slide represents the KPI dashboard to track the multiple cost associated with supply chain in food manufacturing industry. It includes information regarding cash to cash cycle in days, carry cost of inventory along with details of net sales. Deliver an outstanding presentation on the topic using this Kpi Dashboard For Tracking Supply Chain Costs Market Research Report. Dispense information and present a thorough explanation of KPI Dashboard For Tracking Supply Chain Costs using the slides given. This template can be altered and personalized to fit your needs. It is also available for immediate download. So grab it now.


