Businesses have to deal with a large amount of data every day. They collect this pile of data in the hope of using it to grow their business. Problem? The data is in raw form and has to be audited to ensure better usage. So today, data audits have become a crucial part of almost every business’s strategy. Data audits can verify the accuracy and quality of the available data. This can help businesses make the proper usage of this data and utilize it in the right way. Regular audits ensure compliance with accounting norms, and maintain the integrity of information systems. Thus, data audits have become a norm, and the industry has emerged as a sunrise sector of the future. Numbers also back it up. The global auditing services market is expected to grow at a 4.11% CAGR between 2024 and 2029. This clearly shows how popular data auditing is becoming among users. Industries like healthcare, IT and telecommunications, and BFSI (Market Data Forecast) are the primary organizations that give too much importance to data auditing today. The reason is technological advancements and the need to filter out all the junk data.
The only problem? A lot of businesses lack the framework for data auditing. As the industry is new and the process is a bit complex, many businesses struggle to perform data audits. Now, our data-auditing templates play a major role in ensuring that everything in numbers is vetted and accurate. These 100% editable and content-ready templates can lay the foundation for your data auditing.
Let's explore.
Template #1: Audit Dashboard Powerpoint PPT Template Bundles
This PPT Template is a holistic solution that can enhance your audit workflows through data visualization. This resource gathers essential audit-related data across aspects of business operations into a centralized, easy-to-understand format. What more do you need, right? This template also includes analysis tools for evaluating audit software. It also compares prices and performance features. This ensures the selection of the best-fit tool for an organization’ needs. This template quantifies quality observations, human resource allocations, and time spent on risk areas for internal audits, especially in IT.
Template #2: Internal Audit KPI Analysis Dashboard
This template is designed to track comprehensive internal audits. It features metrics that help audit the data with accuracy, for example. The Quarterly Audit Observations show the difference between significant, moderate, and low concerns. Similarly, the Financial Year Internal Audit Plan Status pie chart showcases the audit's progress. This includes the completed and ongoing segments. It can also help assess the staff and contractors, along with forecasted hours. This helps team leaders allocate human resources. The dashboard also displays the time spent on high-risk areas and benchmark performance against set targets with bar graphs. The bar graphs include the Audit Report Cycle, Management Response Time, and Remediation Time. All of these help auditors identify and fix the areas that need optimization.
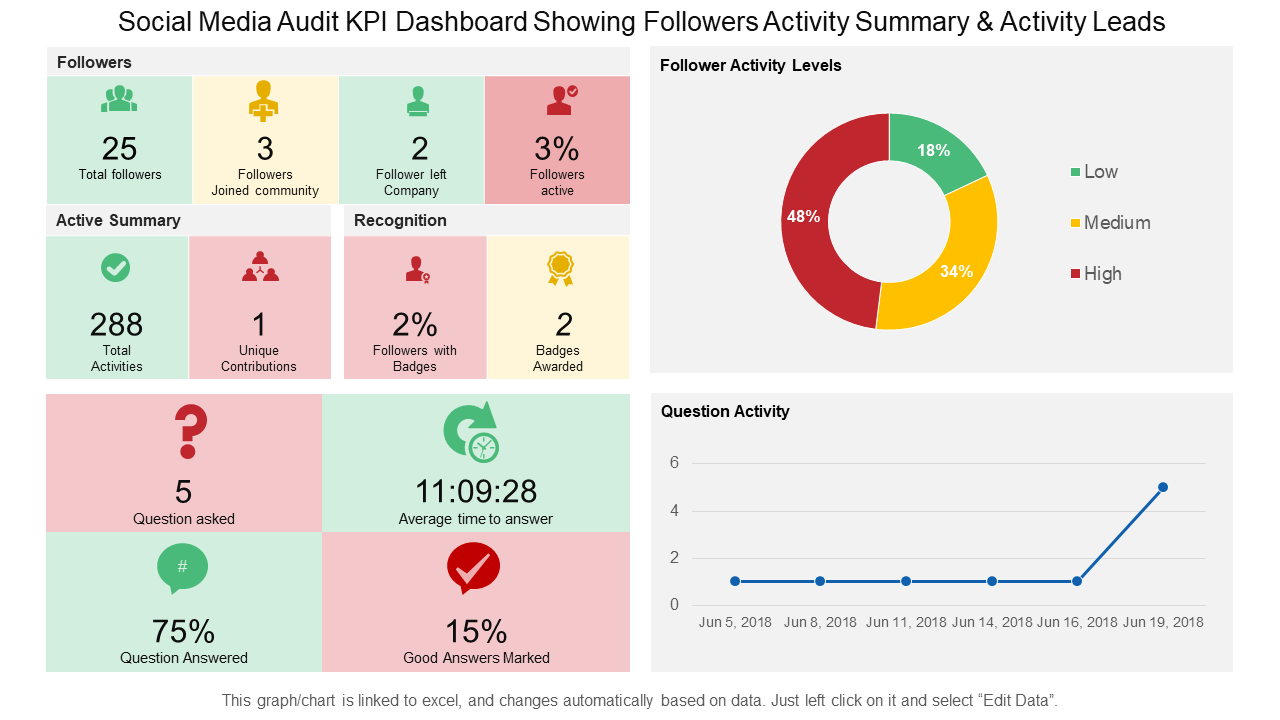
Template #3: Social Media Audit KPI Dashboard Showing Followers Activity Summary and Activity Leads
This summary template helps track and present follower activity levels and engagement metrics on social media platforms. The PPT notes down the total follower count, new community members, and the percentage of active followers. Result? The viewers get a glance at audience growth and engagement. This template can also help monitor content interaction through total activities. The best part? The 'Question Activity' graph shows the frequency of queries over time, while the 'Average time to answer' and 'Good Answers Marked' percentages assess responsiveness and interaction quality. This is the most significant information that can help improve response rates.
Template #4: Internal Audit Dashboard Overview of Internal Audit Planning Checklist
Use this template to bind audit-related metrics into an exhaustive visual representation. This template has a filter pane that allows you to select and view the analysis based on geography, business process, and risk level. The Risk Rating of Planned Audits pie chart is the heart of this template. It presents the proportion of high, medium, and low-risk audits. The Status of Planned Audits and Results of Completed Audits gives a quick insight into the audit's progress and outcomes. This slide can help with internal auditing and planning for any industry.
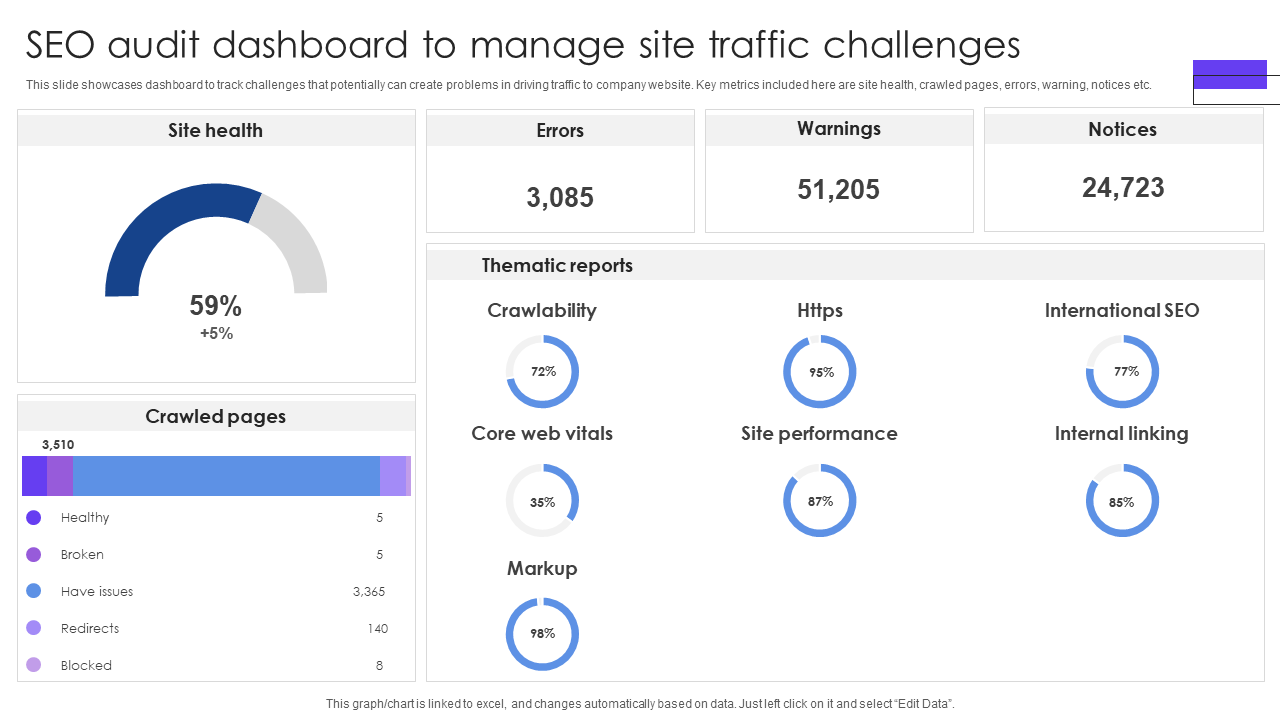
Template #5: SEO Audit Dashboard to Manage Site Traffic Challenges
Are you on the hunt of a gold mine for SEO experts? Are you itching to diagnose your website's performance and SEO health? This slide covers information like site health and displays the number of crawled web pages. It also gives information about healthy, broken, and pages with issues. This template gives a clear insight into the areas that need attention using multiple key indicators like error counts, warnings, and notices.
Template #6: Complete Guide to Conduct Digital Audit Dashboard Highlighting Website Visitors with Device
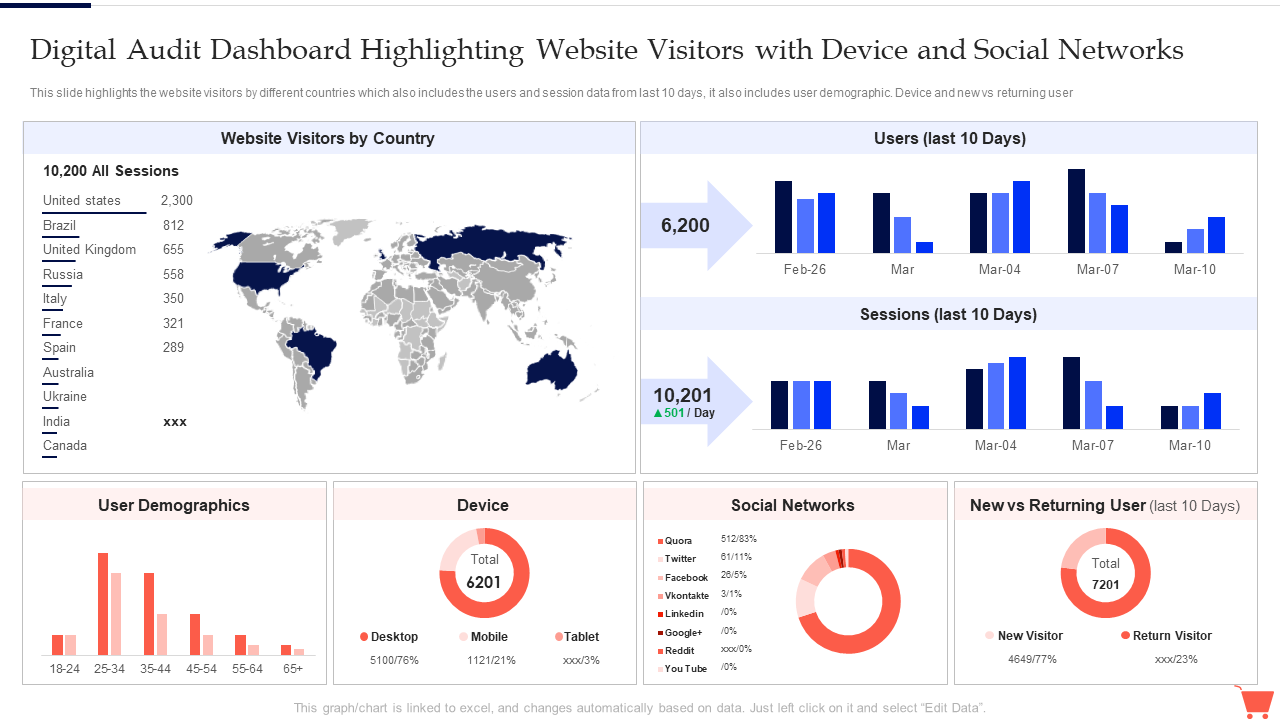
If you are looking for a template that can help you audit a website's performance and audience engagement, this template is the solution. This template charts the website visitors by country and offers a clear indication of the geographic distribution of traffic. It also showcases user demographics, which can help analyze age-based visitor trends. Apart from that, the template covers critical points like the breakdown of device usage—desktop, mobile, and tablet. Benefit? You can tailor your targeted device strategy. Finally, the template also compares new and returning users. It can help you gauge visitor loyalty and content stickiness.
Template #7: Audit KPI Dashboard Showing Audit Status Auditable Entry Risk Rating
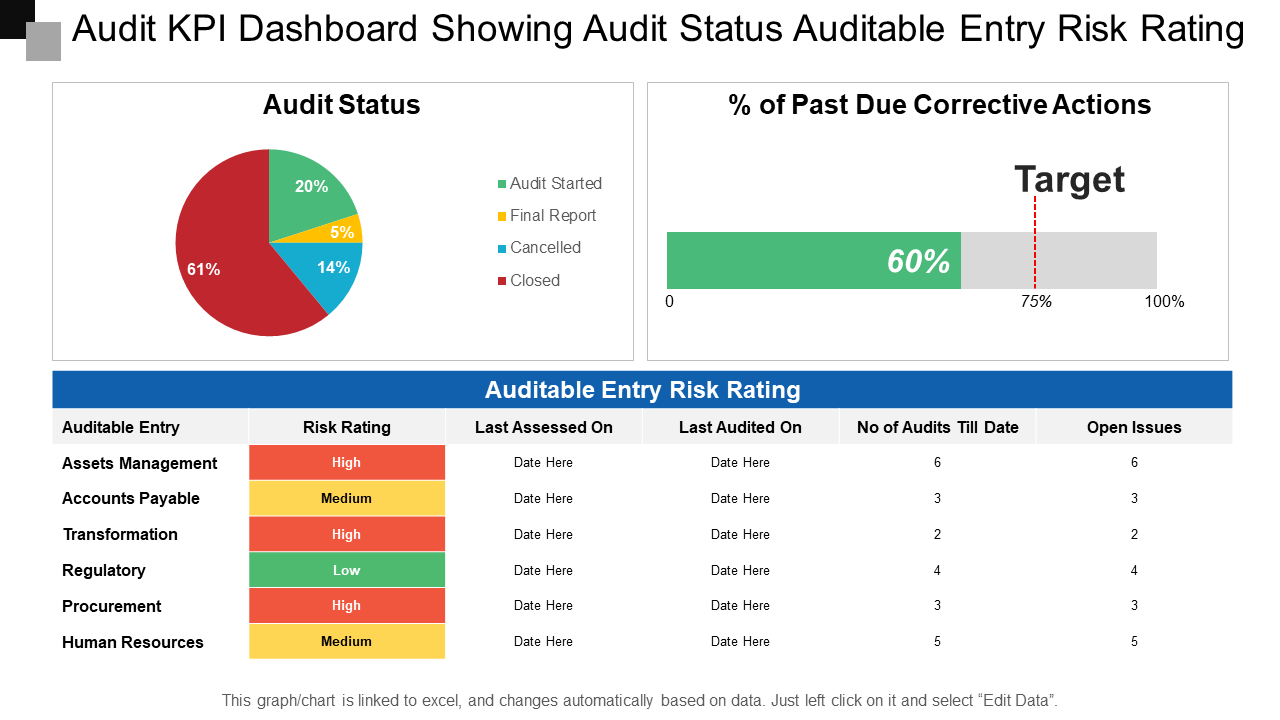
You have performed audits in your organization; that's great. But how do you monitor the outcomes of these audits? Well, that's what this template is designed for. This auditable entry risk rating template features a pie chart that showcases audit status. It also covers the percentage of audits according to the stage each is in, such as starting, final report, canceled, and closed. The bar graph shows the percentage of past-due corrective actions against a target. This indicates the effectiveness of the response to audit findings. The table in the template lists auditable entries that cover risk ratings, last assessed dates, the number of audits to date, and open issues.
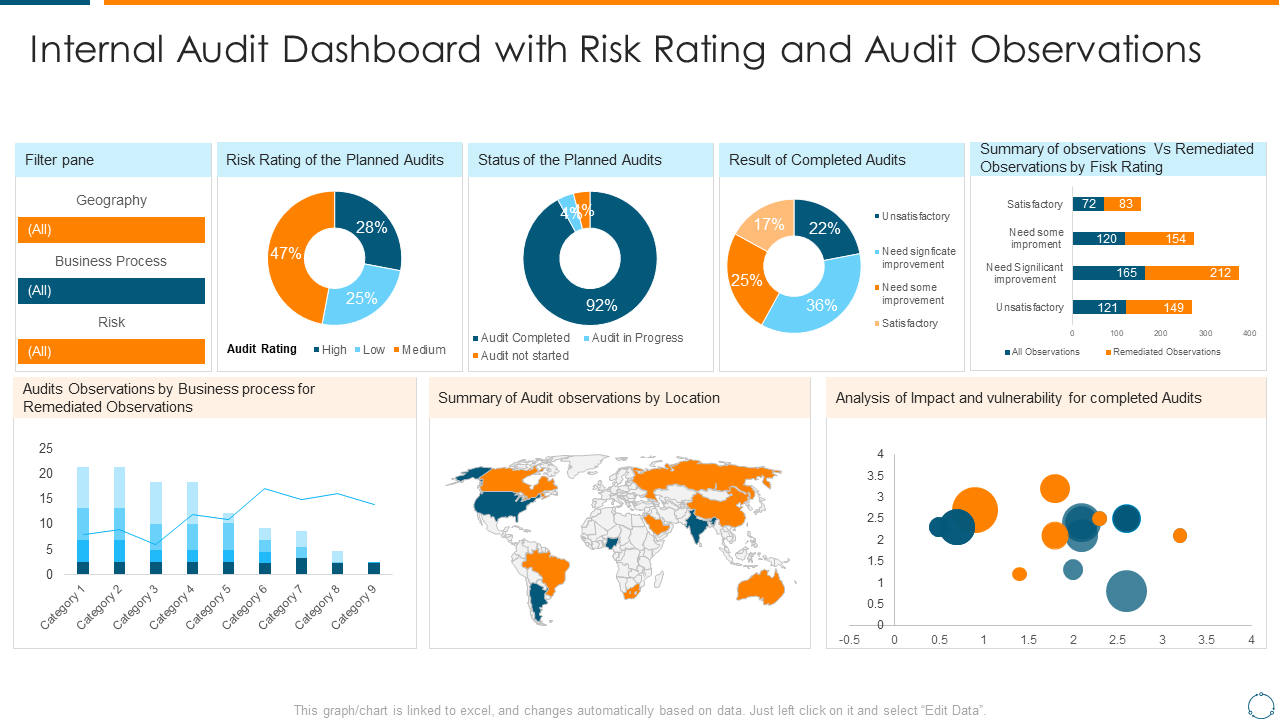
Template #8: Audit KPI Dashboard Showing Risk Ratings Planned Audit Status
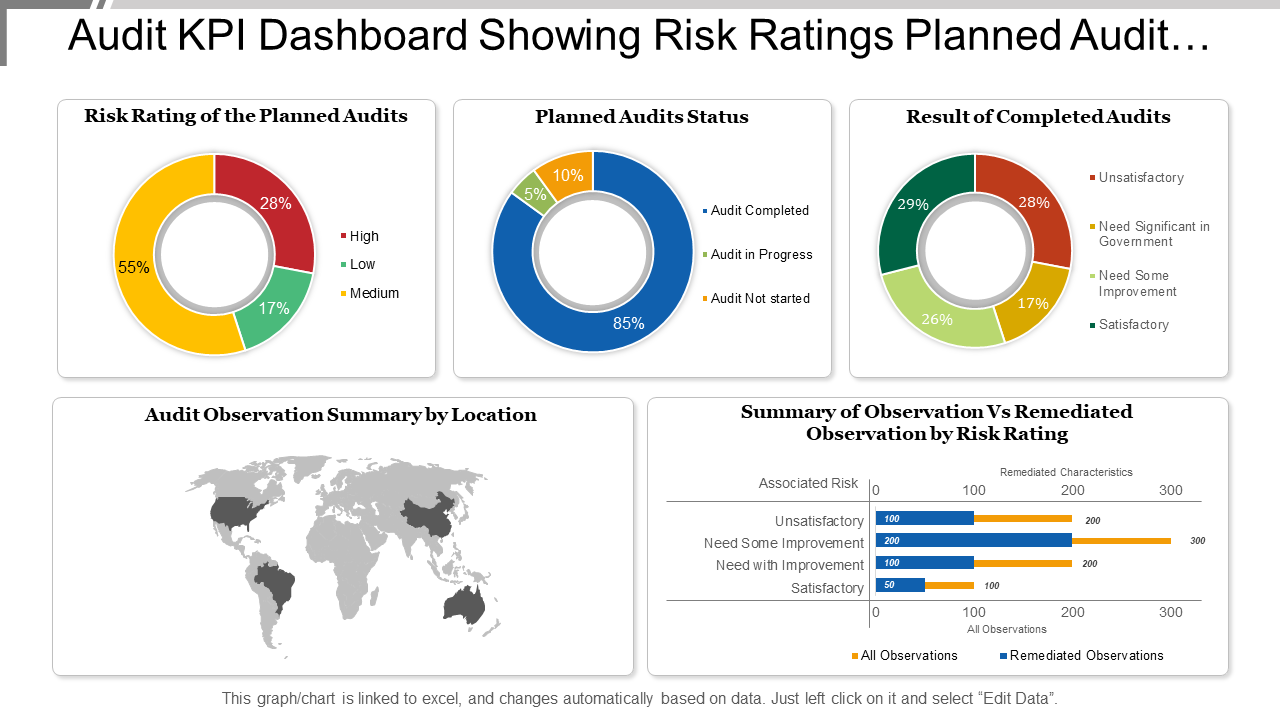
This template gives a visual cue of audit risk ratings and statuses for streamlining audit management. This template displays the risk ratings of planned audits, with color-coded segments indicating the proportion of high, medium, and low-risk audits. This allows for prioritized scheduling. The dashboard can also help track progress of ongoing audits. This helps identify the completed, in progress, or not yet started audits. Benefit? This helps in ensuring accountability and efficiency in the audit cycle. The results of completed audits are segmented into satisfaction levels, which offer immediate feedback on audit performance. Finally, a world map shows the geographical distribution of audit observations, while a horizontal bar graph determines the total observations against those that have been remediated by risk rating.
Template #9: Audit Dashboard Snapshot with Different Tabs
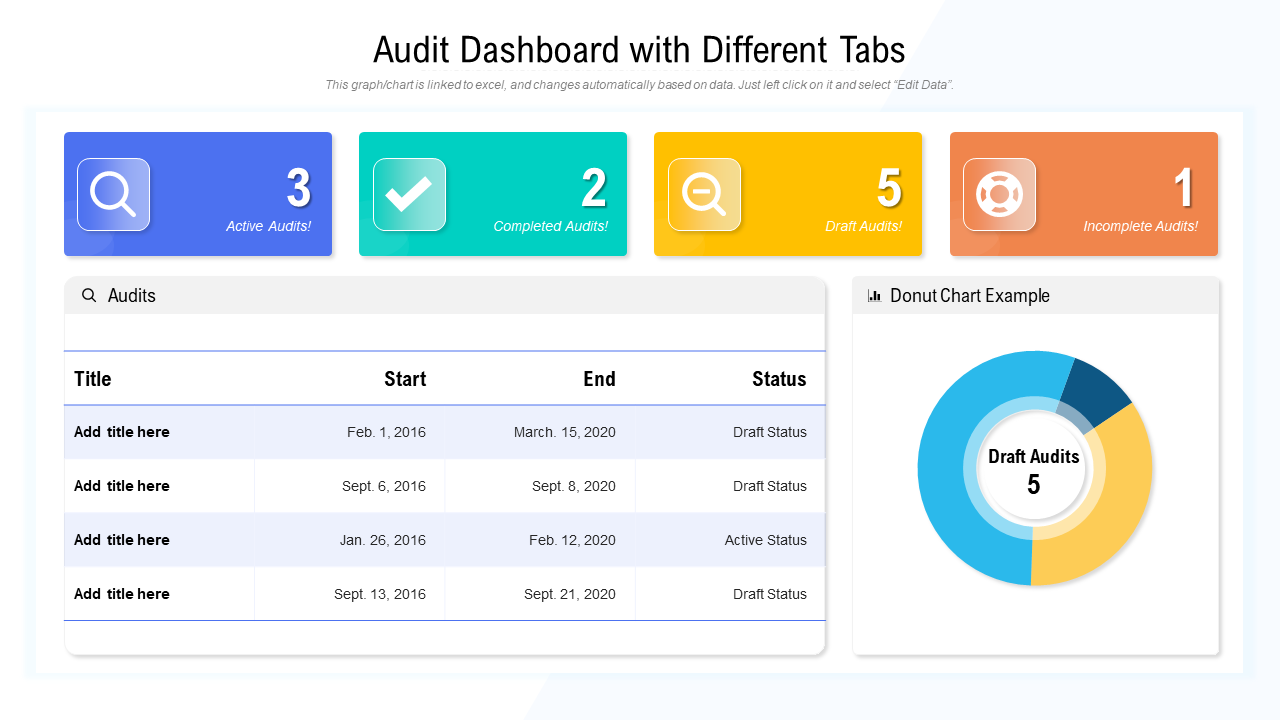
This template is structured with tabs to organize audit workflow. It reflects multiple stages of adult tasks. It gives an overview of active, completed, draft, and incomplete audits. The best part? It uses color-coded buttons to distinguish them easily. The donut chart example gives a summary and highlights the number of draft audits. The table format below lists individual audits with titles, start and end dates, and their current status. This helps in tracking and management. This dashboard focuses on streamlining the organization of audit activities and progress tracking.
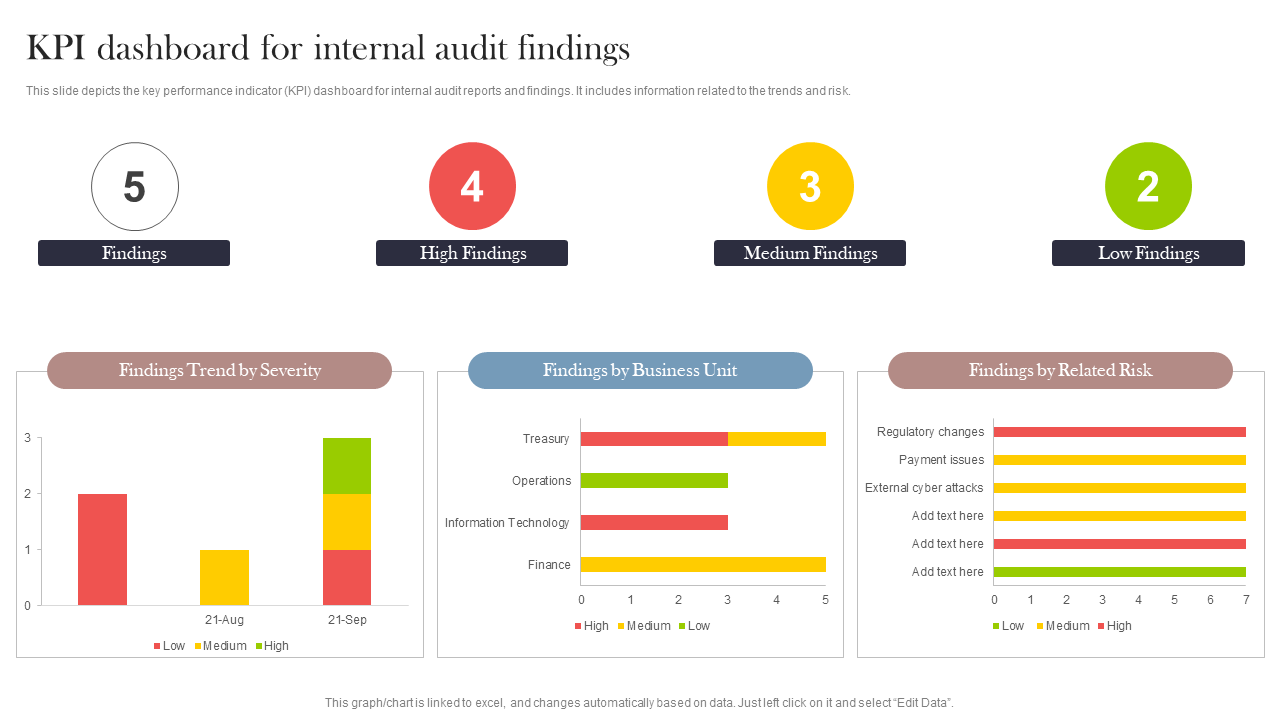
Template #10: KPI Dashboard for Internal Audit Findings
This template presents a count of findings categorized by severity: High, medium, and low. It visualizes trends and offers insight into whether audit findings are increasing or decreasing. This is essential for gauging the effectiveness of internal controls and risk management efforts. The dashboard also breaks down findings by business unit and associated risk. It helps highlight areas like Treasury, Operations, and IT that may require focused attention. The dashboard aids in proactive risk assessment and management by quantifying and categorizing audit findings in this way.
Improving audit processes helps all stakeholders
Data audits are becoming a norm in the operational strategy of contemporary businesses. As the amount of data is going through the roof, it's important for businesses to utilize efficient data audits. Our templates are designed to help businesses streamline this auditing process and empower businesses to use their data effectively. So do not wait; download our templates and improve your auditing process like never before.


 Customer Reviews

