

 Customer Reviews
Rome wasn’t built in a day. They kept adding bricks every day. That’s progress!
As humans, we have an innate desire to complete tasks and check them off our to-do lists. This gives us a sense of achievement and the motivation to move on to the next task. However, this obsession with finishing things can lead to what's known as Completion Bias: This means our brain often prioritizes the quick satisfaction of completing small tasks over working on larger or more complex ones.
Not everything we do can be quantified easily or completed quickly. Many significant projects take time and effort and can't be accomplished in a single day.
The most important thing for boosting motivation at work is making progress on meaningful tasks. Just like we enjoy completing small tasks on our to-do lists, making even a small step toward a big goal can be highly motivating. However, we often overlook these ‘small wins’ because they are difficult to measure.
It’s easy to get overwhelmed and feel defeated when all you see is a huge goal looming. Our minds naturally seek structure and validation, and the simplest way to find it is by focusing on and acknowledging what's right in front of us. When it comes to meaningful work, we must combat this feeling of overwhelmedness that large projects can create.
To stay dedicated to the most important work, we must find ways to measure, monitor, and feel a sense of accomplishment in our daily progress, even if the task is not fully completed.
To measure and monitor your progress regularly, SlideTeam presents you with our Top 10 Progress Dashboard Templates. The 100% customizable nature of the templates provides you with the desired flexibility to edit and create a dashboard for your project. The content-ready slides give you a structure to get started and build a progress-tracking system for your organization.
Let’s explore these templates!
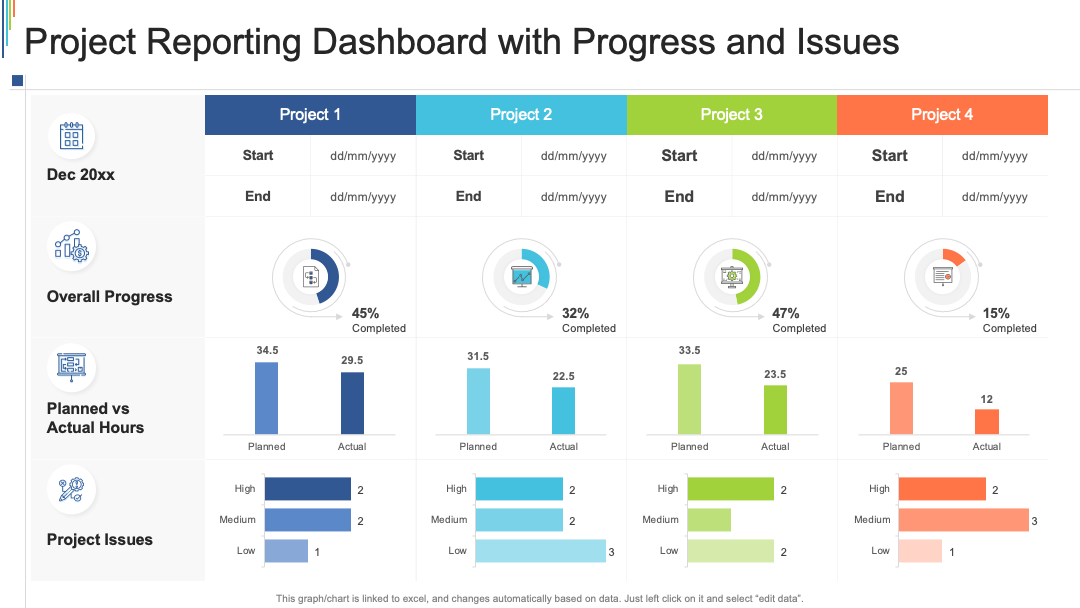
Template 1: Project Reporting Dashboard with Progress and Issues PPT Template
This PPT Template will enable you to keep track of progress and issues on the same dashboard. You can keep track of multiple projects and for each Project, you can record its start and end dates, the overall progress, planned vs. actual hours utilized, and projected issues. The overall progress can be tracked on a circular infographic, enabling quick interpretation just at a glance. With the help of the bar graphs, you can compare the planned vs. the actual working hours to enhance decision-making in the future. The projected issues can be prioritized based on the high, medium, or low probability of their occurrence. Download Now!
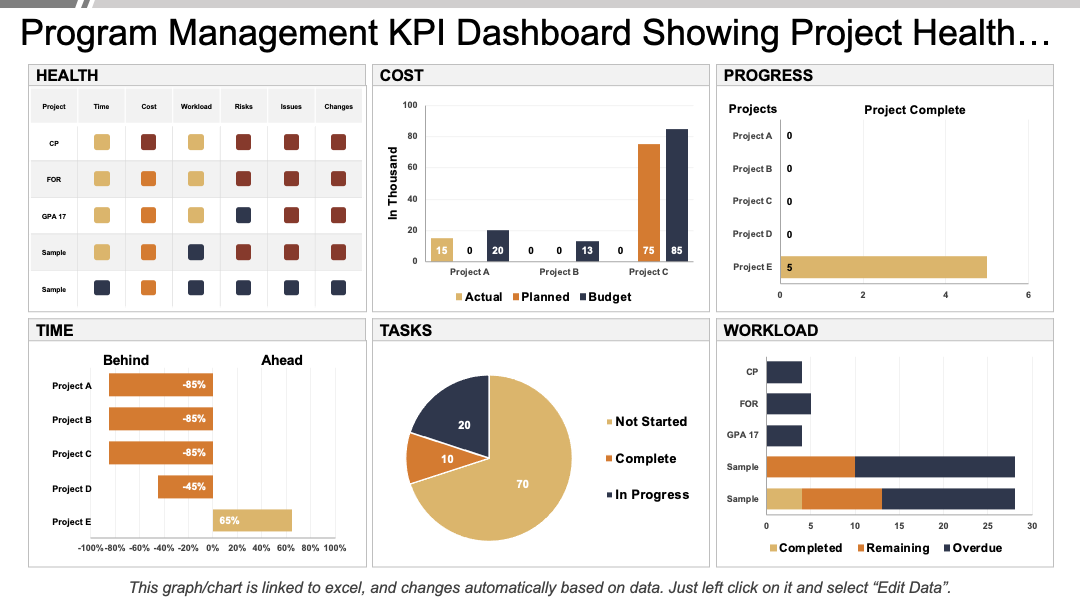
Template 2: Program Management KPI Dashboard Showing Project Health and Progress PPT Template
Use this PPT Template to keep track of all Key Performance Indicators (KPIs) for projects in progress. It has appealing infographics that will enable you to interpret the overall progress of projects at a glance. To track the health of the projects, you can record the time, cost, workload, risks, issues, and changes in the table provided. Indicate the state of each factor by using the uniquely color-coded blocks. To ensure the implementation of a project within the budgetary constraints, use the cost graph to plot the actual, planned, and total budget of the project. Track the status of tasks with the pie chart and maintain a graph of the workload. Download Now!
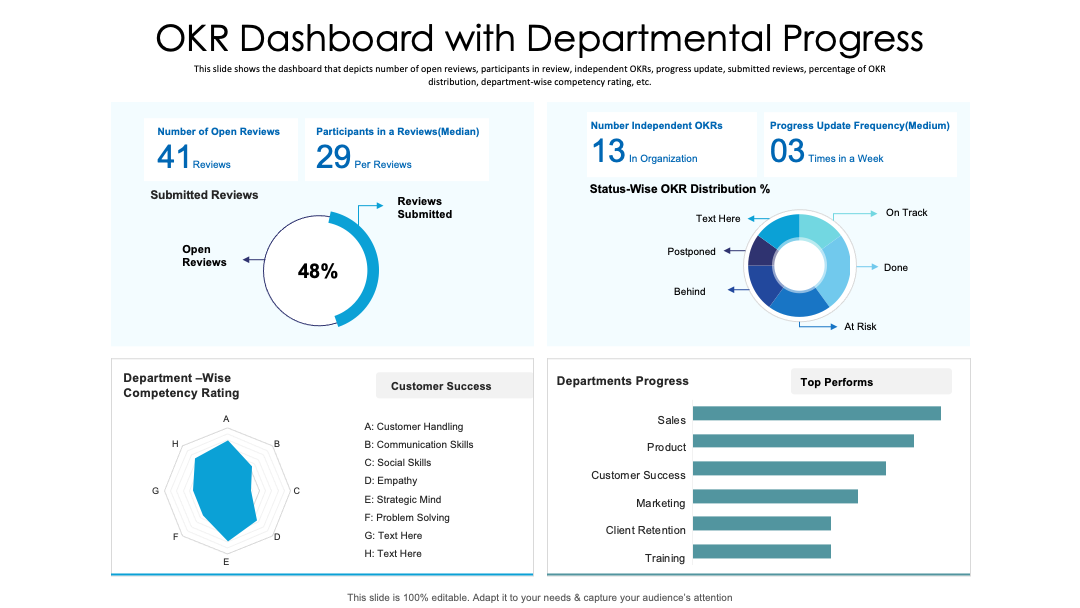
Template 3: OKR Dashboard with Departmental Progress PPT Template
Use this Dashboard Template to track the department wise progress of your ongoing projects. With this PPT Template, you can record the number of open reviews and participants in each review. Assess the performance of each department and rank them based on it. This departmental ranking will enable you to identify the shortcomings in your organization and plan your future course of action. Use this PPT Slide to record the number of independent OKRs (objectives and key results) in your organization and state the frequency of progress updates required. You can plot the departments based on their competency rating on the radial chart given in the PPT Template. Download Now!
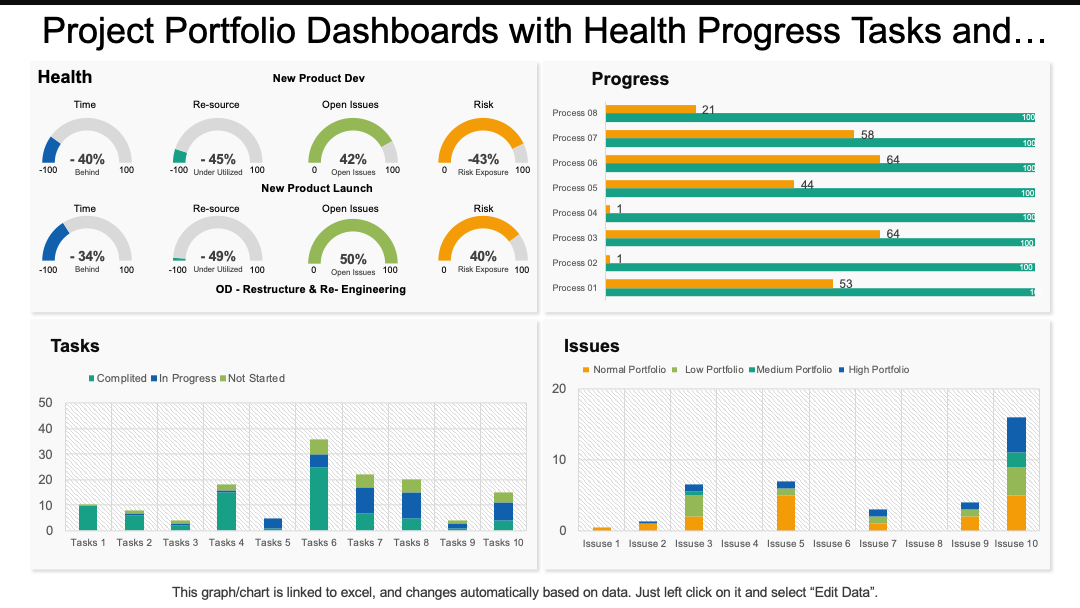
Template 4: Project Portfolio Dashboard with Health, Progress, Tasks, and Issues PPT Template
Use this Dashboard PPT Template, to track the overall health, progress, tasks, and forecast issues in an ongoing project. The odometers will enable you to record the time, resources, open issues, and risks associated with developing and launching a new product. This will help you analyze the overall health of the project. To track the progress of each process under the project, you can use the bar graphs provided. The tasks can be categorized into completed, in progress, and not started tasks. Use the PPT Layout to monitor the challenges and based on that plan the future course of action. Download now!
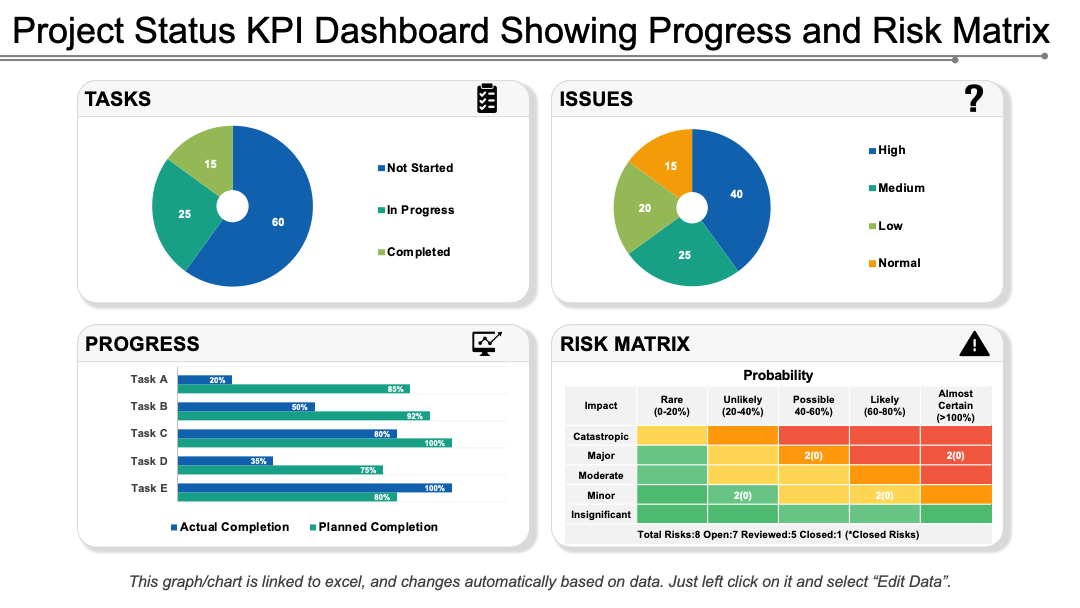
Template 5: Project Status KPI Dashboard Snapshot Showing Progress and Risk Matrix PPT Template
This PPT Template will simplify project tracking with a detailed visual representation of your project's status and potential challenges. The template has a pie chart depicting task statuses, the tasks are categorized based on, whether they're yet to commence, in progress, or completed. The second pie chart highlights the forecasted issues, categorized by priority levels as high, medium, low, and normal. The PPT Layout has a progress bar graph that illustrates the actual versus the planned task completion timeline, ensuring you stay on schedule. The unique Risk Matrix, allows you to assess the probability and associated risk levels of potential challenges. Download Now!
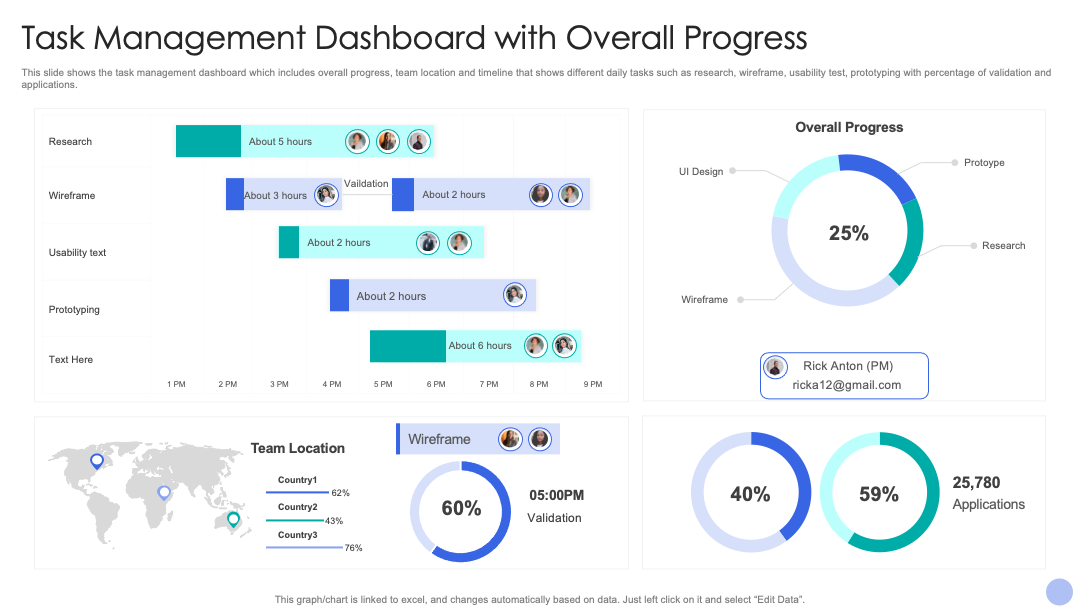
Template 6: Task Management Dashboard With Overall Progress PPT Template
This PPT Template is for Project Managers to manage the daily tasks and monitor the progress. It has a timeline to map out tasks like research, wire-framing, usability text, and prototyping. The timeline given allows you to assign hourly tasks, it has a unique feature with which you can insert a picture of the personnel responsible for each task. This will assist you in recording daily progress, and if any disruption occurs, you can inform the responsible department or person. You can use the circular progress indicators provided in the PPT Template to showcase the overall project progress, risks, etc.The PPT Layout enables you to mark the locations of your global teams on a world map and record their progress. Download Now!
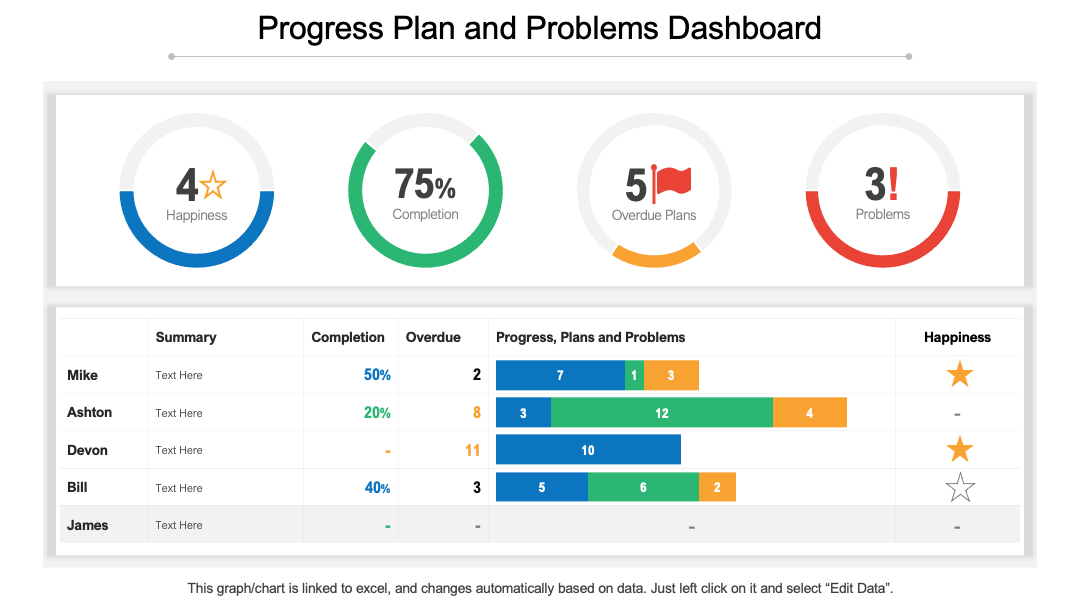
Template 7: Progress Plan and Problems Dashboard PPT Template
This PPT Template offers insights into employee satisfaction and efficiency at a glance. This circular progress indicators track the overall company status, this includes tracking employee happiness, work completion, overdue tasks, and forecasted problems in the company. The PPT Layout has a table that enables you to sort and record employee details, including names, individual work completion percentages, overdue tasks, and happiness ratings. It provides bar graphs to plot progress, plans, and problems, fostering proactive management. Within the table, you can add summary notes for each employee. Download Now!
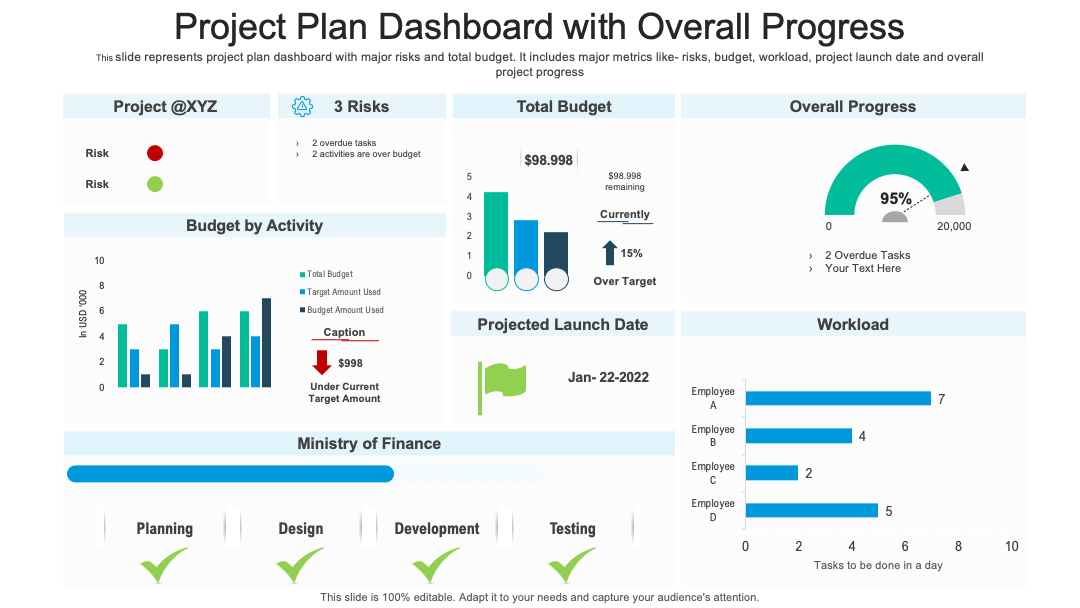
Template 8: Project Plan Dashboard with Overall Progress PPT Template
This PPT Template is a comprehensive tool to assess the overall project progress. It enables you to monitor risks, total budget, activity budgets, targetted launch date, workload, etc. The budget tracker allows you to record the total budget assigned to the project, the financial capital already invested, and whether the expenditure is over budget, under budget, or on track. You can also monitor budgets for each activity. The odometer tracks the overall progress of the project. A green flag in the center displays the project launch date to ensure the team is well-informed about the goal. With the bar graph provided, you can view the workload of each employee and redesign your work distribution plan to enhance productivity. Use ticks and crosses to showcase task completion within the project. Download Now!
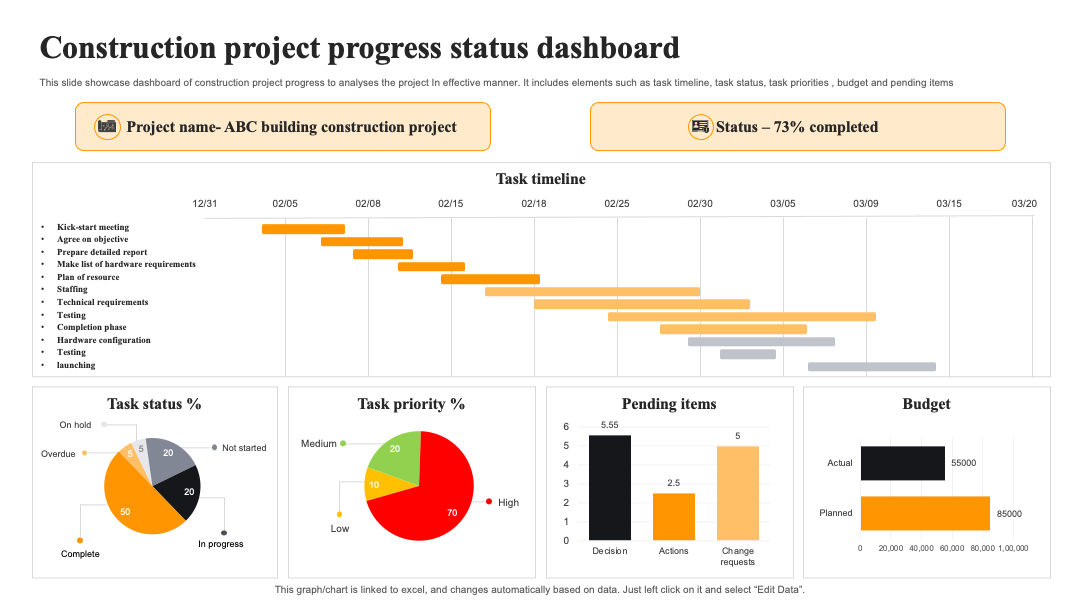
Template 9: Construction Project Progress Status Dashboard PPT Template
This PPT Template is designed to track the progress of construction projects. You can display the task completion percentage in the top right box on the dashboard. The Gantt Chart provides a detailed task timeline that includes the inception of the project from the kick-start meeting, objective agreement, detailed reporting, planning resources, staffing, and testing, to launching the project. The PPT Layout has infographics including pie charts and bar graphs to denote task status, task priority, pending items, and budget. Categorize the tasks as: not started, in progress, completed, overdue, or on hold. Color-code the pie chart, with red denoting high-priority tasks, green for medium-priority tasks, and yellow for low-priority tasks. Plot the actual vs. planned budget on a bar graph to ensure the project is on track and within the budget.
Download Now!
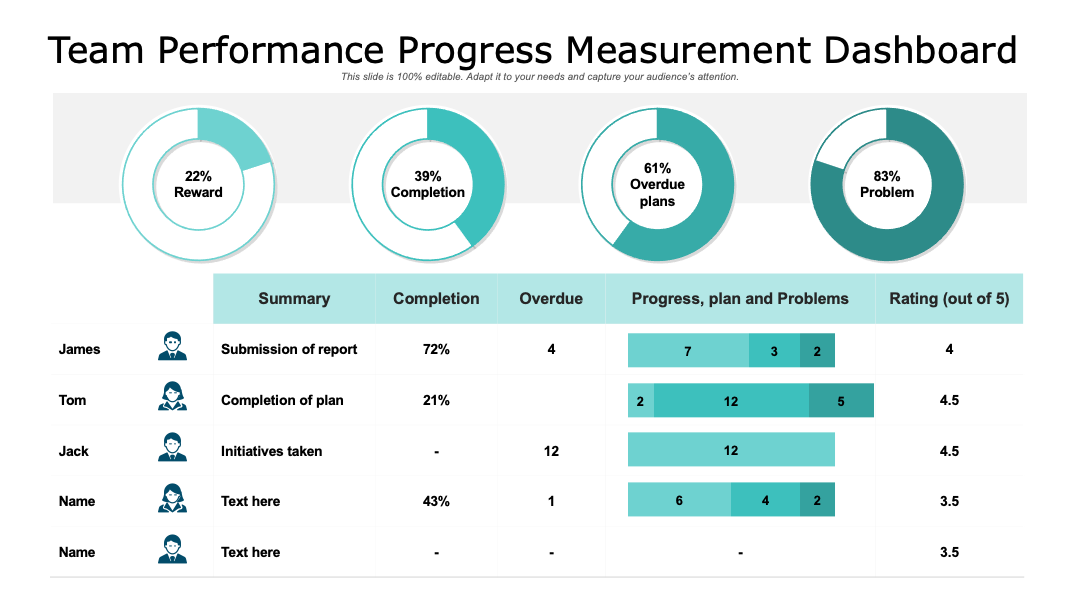
Template 10: Team Performance Progress Measurement Dashboard PPT Template
This PPT Template offers insights into team performance at a glance. This circular progress indicators track the overall team rewards, work completion status, overdue tasks, and forecasted problems in the ongoing project. The PPT Layout has a table that enables you to sort and record details of employees in the team, including names, individual work completion percentages, overdue tasks, and ratings. It provides bar graphs to plot progress, plans, and problems, fostering proactive management. Within the table, you can add summary notes for each team member in the table. Download Now!
BE UPDATED!
When you track your progress, the work you do becomes evidently significant. You also have more insight into the value you’re creating and can show the top management, the results of your daily tasks.
With a system for measuring progress in place, you’ll always know you’re moving in the right direction. Along with progress, it is vital to keep up with the quality of your work over time.
To ensure consistency and tracking of work quality, click here to check out our Top 10 Quality Dashboard Templates.