KPI Dashboard, Excel and Metrics PPT Templates
-
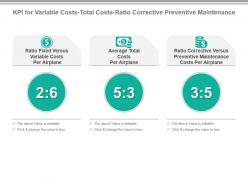 Kpi for variable costs total costs ratio corrective preventive maintenance ppt slide
Presenting kpi for variable costs total costs ratio corrective preventive maintenance ppt slide. This presentation slide shows Three Key Performance Indicators or KPIs in a Dashboard style design. The first KPI that can be shown is Ratio Fixed Versus Variable Costs Per Airplane. The second KPI is Average Total Costs Per Airplane. The third is Ratio Corrective Versus Preventive Maintenance Costs Per Airplane. These KPI Powerpoint graphics are all data driven, and the shape automatically adjusts according to your data. Just right click on the KPI graphic, enter the right value and the shape will adjust automatically. Make a visual impact with our KPI slides.
-
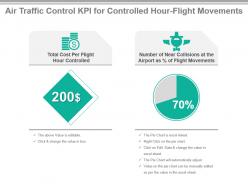 Air traffic control kpi for controlled hour flight movements powerpoint slide
Presenting air traffic control kpi for controlled hour flight movements powerpoint slide. This presentation slide shows two Key Performance Indicators or KPIs in a Dashboard style design. The first KPI that can be shown is Total Cost Per Flight Hour Controlled. The second KPI is Number of Near Collisions at the Airport as percentage of Flight Movements. These KPI Powerpoint graphics are all data driven, and the shape automatically adjusts according to your data. Just right click on the KPI graphic, enter the right value and the shape will adjust automatically. Make a visual impact with our KPI slides.
-
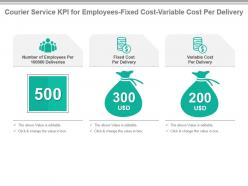 Courier service kpi for employees fixed cost variable cost per delivery presentation slide
Presenting courier service kpi for employees fixed cost variable cost per delivery presentation slide. This presentation slide shows three Key Performance Indicators or KPIs in a Dashboard style design. The first KPI that can be shown is Number of Employees Per 100000 Deliveries. The second KPI is Fixed Cost Per Delivery and the third is Variable Cost Per Delivery. These KPI Powerpoint graphics are all data driven, and the shape automatically adjusts according to your data. Just right click on the KPI graphic, enter the right value and the shape will adjust automatically. Make a visual impact with our KPI slides.
-
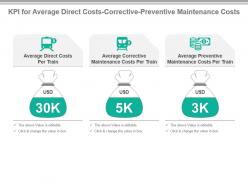 Kpi for average direct costs corrective preventive maintenance costs ppt slide
Presenting kpi for average direct costs corrective preventive maintenance costs ppt slide. This presentation slide shows three Key Performance Indicators or KPIs in a Dashboard style design. The first KPI that can be shown is Average Direct Costs Per Train. The second KPI is Average Corrective Maintenance Costs Per Train and the third is Average Preventive Maintenance Costs Per Train. These KPI Powerpoint graphics are all data driven, and the shape automatically adjusts according to your data. Just right click on the KPI graphic, enter the right value and the shape will adjust automatically. Make a visual impact with our KPI slides.
-
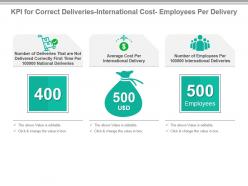 Kpi for correct deliveries international cost employees per delivery presentation slide
Presenting kpi for correct deliveries international cost employees per delivery presentation slide. This presentation slide shows three Key Performance Indicators or KPIs in a Dashboard style design. The first KPI that can be shown is Number of Deliveries That are Not Delivered Correctly First Time Per 100000 National Deliveries. The second KPI is Average Cost Per International Delivery and the third is Number of Employees Per 100000 International Deliveries. These KPI Powerpoint graphics are all data driven, and the shape automatically adjusts according to your data. Just right click on the KPI graphic, enter the right value and the shape will adjust automatically. Make a visual impact with our KPI slides.
-
 Kpi for crime rate per trip escalator system profit per train powerpoint slide
Presenting kpi for crime rate per trip escalator system profit per train powerpoint slide. This presentation slide shows three Key Performance Indicators or KPIs in a Dashboard style design. The first KPI that can be shown is Crime Rate Per Million Passenger Trips. The second KPI is Escalator System Availability and the third is Profit Per Train. These KPI Powerpoint graphics are all data driven, and the shape automatically adjusts according to your data. Just right click on the KPI graphic, enter the right value and the shape will adjust automatically. Make a visual impact with our KPI slides.
-
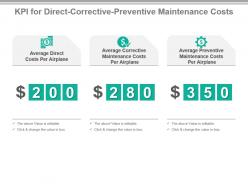 Kpi for direct corrective preventive maintenance costs presentation slide
Presenting kpi for direct corrective preventive maintenance costs presentation slide. This presentation slide shows three Key Performance Indicators or KPIs in a Dashboard style design. The first KPI that can be shown is Average Direct Costs Per Airplane. The second KPI is Average Corrective Maintenance Costs Per Airplane and the third is Average Preventive Maintenance Costs Per Airplane. These KPI Powerpoint graphics are all data driven, and the shape automatically adjusts according to your data. Just right click on the KPI graphic, enter the right value and the shape will adjust automatically. Make a visual impact with our KPI slides.
-
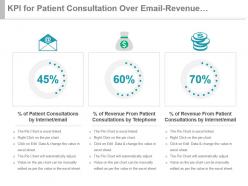 Kpi for patient consultation over email revenue from telephone internet ppt slide
Presenting kpi for patient consultation over email revenue from telephone internet ppt slide. This presentation slide shows three Key Performance Indicators or KPIs in a Dashboard style design. The first KPI that can be shown is percentage of Patient Consultations by Internet email. The second KPI is percentage of Revenue From Patient Consultations by Telephone and the third is percentage of Revenue From Patient Consultations by Internet email. These KPI Powerpoint graphics are all data driven, and the shape automatically adjusts according to your data. Just right click on the KPI graphic, enter the right value and the shape will adjust automatically. Make a visual impact with our KPI slides.
-
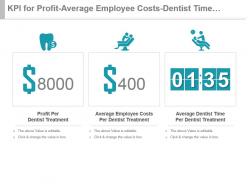 Kpi for profit average employee costs dentist time per treatment powerpoint slide
Presenting kpi for profit average employee costs dentist time per treatment powerpoint slide. This presentation slide shows three Key Performance Indicators or KPIs in a Dashboard style design. The first KPI that can be shown is Profit Per Dentist Treatment. The second KPI is Average Employee Costs Per Dentist Treatment and the third is Average Dentist Time Per Dentist Treatment. These KPI Powerpoint graphics are all data driven, and the shape automatically adjusts according to your data. Just right click on the KPI graphic, enter the right value and the shape will adjust automatically. Make a visual impact with our KPI slides.
-
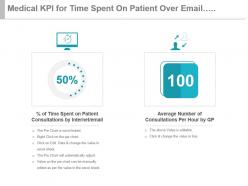 Medical kpi for time spent on patient over email consultation per hour ppt slide
Presenting medical kpi for time spent on patient over email consultation per hour ppt slide. This presentation slide shows two Key Performance Indicators or KPIs in a Dashboard style design. The first KPI that can be shown is percentage of Time Spent on Patient Consultations by Internet email. The second KPI is Average Number of Consultations Per Hour by GP. These KPI Powerpoint graphics are all data driven, and the shape automatically adjusts according to your data. Just right click on the KPI graphic, enter the right value and the shape will adjust automatically. Make a visual impact with our KPI slides.
-
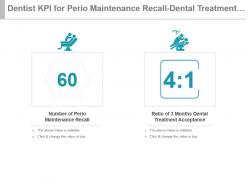 Dentist kpi for perio maintenance recall dental treatment acceptance ppt slide
Presenting dentist kpi for perio maintenance recall dental treatment acceptance ppt slide. This presentation slide shows two Key Performance Indicators or KPIs in a Dashboard style design. The first KPI that can be shown is Number of Perio Maintenance Recall. The second KPI is Ratio of 3 Months Dental Treatment Acceptance. These KPI Powerpoint graphics are all data driven, and the shape automatically adjusts according to your data. Just right click on the KPI graphic, enter the right value and the shape will adjust automatically. Make a visual impact with our KPI slides.
-
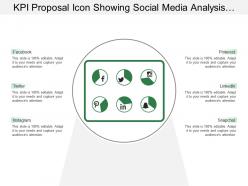 Kpi proposal icon showing social media analysis dashboard
Presenting this set of slides with name - Kpi Proposal Icon Showing Social Media Analysis Dashboard. This is a six stage process. The stages in this process are Kpi Proposal, Kpi Plan, Kpi Scheme.
-
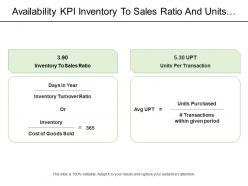 Availability kpi inventory to sales ratio and units per transaction
Presenting this set of slides with name - Availability Kpi Inventory To Sales Ratio And Units Per Transaction. This is a two stage process. The stages in this process are Availability Kpi, Availability Dashboard, Availability Metrics.
-
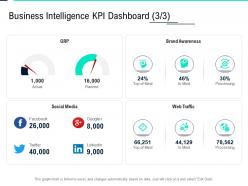 Business intelligence kpi dashboard social data integration ppt gallery maker
Present the topic in a bit more detail with this Business Intelligence Kpi Dashboard Social Data Integration Ppt Gallery Maker. Use it as a tool for discussion and navigation on Brand Awareness, Social Media, Web Traffic, Processing. This template is free to edit as deemed fit for your organization. Therefore download it now.
-
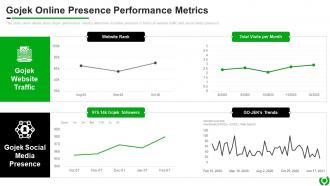 Gojek Online Presence Performance Metrics GOJEK Investor Funding Elevator Pitch Deck
This slide caters details about Gojek performance metrics determine its online presence in terms of website traffic and social media presence. Deliver an outstanding presentation on the topic using this Gojek Online Presence Performance Metrics GOJEK Investor Funding Elevator Pitch Deck. Dispense information and present a thorough explanation of Gojek Online Presence Performance Metrics using the slides given. This template can be altered and personalized to fit your needs. It is also available for immediate download. So grab it now.
-
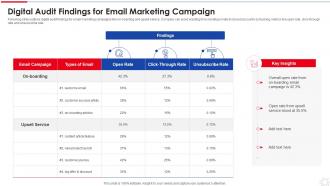 Digital Audit Findings For Email Marketing Campaign
Following slide outlines digital audit findings for email marketing campaigns like on boarding and upsell service. Company can avoid wasting time sending emails to closed accounts by tracking metrics like open rate, click-through rate and unsubscribe rate. Presenting our well structured Digital Audit Findings For Email Marketing Campaign. The topics discussed in this slide are Email Campaign, Upsell Service, On Boarding, Open Rate. This is an instantly available PowerPoint presentation that can be edited conveniently. Download it right away and captivate your audience.
-
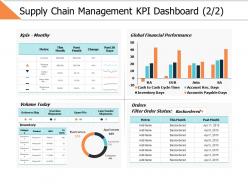 Supply chain management kpi dashboard 2 2 ppt powerpoint presentation gallery visuals
Presenting this set of slides with name - Supply Chain Management Kpi Dashboard 2 2 Ppt Powerpoint Presentation Gallery Visuals. This is a two stage process. The stages in this process are Business, Management, Strategy, Analysis, Finance.
-
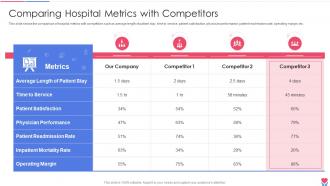 Comparing Hospital Metrics With Competitors Healthcare Inventory Management System
This slide shows the comparison of hospital metrics with competitors such as average length of patient stay, time to service, patient satisfaction, physician performance, patient readmission rate, operating margin, etc.Deliver an outstanding presentation on the topic using this Comparing Hospital Metrics With Competitors Healthcare Inventory Management System Dispense information and present a thorough explanation of Patient Satisfaction, Physician Performance, Patient Readmission using the slides given. This template can be altered and personalized to fit your needs. It is also available for immediate download. So grab it now.
-
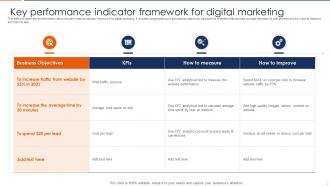 Key Performance Indicator Framework For Digital Marketing
This slide provides relevant information about key performance indicator framework for digital marketing. It includes components such as business objectives, kips such as website traffic sources, average time spent and cost per lead and the ways to measure and improve kips. Introducing our Key Performance Indicator Framework For Digital Marketing set of slides. The topics discussed in these slides are Business Objectives, Traffic Sources, Average Time. This is an immediately available PowerPoint presentation that can be conveniently customized. Download it and convince your audience.
-
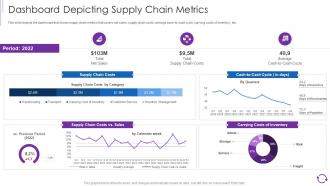 Reducing Cost Of Operations Through Iot And Dashboard Depicting Supply Chain Metrics
This slide depicts the dashboard that shows supply chain metrics that covers net sales, supply chain costs, average cash-to-cash cycle, carrying costs of inventory, etc. Deliver an outstanding presentation on the topic using this Reducing Cost Of Operations Through Iot And Dashboard Depicting Supply Chain Metrics. Dispense information and present a thorough explanation of Dashboard Depicting Supply Chain Metrics using the slides given. This template can be altered and personalized to fit your needs. It is also available for immediate download. So grab it now.
-
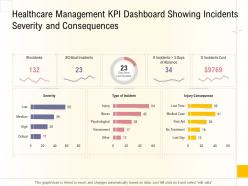 Healthcare management kpi dashboard showing incidents severity and consequences ppt grid
Present the topic in a bit more detail with this Healthcare Management KPI Dashboard Showing Incidents Severity And Consequences Ppt Grid. Use it as a tool for discussion and navigation on Healthcare Management KPI Dashboard Showing Incidents Severity And Consequences. This template is free to edit as deemed fit for your organization. Therefore download it now.
-
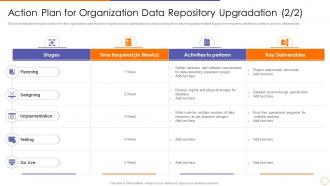 Scale out strategy for data inventory system action plan for organization data repository upgradation
This slide indicates the plan of action for the organization data repository expansion and optimization project providing information regarding multiple stages, time required, activities to perform, and key deliverables. Present the topic in a bit more detail with this Scale Out Strategy For Data Inventory System Action Plan For Organization Data Repository Upgradation. Use it as a tool for discussion and navigation on Planning, Organization, Requirements. This template is free to edit as deemed fit for your organization. Therefore download it now.
-
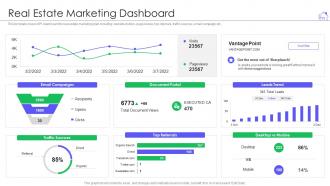 Real estate marketing dashboard ppt powerpoint presentation outline inspiration
This template covers KPI dashboard for real estate marketing plan including website visitors, page review, top referrals, traffic sources, email campaign etc. Deliver an outstanding presentation on the topic using this Real Estate Marketing Dashboard Ppt Powerpoint Presentation Outline Inspiration. Dispense information and present a thorough explanation of Real Estate Marketing Dashboard using the slides given. This template can be altered and personalized to fit your needs. It is also available for immediate download. So grab it now.
-
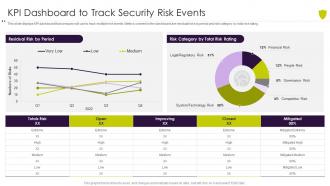 Kpi dashboard to track security risk events managing cyber risk in a digital age
This slide displays KPI dashboard that company will use to track multiple risk events. Metrics covered in the dashboard are residual risks by period and risk category by total risk rating. Deliver an outstanding presentation on the topic using this Kpi Dashboard To Track Security Risk Events Managing Cyber Risk In A Digital Age. Dispense information and present a thorough explanation of KPI Dashboard To Track Security Risk Events using the slides given. This template can be altered and personalized to fit your needs. It is also available for immediate download. So grab it now.
-
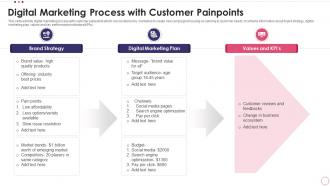 Digital Marketing Process With Customer Painpoints
This slide exhibits digital marketing process with customer painpoints which can be referred by marketers to create new campaigns focusing on catering to customer needs. It contains information about brand strategy, digital marketing plan, values and key performance indicators KPIs. Presenting our set of slides with Digital Marketing Process With Customer Painpoints. This exhibits information on three stages of the process. This is an easy to edit and innovatively designed PowerPoint template. So download immediately and highlight information on Brand Strategy, Digital Marketing Plan, Target, Prices.
-
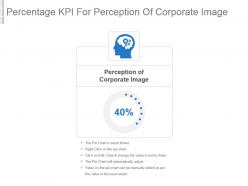 Percentage kpi for perception of corporate image powerpoint slide
Presenting percentage kpi for perception of corporate image powerpoint slide. This presentation slide shows one Key Performance Indicators or KPIs in a Dashboard style design. The first KPI that can be shown is Perception of Corporate Image. These KPI Powerpoint graphics are all data driven, and the shape automatically adjusts according to your data. Just right click on the KPI graphic, enter the right value and the shape will adjust automatically. Make a visual impact with our KPI slides.
-
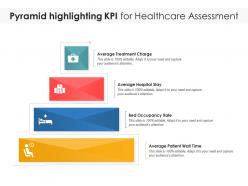 Pyramid highlighting kpi for healthcare assessment
Presenting our set of slides with name Pyramid Highlighting KPI For Healthcare Assessment. This exhibits information on four stages of the process. This is an easy-to-edit and innovatively designed PowerPoint template. So download immediately and highlight information on Average Treatment Charge, Average Hospital Stay, Bed Occupancy Rate, Average Patient Wait Time.
-
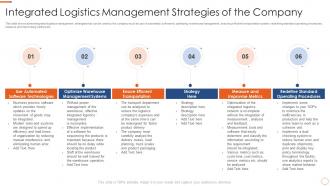 Integrated logistics management strategies application of warehouse management systems
This slide shows some integrated logistics management strategies that can be used by the company such as use of automated softwares, optimizing warehouse management, ensuring efficient transportation system, redefining standard operating procedures, measure and improvising metrics etc. Introducing Integrated Logistics Management Strategies Application Of Warehouse Management Systems to increase your presentation threshold. Encompassed with six stages, this template is a great option to educate and entice your audience. Dispence information on Logistics, Management, Strategies, using this template. Grab it now to reap its full benefits.
-
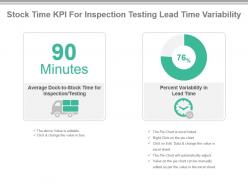 Stock time kpi for inspection testing lead time variability powerpoint slide
Presenting stock time kpi for inspection testing lead time variability powerpoint slide. This presentation slide shows Two Key Performance Indicators or KPIs in a Dashboard style design. The first KPI that can be shown is Average Dock to Stock Time for Inspection Testing. The second KPI is Percent Variability in Lead Time. These KPI Powerpoint graphics are all data driven, and the shape automatically adjusts according to your data. Just right click on the KPI graphic, enter the right value and the shape will adjust automatically. Make a visual impact with our KPI slides.
-
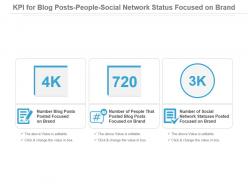 Kpi For Blog Posts People Social Network Status Focused On Brand Powerpoint Slide
Presenting kpi for blog posts people social network status focused on brand powerpoint slide. This presentation slide shows three Key Performance Indicators or KPIs in a Dashboard style design. The first KPI that can be shown is Number Blog Posts Posted Focused on Brand. The second KPI is Number of People That Posted Blog Posts Focused on Brand and the third is Number of Social Network Statuses Posted Focused on Brand. These KPI Powerpoint graphics are all data driven, and the shape automatically adjusts according to your data. Just right click on the KPI graphic, enter the right value and the shape will adjust automatically. Make a visual impact with our KPI slides.
-
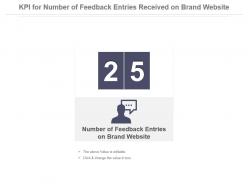 Kpi for number of feedback entries received on brand website presentation slide
Presenting kpi for number of feedback entries received on brand website presentation slide. This presentation slide shows one Key Performance Indicators or KPIs in a Dashboard style design. The first KPI that can be shown is Number of Feedback Entries on Brand Website. These KPI Powerpoint graphics are all data driven, and the shape automatically adjusts according to your data. Just right click on the KPI graphic, enter the right value and the shape will adjust automatically. Make a visual impact with our KPI slides.
-
 Kpi for number of news feed clicks send button impressions powerpoint slide
Presenting kpi for number of news feed clicks send button impressions powerpoint slide. This presentation slide shows two Key Performance Indicators or KPIs in a Dashboard style design. The first KPI that can be shown is Number of Clicks Sent to Your Site From Stories in News Feed or Page. The second KPI is Number of Impressions on The Send Button on Your Domain. These KPI Powerpoint graphics are all data driven, and the shape automatically adjusts according to your data. Just right click on the KPI graphic, enter the right value and the shape will adjust automatically. Make a visual impact with our KPI slides.
-
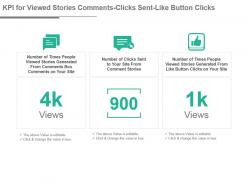 Kpi for viewed stories comments clicks sent like button clicks ppt slide
Presenting kpi for viewed stories comments clicks sent like button clicks ppt slide. This presentation slide shows three Key Performance Indicators or KPIs in a Dashboard style design. The first KPI that can be shown is Number of Times People Viewed Stories Generated From Comments Box Comments on Your Site. The second KPI is Number of Clicks Sent to Your Site From Comment Stories and the third is Number of Times People Viewed Stories Generated From Like Button Clicks on Your Site. These KPI Powerpoint graphics are all data driven, and the shape automatically adjusts according to your data. Just right click on the KPI graphic, enter the right value and the shape will adjust automatically. Make a visual impact with our KPI slides.
-
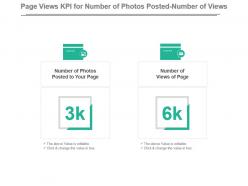 Page views kpi for number of photos posted number of views presentation slide
Presenting page views kpi for number of photos posted number of views presentation slide. This presentation slide shows two Key Performance Indicators or KPIs in a Dashboard style design. The first KPI that can be shown is Number of Photos Posted to Your Page. The second KPI is Number of Views of Page. These KPI Powerpoint graphics are all data driven, and the shape automatically adjusts according to your data. Just right click on the KPI graphic, enter the right value and the shape will adjust automatically. Make a visual impact with our KPI slides.
-
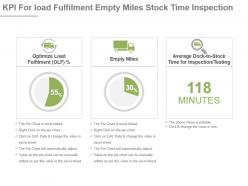 Kpi for load fulfilment empty miles stock time inspection ppt slide
Presenting kpi for load fulfilment empty miles stock time inspection ppt slide. This presentation slide shows Three Key Performance Indicators or KPIs in a Dashboard style design. The first KPI that can be shown is Optimize Load Fulfilment or OLF Percentage. The second KPI is Empty Miles. The third is Average Dock to Stock Time for Inspection Testing. These KPI Powerpoint graphics are all data driven, and the shape automatically adjusts according to your data. Just right click on the KPI graphic, enter the right value and the shape will adjust automatically. Make a visual impact with our KPI slides.
-
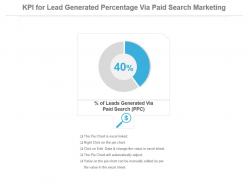 Kpi for lead generated percentage via paid search marketing powerpoint slide
Presenting kpi for lead generated percentage via paid search marketing powerpoint slide. This presentation slide shows one Key Performance Indicators or KPIs in a Dashboard style design. The first KPI that can be shown is Percentage of Leads Generated Via Paid Search PPC. These KPI Powerpoint graphics are all data driven, and the shape automatically adjusts according to your data. Just right click on the KPI graphic, enter the right value and the shape will adjust automatically. Make a visual impact with our KPI slides.
-
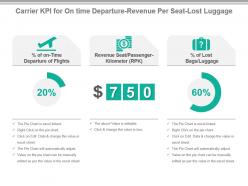 Carrier kpi for on time departure revenue per seat lost luggage ppt slide
Presenting carrier kpi for on time departure revenue per seat lost luggage ppt slide. This presentation slide shows three Key Performance Indicators or KPIs in a Dashboard style design. The first KPI that can be shown is percentage of on Time Departure of Flights. The second KPI is Revenue Seat Passenger Kilometer RPK and the third is percentage of Lost Bags Luggage. These KPI Powerpoint graphics are all data driven, and the shape automatically adjusts according to your data. Just right click on the KPI graphic, enter the right value and the shape will adjust automatically. Make a visual impact with our KPI slides.
-
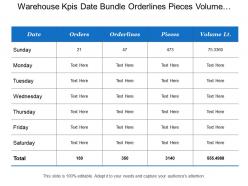 Warehouse kpis date bundle orderlines pieces volume customer
Presenting this set of slides with name - Warehouse Kpis Date Bundle Orderlines Pieces Volume Customer. This is a four stage process. The stages in this process are Warehouse Kpi, Warehouse Dashboard, Warehouse Metrics.
-
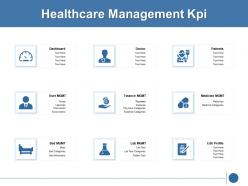 Healthcare management kpi marketing ppt powerpoint presentation icon aids
Presenting this set of slides with name Healthcare Management Kpi Marketing Ppt Powerpoint Presentation Icon Aids. This is a nine stage process. The stages in this process are Healthcare, Management, Planning, Business, Strategy. This is a completely editable PowerPoint presentation and is available for immediate download. Download now and impress your audience.
-
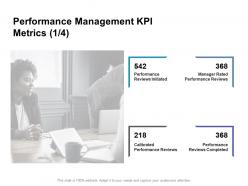 Performance management kpi metrics reviews ppt powerpoint presentation slide
Presenting this set of slides with name Performance Management KPI Metrics Reviews Ppt Powerpoint Presentation Slide. This is a one stage process. The stages in this process are Business, Management, Planning, Strategy, Marketing. This is a completely editable PowerPoint presentation and is available for immediate download. Download now and impress your audience.
-
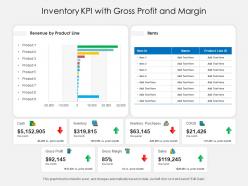 Inventory kpi with gross profit and margin
Presenting this set of slides with name Inventory KPI With Gross Profit And Margin. The topics discussed in these slides are Inventory, Sales, Revenue. This is a completely editable PowerPoint presentation and is available for immediate download. Download now and impress your audience.
-
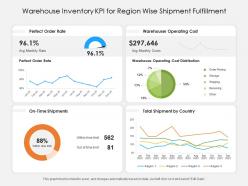 Warehouse inventory kpi for region wise shipment fulfillment
Presenting this set of slides with name Warehouse Inventory KPI For Region Wise Shipment Fulfillment. The topics discussed in these slides are Cost, Distribution, Region. This is a completely editable PowerPoint presentation and is available for immediate download. Download now and impress your audience.
-
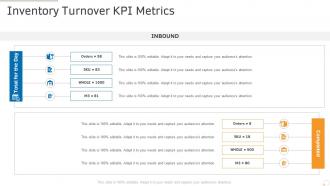 Inventory turnover kpi metrics production management ppt powerpoint presentation portfolio
Deliver an outstanding presentation on the topic using this Inventory Turnover KPI Metrics Production Management Ppt Powerpoint Presentation Portfolio. Dispense information and present a thorough explanation of Inventory Turnover Kpi Metrics using the slides given. This template can be altered and personalized to fit your needs. It is also available for immediate download. So grab it now.
-
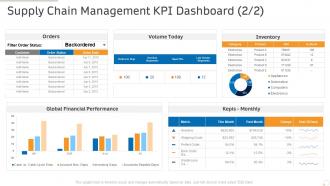 Supply chain management kpi dashboard production management ppt outline pictures
Present the topic in a bit more detail with this Supply Chain Management KPI Dashboard Production Management Ppt Outline Pictures. Use it as a tool for discussion and navigation on Global, Financial, Performance, Inventory. This template is free to edit as deemed fit for your organization. Therefore download it now.
-
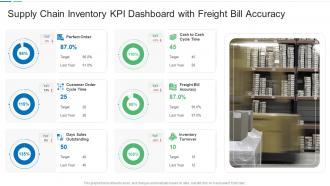 Supply chain inventory kpi dashboard with freight bill accuracy
Presenting our well-structured Supply Chain Inventory KPI Dashboard With Freight Bill Accuracy. The topics discussed in this slide are Supply Chain Inventory KPI Dashboard With Freight Bill Accuracy. This is an instantly available PowerPoint presentation that can be edited conveniently. Download it right away and captivate your audience.
-
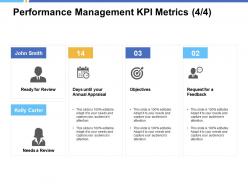 Performance management kpi metrics objectives a238 ppt powerpoint presentation professional
Presenting this set of slides with name Performance Management KPI Metrics Objectives A238 Ppt Powerpoint Presentation Professional. The topics discussed in these slides are Business, Planning, Strategy, Marketing, Management. This is a completely editable PowerPoint presentation and is available for immediate download. Download now and impress your audience.
-
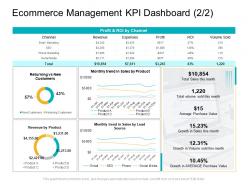 Ecommerce management kpi dashboard seo e business infrastructure
Present the topic in a bit more detail with this Ecommerce Management KPI Dashboard SEO E Business Infrastructure. Use it as a tool for discussion and navigation on Ecommerce Management Kpi Dashboard. This template is free to edit as deemed fit for your organization. Therefore download it now.
-
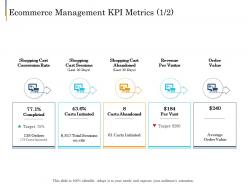 Ecommerce management kpi metrics e business plan ppt portrait
Introducing Ecommerce Management KPI Metrics E Business Plan Ppt Portrait to increase your presentation threshold. Encompassed with five stages, this template is a great option to educate and entice your audience. Dispence information on Shopping Cart Conversion Rate, Shopping Cart Sessions, Shopping Cart Abandoned, using this template. Grab it now to reap its full benefits.
-
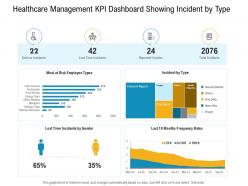 E healthcare management healthcare management kpi dashboard showing incident by type
Present the topic in a bit more detail with this E Healthcare Management Healthcare Management KPI Dashboard Showing Incident By Type. Use it as a tool for discussion and navigation on Serious Incidents, Lost Time Incidents, Reported Injuries, Total Incidents. This template is free to edit as deemed fit for your organization. Therefore download it now.
-
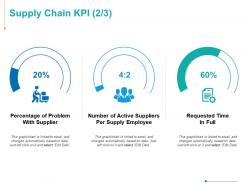 Supply chain kpi investment ppt powerpoint presentation infographics gridlines
Presenting this set of slides with name - Supply Chain KPI Investment Ppt Powerpoint Presentation Infographics Gridlines. This is a three stage process. The stages in this process are Finance, Analysis, Business, Investment, Marketing.
-
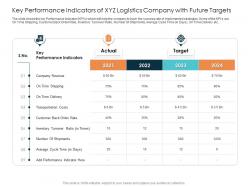 Key performance indicators of xyz logistics rise in prices of fuel costs in logistics
The slide shows the key Performance Indicator KPIs which will help the company to track the success rate of implemented strategies. Some of the KPIs are On Time Shipping, Customer Back Order Rate, Inventory Turnover Ratio, Number Of Shipments, Average Cycle Time in Days, On Time Delivery etc.Deliver an outstanding presentation on the topic using this Key Performance Indicators Of XYZ Logistics Rise In Prices Of Fuel Costs In Logistics. Dispense information and present a thorough explanation of Transportation Costs, Customer Back Order, Inventory Turnover using the slides given. This template can be altered and personalized to fit your needs. It is also available for immediate download. So grab it now.
-
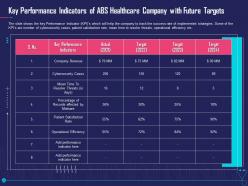 Key performance indicators overcome challenge cyber security healthcare ppt outline slides
The slide shows the key Performance Indicator KPIs which will help the company to track the success rate of implemented strategies. Some of the KPIs are number of cybersecurity cases, patient satisfaction rate, mean time to resolve threats, operational efficiency etc. Deliver an outstanding presentation on the topic using this Key Performance Indicators Overcome Challenge Cyber Security Healthcare Ppt Outline Slides. Dispense information and present a thorough explanation of Performance, Target using the slides given. This template can be altered and personalized to fit your needs. It is also available for immediate download. So grab it now.
-
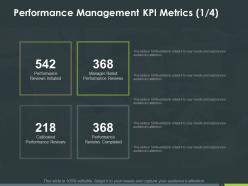 Performance management kpi metrics ppt powerpoint presentation inspiration graphics
Presenting this set of slides with name - Performance Management Kpi Metrics Ppt Powerpoint Presentation Inspiration Graphics. This is a four stages process. The stages in this process are Performance Reviews Initiated, Business, Management, Marketing, Process.
-
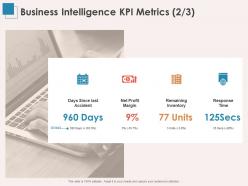 Business intelligence kpi metrics margin ppt powerpoint presentation templates
Presenting this set of slides with name Business Intelligence KPI Metrics Margin Ppt Powerpoint Presentation Templates. This is a four stage process. The stages in this process are Days Since Last Accident, Net Profit Margin, Remaining Inventory, Response Time. This is a completely editable PowerPoint presentation and is available for immediate download. Download now and impress your audience.
-
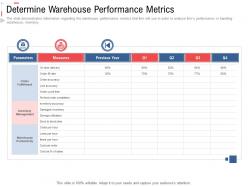 Determine warehouse performance metrics stock inventory management ppt rules
The slide demonstrates information regarding the warehouse performance metrics that firm will use in order to analyze firms performance in handling warehouse, inventory. Deliver an outstanding presentation on the topic using this Determine Warehouse Performance Metrics Stock Inventory Management Ppt Rules. Dispense information and present a thorough explanation of Order Fulfillment, Inventory Management, Warehouse Productivity using the slides given. This template can be altered and personalized to fit your needs. It is also available for immediate download. So grab it now.
-
 Supply chain management kpi dashboard slide for candidate interview experience powerpoint template
This is a Supply Chain Management Kpi Dashboard Slide For Candidate Interview Experience Powerpoint Template that you can use to present real-time information about your business. With a variety of graphical representations that are in-line with the current trends, this is a great way to display quantified data and stats. This is also a great PowerPoint slide to make informed decisions based on the data and results depicted. Since this template can accommodate a lot of statistical information in one-go it can be put to use by different department heads of the organization. This PPT slide can also be used to present a thorough discussion on various KPIs, all excel-linked and susceptible to innumerable changes. Thus helping in the portrayal of calculative data in a highly professional format. Not only this, but it can also be reproduced in JPG, PNG, and PDF formats. Therefore, reinvent the wheel by downloading this PPT slide now.
-
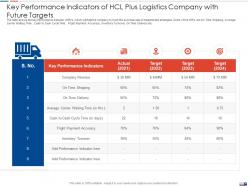 Key performance indicators strategies create good proposition logistic company ppt grid
The slide shows the key Performance Indicator KPIs which will help the company to track the success rate of implemented strategies. Some of the KPIs are On Time Shipping, Average Carrier Waiting Time , Cash to Cash Cycle Time , Fright Payment Accuracy , Inventory Turnover, On Time Delivery etc. Present the topic in a bit more detail with this Key Performance Indicators Strategies Create Good Proposition Logistic Company Ppt Grid. Use it as a tool for discussion and navigation on Key Performance Indicators, Target, Average, Inventory Turnover . This template is free to edit as deemed fit for your organization. Therefore download it now.
-
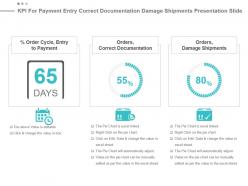 Kpi for payment entry correct documentation damage shipments presentation slide
Presenting kpi for payment entry correct documentation damage shipments presentation slide. This presentation slide shows three Key Performance Indicators or KPIs. The first KPI that can be show is percentage Order Cycle, Entry to Payment. The second KPI is Orders, Correct Documentation and the third is Orders, Damage Shipments. These KPI Powerpoint graphics are all data driven, and the shape automatically adjusts according to your data. Just right click on the KPI graphic, enter the right value and the shape will adjust automatically. Make a visual impact with our KPI slides.
-
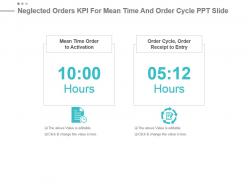 Neglected orders kpi for mean time and order cycle ppt slide
Presenting neglected orders kpi for mean time and order cycle ppt slide. This presentation slide shows two Key Performance Indicators or KPIs. The first KPI that can be show is Mean Time Order to Activation. The second KPI is Order Cycle, Order Receipt to Entry. These KPI Powerpoint graphics are all data driven, and the shape automatically adjusts according to your data. Just right click on the KPI graphic, enter the right value and the shape will adjust automatically. Make a visual impact with our KPI slides.
-
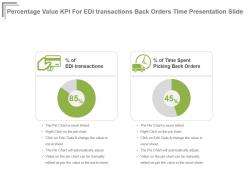 Percentage value kpi for edi transactions back orders time presentation slide
Presenting percentage value kpi for edi transactions back orders time presentation slide. This presentation slide shows two Key Performance Indicators or KPIs in a Dashboard style design. The first KPI that can be shown is percentage of EDI transactions. The second KPI is percentage of Time Spent Picking Back Orders. These KPI Powerpoint graphics are all data driven, and the shape automatically adjusts according to your data. Just right click on the KPI graphic, enter the right value and the shape will adjust automatically. Make a visual impact with our KPI slides.


