KPI Dashboard, Excel and Metrics PPT Templates
-
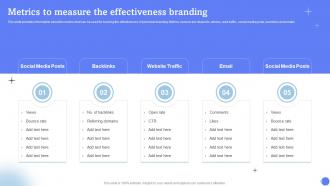 Metrics To Measure The Effectiveness Branding
This slide provides information about the metrics that can be used for tracking the effectiveness of personal branding. Metrics covered are related to articles, web traffic, social media posts, backlinks and emails. Introducing Metrics To Measure The Effectiveness Branding to increase your presentation threshold. Encompassed with five stages, this template is a great option to educate and entice your audience. Dispence information on Social Media Posts, Backlinks, Website Traffic, using this template. Grab it now to reap its full benefits.
-
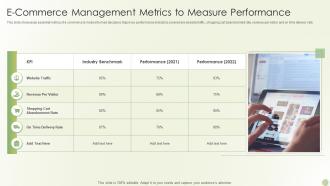 E Commerce Management Metrics To Measure Performance
This slide showcases essential metrics of e-commerce to make informed decisions. Major key performance indicators covered are website traffic, shopping cart abandonment rate, revenue per visitor and on time delivery rate. Presenting our well structured E Commerce Management Metrics To Measure Performance. The topics discussed in this slide are Measure, Performance, Management. This is an instantly available PowerPoint presentation that can be edited conveniently. Download it right away and captivate your audience.
-
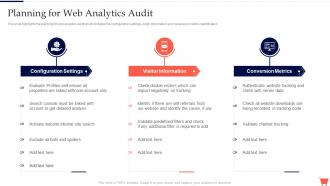 Planning For Web Analytics Audit Complete Guide To Conduct Digital Marketing Audit
This slide highlights the planning for web analytics audit which includes the configuration settings, visitor information and conversion metrics identification. Introducing Planning For Web Analytics Audit Complete Guide To Conduct Digital Marketing Audit to increase your presentation threshold. Encompassed with three stages, this template is a great option to educate and entice your audience. Dispence information on Configuration Settings, Visitor Information, Conversion Metrics, using this template. Grab it now to reap its full benefits.
-
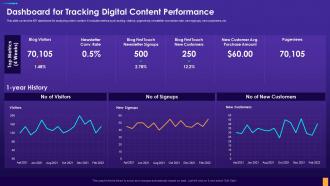 Dashboard For Tracking Digital Content Performance Digital Consumer Touchpoint Strategy
This slide covers the KPI dashboard for analyzing online content. It includes metrics such as blog visitors, pageviews, newsletter conversion rate, new signups, new customers, etc. Deliver an outstanding presentation on the topic using this Dashboard For Tracking Digital Content Performance Digital Consumer Touchpoint Strategy. Dispense information and present a thorough explanation of Dashboard For Tracking, Digital Content Performance using the slides given. This template can be altered and personalized to fit your needs. It is also available for immediate download. So grab it now.
-
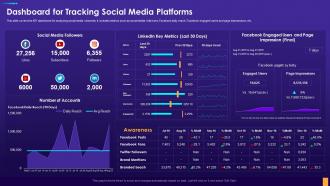 Dashboard For Tracking Social Media Platforms Digital Consumer Touchpoint Strategy
This slide covers the KPI dashboard for analyzing social media channels. It includes metrics such as social media followers, Facebook daily reach, Facebook engaged users and page impressions, etc. Present the topic in a bit more detail with this Dashboard For Tracking Social Media Platforms Digital Consumer Touchpoint Strategy. Use it as a tool for discussion and navigation on Dashboard For Tracking, Social Media Platforms. This template is free to edit as deemed fit for your organization. Therefore download it now
-
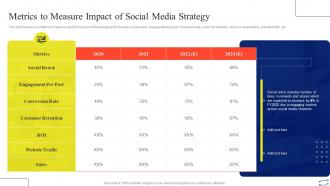 Metrics To Measure Impact Of Social Media Strategy Digital Marketing Strategies To Improve Sales
This slide focuses on metrics to measure impact of social media strategy which includes social reach, engagement per post, conversion rate, customer retention, return on investments, website traffic, etc. Present the topic in a bit more detail with this Metrics To Measure Impact Of Social Media Strategy Digital Marketing Strategies To Improve Sales. Use it as a tool for discussion and navigation on Engagement Per Post, Social Reach, Customer Retention, Website Traffic. This template is free to edit as deemed fit for your organization. Therefore download it now.
-
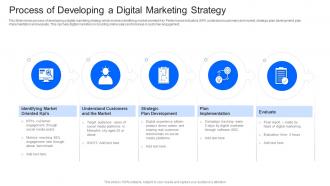 Process Of Developing A Digital Marketing Strategy
This Slide shows process of developing a digital marketing strategy which involves identifying market oriented Key Performance Indicators KPI, understand customers and market, strategic plan development, plan implementation and evaluate. This can help digital marketers in boosting online sales and increase in customer engagement. Introducing our premium set of slides with Process Of Developing A Digital Marketing Strategy. Elucidate the five stages and present information using this PPT slide. This is a completely adaptable PowerPoint template design that can be used to interpret topics like Strategic Plan Development, Plan Implementation, Evaluate. So download instantly and tailor it with your information.
-
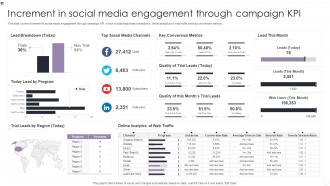 Increment In Social Media Engagement Through Campaign KPI
This slide covers increment in social media engagement through campaign KPI which include lead break breakdown, online analytics of web traffic and key conversion metrics. Presenting our well structured Increment In Social Media Engagement Through Campaign KPI. The topics discussed in this slide are Key Conversion Metrics, Lead Breakdown, Online Analytics. This is an instantly available PowerPoint presentation that can be edited conveniently. Download it right away and captivate your audience.
-
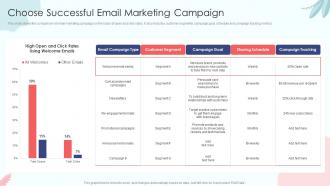 Choose Successful Email Marketing Campaign Sales Process Automation To Improve Sales
This slide shows the comparison of email marketing campaign on the basis of open and click rates. It also includes customer segments, campaign goal, schedule and campaign tracking metrics. Present the topic in a bit more detail with this Choose Successful Email Marketing Campaign Sales Process Automation To Improve Sales. Use it as a tool for discussion and navigation on Successful, Marketing, Campaign. This template is free to edit as deemed fit for your organization. Therefore download it now.
-
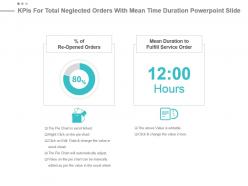 Kpis for total neglected orders with mean time duration powerpoint slide
Presenting kpis for total neglected orders with mean time duration powerpoint slide. This presentation slide shows two Key Performance Indicators or KPIs. The first KPI that can be show is percentage of Re Opened Orders . The second KPI is Mean Duration to Fulfill Service Order. These KPI Powerpoint graphics are all data driven, and the shape automatically adjusts according to your data. Just right click on the KPI graphic, enter the right value and the shape will adjust automatically. Make a visual impact with our KPI slides.
-
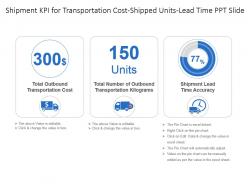 Shipment kpi for transportation cost shipped units lead time ppt slide
Presenting shipment kpi for transportation cost shipped units lead time ppt slide. This presentation slide shows three Key Performance Indicators or KPIs in a Dashboard style design. The first KPI that can be shown is Total Outbound Transportation Cost. The second KPI is Total Number of Outbound Transportation Kilograms and the third is Shipment Lead Time Accuracy. These KPI Powerpoint graphics are all data driven, and the shape automatically adjusts according to your data. Just right click on the KPI graphic, enter the right value and the shape will adjust automatically. Make a visual impact with our KPI slides.
-
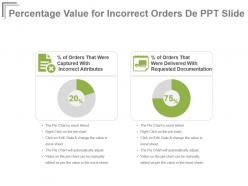 Percentage value for incorrect orders de ppt slide
Presenting percentage value for incorrect orders de ppt slide. This presentation slide shows two Key Performance Indicators or KPIs in a Dashboard style design. The first KPI that can be shown is percentage of Orders That Were Captured With Incorrect Attributes. The second KPI is percentage of Orders That Were Delivered With Requested Documentation. These KPI Powerpoint graphics are all data driven, and the shape automatically adjusts according to your data. Just right click on the KPI graphic, enter the right value and the shape will adjust automatically. Make a visual impact with our KPI slides.
-
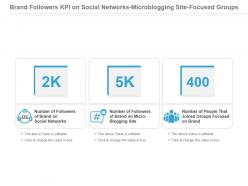 Brand Followers Kpi On Social Networks Microblogging Site Focused Groups Ppt Slide
Presenting brand followers kpi on social networks microblogging site focused groups ppt slide. This presentation slide shows three Key Performance Indicators or KPIs in a Dashboard style design. The first KPI that can be shown is Number of Followers of Brand on Social Networks. The second KPI is Number of Followers of Brand on Micro Blogging Site and the third is Number of People That Joined Groups Focused on Brand. These KPI Powerpoint graphics are all data driven, and the shape automatically adjusts according to your data. Just right click on the KPI graphic, enter the right value and the shape will adjust automatically. Make a visual impact with our KPI slides.
-
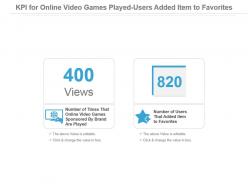 Kpi for online video games played users added item to favorites powerpoint slide
Presenting kpi for online video games played users added item to favorites powerpoint slide. This presentation slide shows two Key Performance Indicators or KPIs in a Dashboard style design. The first KPI that can be shown is Number of Times That Online Video Games Sponsored By Brand Are Played. The second KPI is Number of Users That Added Item to Favorites. These KPI Powerpoint graphics are all data driven, and the shape automatically adjusts according to your data. Just right click on the KPI graphic, enter the right value and the shape will adjust automatically. Make a visual impact with our KPI slides.
-
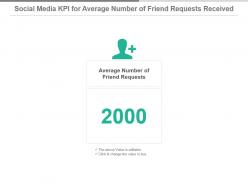 Social media kpi for average number of friend requests received powerpoint slide
Presenting social media kpi for average number of friend requests received powerpoint slide. This presentation slide shows one Key Performance Indicators or KPIs in a Dashboard style design. The first KPI that can be shown is Average Number of Friend Requests. These KPI Powerpoint graphics are all data driven, and the shape automatically adjusts according to your data. Just right click on the KPI graphic, enter the right value and the shape will adjust automatically. Make a visual impact with our KPI slides.
-
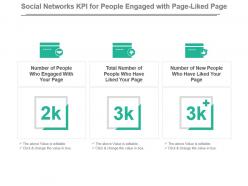 Social networks kpi for people engaged with page liked page ppt slide
Presenting social networks kpi for people engaged with page liked page ppt slide. This presentation slide shows three Key Performance Indicators or KPIs in a Dashboard style design. The first KPI that can be shown is Number of People Who Engaged With Your Page. The second KPI is Total Number of People Who Have Liked Your Page and the third is Number of New People Who Have Liked Your Page. These KPI Powerpoint graphics are all data driven, and the shape automatically adjusts according to your data. Just right click on the KPI graphic, enter the right value and the shape will adjust automatically. Make a visual impact with our KPI slides.
-
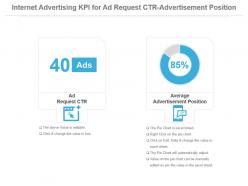 Internet advertising kpi for ad request ctr advertisement position powerpoint slide
Presenting internet advertising kpi for ad request ctr advertisement position powerpoint slide. This presentation slide shows Two Key Performance Indicators or KPIs in a Dashboard style design. The first KPI that can be shown is Ad Request CTR. The second KPI is Average Advertisement Position. These KPI Powerpoint graphics are all data driven, and the shape automatically adjusts according to your data. Just right click on the KPI graphic, enter the right value and the shape will adjust automatically. Make a visual impact with our KPI slides.
-
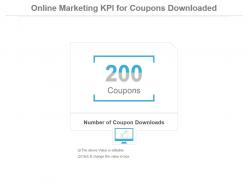 Online marketing kpi for coupons downloaded ppt slide
Presenting online marketing kpi for coupons downloaded ppt slide. This presentation slide shows one Key Performance Indicators or KPIs in a Dashboard style design. The first KPI that can be shown is Number of Coupon Downloads. These KPI Powerpoint graphics are all data driven, and the shape automatically adjusts according to your data. Just right click on the KPI graphic, enter the right value and the shape will adjust automatically. Make a visual impact with our KPI slides.
-
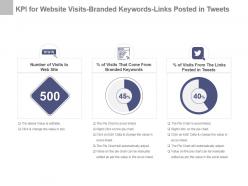 Kpi for website visits branded keywords links posted in tweets ppt slide
Presenting kpi for website visits branded keywords links posted in tweets ppt slide. This presentation slide shows three Key Performance Indicators or KPIs in a Dashboard style design. The first KPI that can be shown is Number of Visits to Web Site. The second KPI is Percentage of Visits That Come From Branded Keywords and the third is Percentage of Visits From The Links Posted in Tweets. These KPI Powerpoint graphics are all data driven, and the shape automatically adjusts according to your data. Just right click on the KPI graphic, enter the right value and the shape will adjust automatically. Make a visual impact with our KPI slides.
-
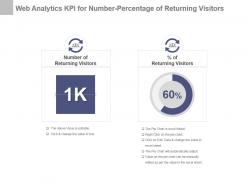 Web analytics kpi for number percentage of returning visitors ppt slide
Presenting web analytics kpi for number percentage of returning visitors ppt slide. This presentation slide shows two Key Performance Indicators or KPIs in a Dashboard style design. The first KPI that can be shown is Number of Returning Visitors. The second KPI is Percentage of Returning Visitors. These KPI Powerpoint graphics are all data driven, and the shape automatically adjusts according to your data. Just right click on the KPI graphic, enter the right value and the shape will adjust automatically. Make a visual impact with our KPI slides.
-
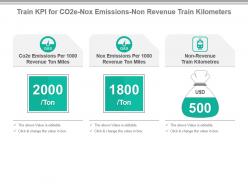 Train kpi for co2e nox emissions non revenue train kilometers powerpoint slide
Presenting train kpi for co2e nox emissions non revenue train kilometers powerpoint slide. This presentation slide shows Three Key Performance Indicators or KPIs in a Dashboard style design. The first KPI that can be shown is Co2e Emissions Per 1000 Revenue Ton Miles. The second KPI is Nox Emissions Per 1000 Revenue Ton Miles. The third is Non Revenue Train Kilometres. These KPI Powerpoint graphics are all data driven, and the shape automatically adjusts according to your data. Just right click on the KPI graphic, enter the right value and the shape will adjust automatically. Make a visual impact with our KPI slides.
-
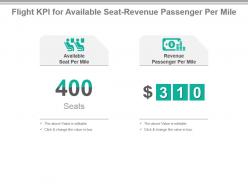 Flight kpi for available seat revenue passenger per mile ppt slide
Presenting flight kpi for available seat revenue passenger per mile ppt slide. This presentation slide shows two Key Performance Indicators or KPIs in a Dashboard style design. The first KPI that can be shown is Available Seat Per Mile. The second KPI is Revenue Passenger Per Mile. These KPI Powerpoint graphics are all data driven, and the shape automatically adjusts according to your data. Just right click on the KPI graphic, enter the right value and the shape will adjust automatically. Make a visual impact with our KPI slides.
-
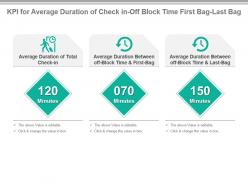 Kpi for average duration of check in off block time first bag last bag presentation slide
Presenting kpi for average duration of check in off block time first bag last bag presentation slide. This presentation slide shows three Key Performance Indicators or KPIs in a Dashboard style design. The first KPI that can be shown is Average Duration of Total Check in. The second KPI is Average Duration Between off Block Time And First Bag and the third is Average Duration Between off Block Time And Last Bag. These KPI Powerpoint graphics are all data driven, and the shape automatically adjusts according to your data. Just right click on the KPI graphic, enter the right value and the shape will adjust automatically. Make a visual impact with our KPI slides.
-
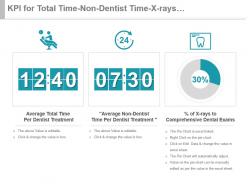 Kpi for total time non dentist time x rays to comprehensive dental exams powerpoint slide
Presenting kpi for total time non dentist time x rays to comprehensive dental exams powerpoint slide. This presentation slide shows three Key Performance Indicators or KPIs in a Dashboard style design. The first KPI that can be shown is Average Total Time Per Dentist Treatment. The second KPI is Average Non Dentist Time Per Dentist Treatment and the third is Percentage of X rays to Comprehensive Dental Exams. These KPI Powerpoint graphics are all data driven, and the shape automatically adjusts according to your data. Just right click on the KPI graphic, enter the right value and the shape will adjust automatically. Make a visual impact with our KPI slides.
-
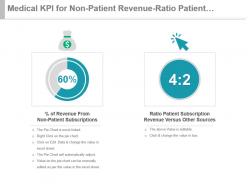 Medical kpi for non patient revenue ratio patient subscription presentation slide
Presenting medical kpi for non patient revenue ratio patient subscription presentation slide. This presentation slide shows two Key Performance Indicators or KPIs in a Dashboard style design. The first KPI that can be shown is percentage of Revenue From Non Patient Subscriptions. The second KPI is Ratio Patient Subscription Revenue Versus Other Sources. These KPI Powerpoint graphics are all data driven, and the shape automatically adjusts according to your data. Just right click on the KPI graphic, enter the right value and the shape will adjust automatically. Make a visual impact with our KPI slides.
-
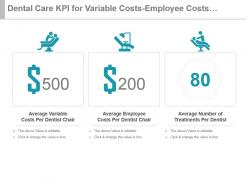 Dental care kpi for variable costs employee costs number of treatments ppt slide
Presenting dental care kpi for variable costs employee costs number of treatments ppt slide. This presentation slide shows three Key Performance Indicators or KPIs in a Dashboard style design. The first KPI that can be shown is Average Variable Costs Per Dentist Chair. The second KPI is Average Employee Costs Per Dentist Chair and the third is Average Number of Treatments Per Dentist. These KPI Powerpoint graphics are all data driven, and the shape automatically adjusts according to your data. Just right click on the KPI graphic, enter the right value and the shape will adjust automatically. Make a visual impact with our KPI slides.
-
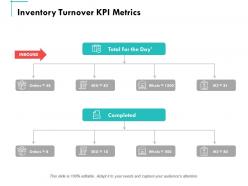 Inventory turnover kpi metrics ppt powerpoint presentation summary introduction
Presenting this set of slides with name - Inventory Turnover Kpi Metrics Ppt Powerpoint Presentation Summary Introduction. This is a three stages process. The stages in this process are Business, Management, Planning, Strategy, Marketing.
-
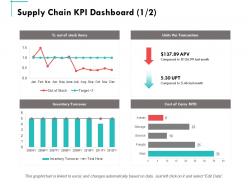 Supply chain kpi dashboard management ppt powerpoint presentation summary graphics tutorials
Presenting this set of slides with name - Supply Chain Kpi Dashboard Management Ppt Powerpoint Presentation Summary Graphics Tutorials. This is a four stages process. The stages in this process are Finance, Marketing, Management, Investment, Analysis.
-
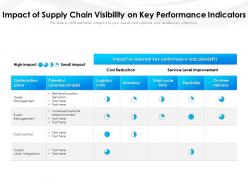 Impact of supply chain visibility on key performance indicators
Presenting this set of slides with name Impact Of Supply Chain Visibility On Key Performance Indicators. The topics discussed in these slides are Service Level Improvement, Cost Reduction, Optimization Areas, Logistics Costs, Inventory. This is a completely editable PowerPoint presentation and is available for immediate download. Download now and impress your audience.
-
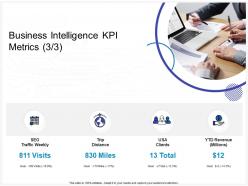 Business intelligence kpi metrics clients ppt powerpoint presentation ideas aids
Presenting this set of slides with name Business Intelligence KPI Metrics Clients Ppt Powerpoint Presentation Ideas Aids. This is a four stage process. The stages in this process are Seo Traffic Weekly, Trip Distance, Usa Clients, Ytd Revenue . This is a completely editable PowerPoint presentation and is available for immediate download. Download now and impress your audience.
-
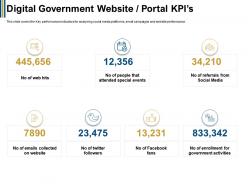 Digital government website portal kpis fans ppt powerpoint presentation professional guidelines
This slide covers the Key performance indicators for analysing social media platforms, email campaigns and website performance. Presenting this set of slides with name Digital Government Website Portal Kpis Fans Ppt Powerpoint Presentation Professional Guidelines. The topics discussed in these slides are Digital Government Website Portal KPIs. This is a completely editable PowerPoint presentation and is available for immediate download. Download now and impress your audience.
-
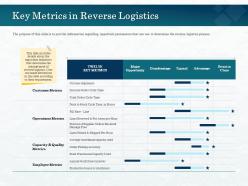 Key metrics in reverse logistics put away ppt powerpoint presentation infographic background
The purpose of this slide is to provide information regarding important parameters that are use to determine the reverse logistics process. Presenting this set of slides with name Key Metrics In Reverse Logistics Put Away Ppt Powerpoint Presentation Infographic Background. The topics discussed in these slides are Customer Metrics, Operations Metrics, Quality Metrics, Employee Metrics, Capacity. This is a completely editable PowerPoint presentation and is available for immediate download. Download now and impress your audience.
-
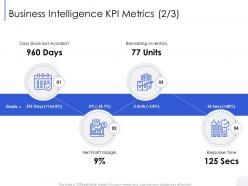 Business intelligence kpi metrics m2782 ppt powerpoint presentation icon portrait
Presenting this set of slides with name Business Intelligence KPI Metrics M2782 Ppt Powerpoint Presentation Icon Portrait. This is a four stage process. The stages in this process are Net Profit Margin, Inventory, Goal. This is a completely editable PowerPoint presentation and is available for immediate download. Download now and impress your audience.
-
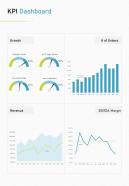 Kpi Dashboard Digital Content Marketing Proposal One Pager Sample Example Document
This is a One Pager designed in Powerpoint titled Kpi Dashboard Digital Content Marketing Proposal One Pager Sample Example Document. It is crafted using high-quality visuals that can be readjusted in PowerPoint and Google Slides. This template comes in an editable format and is available in A4 size format for immediate download.
-
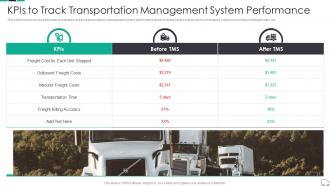 Kpis To Track Transportation Management System Continuous Process Improvement In Supply Chain
This slide focuses on key performance indicators to track transportation management system performance which includes freight cost for each unit shipped, outbound and inbound freight costs, etc. Present the topic in a bit more detail with this Kpis To Track Transportation Management System Continuous Process Improvement In Supply Chain. Use it as a tool for discussion and navigation on Transportation, Management, Performance. This template is free to edit as deemed fit for your organization. Therefore download it now.
-
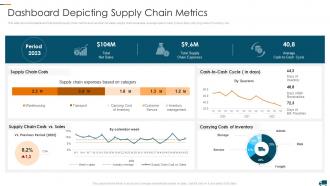 Dashboard Depicting Supply Chain Metrics Understanding Different Supply Chain Models
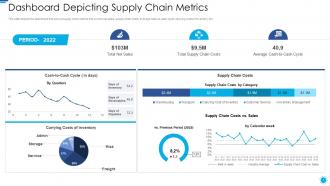
This slide shows the dashboard that depicts supply chain metrics such as total net sales, supply chain expenses, average cash to cash cycle in days, carrying costs of inventory, etc. Deliver an outstanding presentation on the topic using this Dashboard Depicting Supply Chain Metrics Understanding Different Supply Chain Models. Dispense information and present a thorough explanation of Carrying Costs Inventory, Supply Chain Expenses, Dashboard Depicting using the slides given. This template can be altered and personalized to fit your needs. It is also available for immediate download. So grab it now.
-
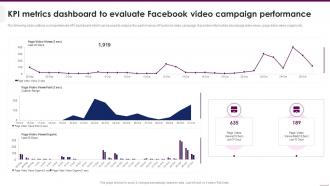 KPI Metrics Dashboard To Evaluate Implementing Video Marketing Strategies
The following slide outlines a comprehensive KPI dashboard which can be used to analyze the performance of Facebook video campaign. It provides information about page video views, page video views organic etc. Deliver an outstanding presentation on the topic using this KPI Metrics Dashboard To Evaluate Implementing Video Marketing Strategies. Dispense information and present a thorough explanation of Metrics Dashboard, Campaign Performance using the slides given. This template can be altered and personalized to fit your needs. It is also available for immediate download. So grab it now.
-
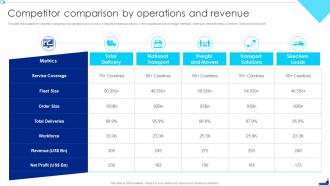 Shipping Company Profile Competitor Comparison By Operations And Revenue
The slide showcases the competitor comparison by operations and revenue. It depicts comparison metrics which includes service coverage, fleet size, order size, total deliveries, workforce, revenue and net profit. Present the topic in a bit more detail with this Shipping Company Profile Competitor Comparison By Operations And Revenue. Use it as a tool for discussion and navigation onService Coverage, Total Deliveries, Net Profit. This template is free to edit as deemed fit for your organization. Therefore download it now.
-
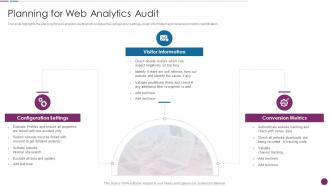 Planning For Web Analytics Audit Procedure To Perform Digital Marketing Audit
This slide highlights the planning for web analytics audit which includes the configuration settings, visitor information and conversion metrics identification. Increase audience engagement and knowledge by dispensing information using Planning For Web Analytics Audit Procedure To Perform Digital Marketing Audit. This template helps you present information on three stages. You can also present information on Visitor Information, Configuration Settings, Conversion Metrics using this PPT design. This layout is completely editable so personaize it now to meet your audiences expectations.
-
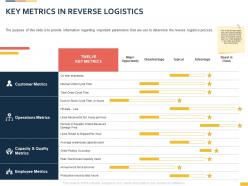 Key metrics in reverse logistics ppt powerpoint presentation visual aids styles
The purpose of this slide is to provide information regarding important parameters that are use to determine the reverse logistics process. Presenting this set of slides with name Key Metrics In Reverse Logistics Ppt Powerpoint Presentation Visual Aids Styles. The topics discussed in these slides are Key Metrics, Reverse, Logistics. This is a completely editable PowerPoint presentation and is available for immediate download. Download now and impress your audience.
-
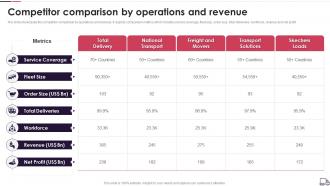 Logistics Transport Company Profile Competitor Comparison By Operations And Revenue
The slide showcases the competitor comparison by operations and revenue. It depicts comparison metrics which includes service coverage, fleet size, order size, total deliveries, workforce, revenue and net profit. Present the topic in a bit more detail with this Logistics Transport Company Profile Competitor Comparison By Operations And Revenue. Use it as a tool for discussion and navigation on Service Coverage, Fleet Size, Order Size, Total Deliveries, Workforce, Net Profit. This template is free to edit as deemed fit for your organization. Therefore download it now.
-
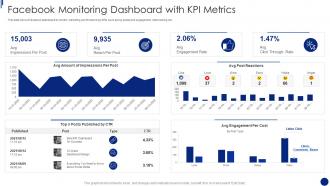 Facebook Marketing For Small Business Facebook Monitoring Dashboard With KPI Metrics
This slide shows Facebook dashboard to monitor marketing performance by KPIs such as top posts and engagement rate tracking etc. Deliver an outstanding presentation on the topic using this Facebook Marketing For Small Business Facebook Monitoring Dashboard With KPI Metrics. Dispense information and present a thorough explanation of Avg Amount Impressions Per Post, Top 3 Posts Published CTR, Avg Engagement Per Cost using the slides given. This template can be altered and personalized to fit your needs. It is also available for immediate download. So grab it now.
-
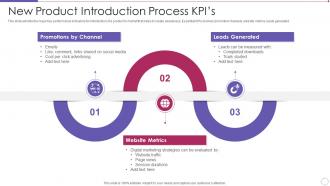 New Product Introduction Process KPIs
This slide exhibits the major Key performance indicators for introduction of a product in market that helps to create awareness. Essential KPIs involves promotion channels, website metrics, leads generated. Introducing our premium set of slides with New Product Introduction Process KPIs. Ellicudate the three stages and present information using this PPT slide. This is a completely adaptable PowerPoint template design that can be used to interpret topics like Promotions by Channel, Leads Generated, Website Metrics. So download instantly and tailor it with your information.
-
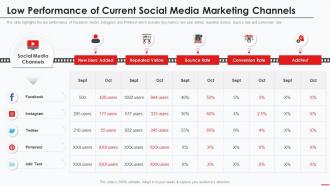 Marketing Guide Promote Products Channel Low Performance Of Current Social Media Marketing
This slide highlights the low performance of Facebook, twitter, Instagram and Pinterest which includes key metrics new user added, repeated visitors, bounce rate and conversion rate. Present the topic in a bit more detail with this Marketing Guide Promote Products Channel Low Performance Of Current Social Media Marketing. Use it as a tool for discussion and navigation on Marketing, Channels, Performance. This template is free to edit as deemed fit for your organization. Therefore download it now.
-
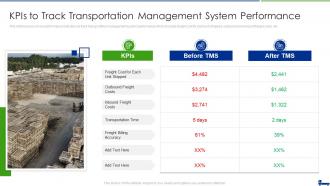 Managing Logistics Activities Chain Management Kpis To Track Transportation Management
This slide focuses on key performance indicators to track transportation management system performance which includes freight cost for each unit shipped, outbound and inbound freight costs, etc. Present the topic in a bit more detail with this Managing Logistics Activities Chain Management Kpis To Track Transportation Management. Use it as a tool for discussion and navigation on Transportation, Management, Performance. This template is free to edit as deemed fit for your organization. Therefore download it now.
-
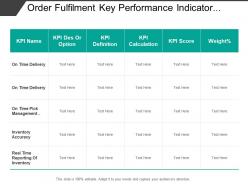 Order fulfillment key performance indicator include description score and value of weightage
Presenting this set of slides with name - Order Fulfillment Key Performance Indicator Include Description Score And Value Of Weightage. This is a five stage process. The stages in this process are Order Fulfillment, Supply Chain Management.
-
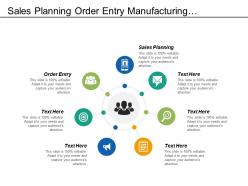 Sales planning order entry manufacturing scheduling internal reporting
Presenting this set of slides with name - Sales Planning Order Entry Manufacturing Scheduling Internal Reporting. This is an editable seven stages graphic that deals with topics like Sales Planning, Order Entry, Manufacturing Scheduling, Internal Reporting to help convey your message better graphically. This product is a premium product available for immediate download, and is 100 percent editable in Powerpoint. Download this now and use it in your presentations to impress your audience.
-
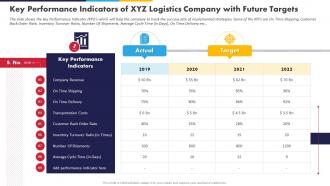 High Fuel Costs Logistics Company Key Performance Indicators Of XYZ Logistics Company
The slide shows the key Performance Indicator KPIs which will help the company to track the success rate of implemented strategies. Some of the KPIs are On Time Shipping, Customer Back Order Rate, Inventory Turnover Ratio, Number Of Shipments, Average Cycle Time in Days, On Time Delivery etc. Deliver an outstanding presentation on the topic using this High Fuel Costs Logistics Company Key Performance Indicators Of XYZ Logistics Company. Dispense information and present a thorough explanation of Company Revenue, Transportation Costs, Customer using the slides given. This template can be altered and personalized to fit your needs. It is also available for immediate download. So grab it now.
-
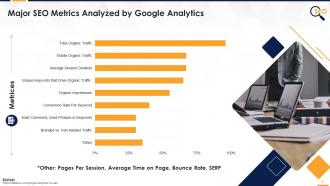 Major SEO Metrics Analyzed By Google Analytics Edu Ppt
Presenting Major SEO Metrics analyzed by Google Analytics. These slides are 100 percent made in PowerPoint and are compatible with all screen types and monitors. They also support Google Slides. Premium Customer Support available. Suitable for use by managers, employees, and organizations. These slides are easily customizable. You can edit the color, text, icon, and font size to suit your requirements.
-
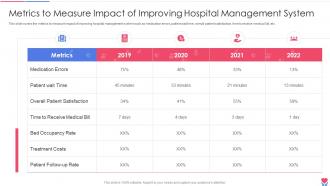 Metrics To Measure Impact Of Improving Healthcare Inventory Management System
This slide covers the metrics to measure impact of improving hospital management system such as medication errors, patient wait time, overall patient satisfaction, time to receive medical bill, etc.Present the topic in a bit more detail with this Metrics To Measure Impact Of Improving Healthcare Inventory Management System Use it as a tool for discussion and navigation on Reason For Hospitalization, Provided Procedures And Treatments, Patient And Family Instruction This template is free to edit as deemed fit for your organization. Therefore download it now.
-
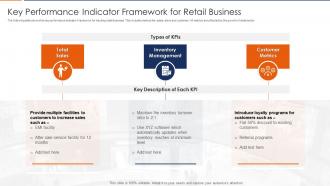 Key Performance Indicator Framework For Retail Business
The following slide shows the key performance indicator Framework for tracking retail business. This includes metrics like sales, stock and customer. All metrics are affected by the growth of retail sector. Introducing our premium set of slides with Key Performance Indicator Framework For Retail Business. Ellicudate the three stages and present information using this PPT slide. This is a completely adaptable PowerPoint template design that can be used to interpret topics like Total Sales, Inventory Management, Customer Metrics. So download instantly and tailor it with your information.
-
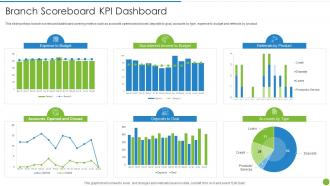 Offering Digital Financial Facility To Existing Customers Branch Scoreboard Kpi Dashboard
This slide portrays branch scoreboard dashboard covering metrics such as accounts opened and closed, deposits to goal, accounts by type, expense to budget and referrals by product. Present the topic in a bit more detail with this Offering Digital Financial Facility To Existing Customers Branch Scoreboard Kpi Dashboard. Use it as a tool for discussion and navigation on Branch Scoreboard Kpi Dashboard. This template is free to edit as deemed fit for your organization. Therefore download it now.
-
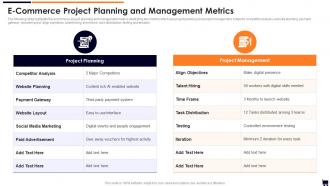 E Commerce Project Planning And Management Metrics
The following slide highlights the ecommerce project planning and management metrics illustrating two metrics which are project planning and project management, it depicts competitor analysis, website planning, payment gateway, website layout, align objectives, talent hiring, time frame, task distribution, testing and iteration Presenting our well structured E Commerce Project Planning And Management Metrics. The topics discussed in this slide are E Commerce Project Planning And Management Metrics. This is an instantly available PowerPoint presentation that can be edited conveniently. Download it right away and captivate your audience.
-
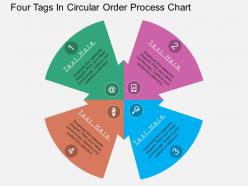 Cc four tags in circular order process chart flat powerpoint design
Presenting cc four tags in circular order process chart flat powerpoint design. Graphic of four tags in circular order and process chart has been used to design this Power point template diagram. This PPT diagram contains the concept of business data and process flow representation. Use this PPT diagram for business and marketing related presentations.
-
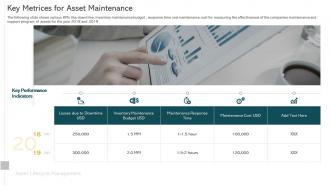 Asset lifecycle management key metrices for asset maintenance
The following slide shows various KPIs like downtime, inventory maintenance budget , response time and maintenance cost for measuring the effectiveness of the companies maintenance and support program of assets for the year 2018 and 2019. Increase audience engagement and knowledge by dispensing information using Asset Lifecycle Management Key Metrices For Asset Maintenance. This template helps you present information on one stages. You can also present information on Losses due to Downtime USD, Inventory Maintenance Budget USD, Maintenance Response Time, Maintenance Cost USD using this PPT design. This layout is completely editable so personaize it now to meet your audiences expectations.
-
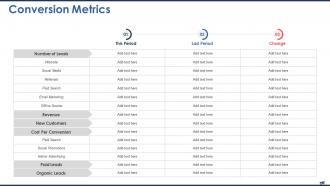 Digital marketing report conversion metrics ppt diagrams
Present the topic in a bit more detail with this Digital Marketing Report Conversion Metrics Ppt Diagrams. Use it as a tool for discussion and navigation on Revenue, New Customers, Cost Per Conversion. This template is free to edit as deemed fit for your organization. Therefore download it now.
-
 Digital marketing report key performance indicators ppt summary
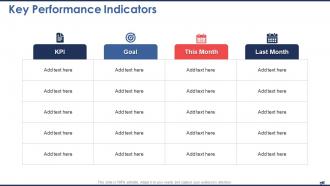
Present the topic in a bit more detail with this Digital Marketing Report Key Performance Indicators Ppt Summary. Use it as a tool for discussion and navigation on Key Performance Indicators. This template is free to edit as deemed fit for your organization. Therefore download it now.
-
 Kpi dashboard highlighting off page seo performance
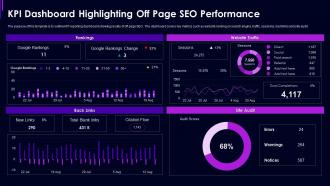
Introducing our KPI Dashboard Highlighting Off Page SEO Performance set of slides. The topics discussed in these slides are Kpi Dashboard Highlighting Off Page Seo Performance. This is an immediately available PowerPoint presentation that can be conveniently customized. Download it and convince your audience.
-
 Role of digital twin and iot dashboard depicting supply chain metrics
This slide depicts the dashboard that shows supply chain metrics that covers net sales, supply chain costs, average cash to cash cycle, carrying costs of inventory, etc. Present the topic in a bit more detail with this Role Of Digital Twin And Iot Dashboard Depicting Supply Chain Metrics. Use it as a tool for discussion and navigation on Dashboard Depicting Supply Chain Metrics. This template is free to edit as deemed fit for your organization. Therefore download it now.
-
 Kpi for send button messages inbox messages generated presentation slide
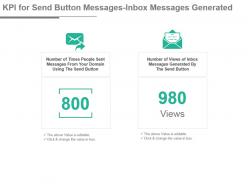
Presenting kpi for send button messages inbox messages generated presentation slide. This presentation slide shows two Key Performance Indicators or KPIs in a Dashboard style design. The first KPI that can be shown is Number of Times People Sent Messages From Your Domain Using The Send Button. The second KPI is Number of Views of Inbox Messages Generated By The Send Button. These KPI Powerpoint graphics are all data driven, and the shape automatically adjusts according to your data. Just right click on the KPI graphic, enter the right value and the shape will adjust automatically. Make a visual impact with our KPI slides.


