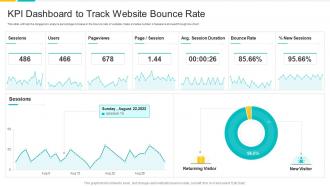
KPI Dashboard, Excel and Metrics PPT Templates
-
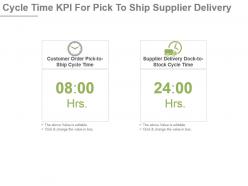 Cycle time kpi for pick to ship supplier delivery ppt slide
Presenting cycle time kpi for pick to ship supplier delivery ppt slide. This presentation slide shows Two Key Performance Indicators or KPIs in a Dashboard style design. The first KPI that can be shown is Customer Order Pick to Ship Cycle Time. The second KPI is Supplier Delivery Dock to Stock Cycle Time. These KPI Powerpoint graphics are all data driven, and the shape automatically adjusts according to your data. Just right click on the KPI graphic, enter the right value and the shape will adjust automatically. Make a visual impact with our KPI slides.
-
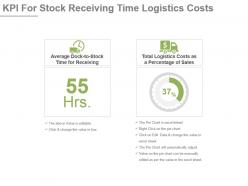 Kpi for stock receiving time logistics costs presentation slide
Presenting kpi for stock receiving time logistics costs presentation slide. This presentation slide shows Two Key Performance Indicators or KPIs in a Dashboard style design. The first KPI that can be shown is Average Dock to Stock Time for Receiving. The second KPI is Total Logistics Costs as a Percentage of Sales. These KPI Powerpoint graphics are all data driven, and the shape automatically adjusts according to your data. Just right click on the KPI graphic, enter the right value and the shape will adjust automatically. Make a visual impact with our KPI slides.
-
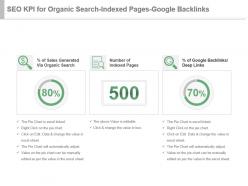 Seo kpi for organic search indexed pages google backlinks powerpoint slide
Presenting seo kpi for organic search indexed pages google backlinks powerpoint slide. This presentation slide shows Three Key Performance Indicators or KPIs in a Dashboard style design. The first KPI that can be shown is Percentage of Sales Generated Via Organic Search. The second KPI is Number of Indexed Pages. The third is Percentage of Google Backlinks Deep Links. These KPI Powerpoint graphics are all data driven, and the shape automatically adjusts according to your data. Just right click on the KPI graphic, enter the right value and the shape will adjust automatically. Make a visual impact with our KPI slides.
-
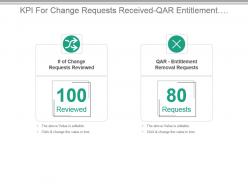 Kpi for change requests received qar entitlement removal requests presentation slide
Presenting kpi for change requests received qar entitlement removal requests presentation slide. This presentation slide shows two Key Performance Indicators or KPIs in a Dashboard style design. The first KPI that can be shown is of Change Requests Reviewed. The second KPI is QAR Entitlement Removal Requests. These KPI Powerpoint graphics are all data driven,and the shape automatically adjusts according to your data. Just right click on the KPI graphic,enter the right value and the shape will adjust automatically. Make a visual impact with our KPI slides.
-
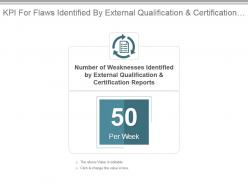 Kpi for flaws identified by external qualification and certification reports ppt slide
Presenting kpi for flaws identified by external qualification and certification reports ppt slide. This presentation slide shows one Key Performance Indicators or KPIs in a Dashboard style design. The first KPI that can be shown is Number of Weaknesses Identified by External Qualification and Certification Reports. These KPI Powerpoint graphics are all data driven,and the shape automatically adjusts according to your data. Just right click on the KPI graphic,enter the right value and the shape will adjust automatically. Make a visual impact with our KPI slides.
-
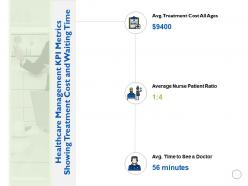 Healthcare management kpi metrics showing treatment cost and waiting time average
Presenting this set of slides with name Healthcare Management Kpi Metrics Showing Treatment Cost And Waiting Time Average. This is a three stage process. The stages in this process are Treatment, Cost, Time, Average, Business, Management. This is a completely editable PowerPoint presentation and is available for immediate download. Download now and impress your audience.
-
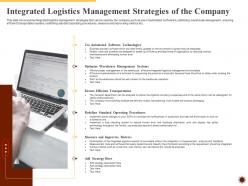 Integrated logistics management strategies integrated logistics management for increasing operational efficiency
This slide shows some integrated logistics management strategies that can be used by the company such as use of automated softwares, optimizing warehouse management, ensuring efficient transportation system, redefining standard operating procedures, measure and improvising metrics etc. Introducing Integrated Logistics Management Strategies Integrated Logistics Management For Increasing Operational Efficiency to increase your presentation threshold. Encompassed with six stages, this template is a great option to educate and entice your audience. Dispence information on Use Automated Software Technologies, Optimize Warehouse Management Systems, Ensure Efficient Transportation, Redefine Standard Operating Procedures, Measure And Improvise Metrics, using this template. Grab it now to reap its full benefits.
-
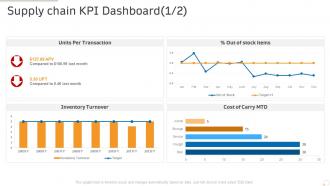 Supply chain kpi dashboard production management ppt powerpoint presentation model rules
Present the topic in a bit more detail with this Supply Chain KPI Dashboard Production Management Ppt Powerpoint Presentation Model Rules. Use it as a tool for discussion and navigation on Inventory Turnover, Cost, Units Per Transaction, Stock Items. This template is free to edit as deemed fit for your organization. Therefore download it now.
-
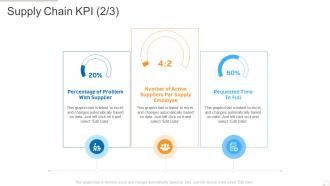 Supply chain kpi production management ppt powerpoint presentation infographics
Present the topic in a bit more detail with this Supply Chain KPI Production Management Ppt Powerpoint Presentation Infographics. Use it as a tool for discussion and navigation on Percentage Of Problem With Supplier, Number Of Active Suppliers Per Supply Employee, Requested Time In Full. This template is free to edit as deemed fit for your organization. Therefore download it now.
-
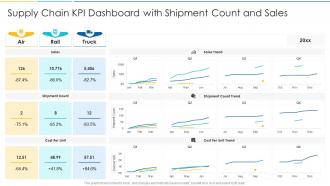 Supply chain kpi dashboard with shipment count and sales
Introducing our Supply Chain KPI Dashboard With Shipment Count And Sales set of slides. The topics discussed in these slides are Supply Chain KPI Dashboard With Shipment Count And Sales. This is an immediately available PowerPoint presentation that can be conveniently customized. Download it and convince your audience.
-
 Supply chain manager analysing kpi dashboard
Presenting our set of slides with Supply Chain Manager Analysing KPI Dashboard. This exhibits information on three stages of the process. This is an easy-to-edit and innovatively designed PowerPoint template. So download immediately and highlight information on Supply Chain Manager Analysing KPI Dashboard.
-
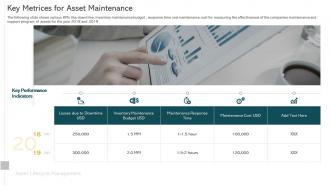 Asset lifecycle management key metrices for asset maintenance
The following slide shows various KPIs like downtime, inventory maintenance budget , response time and maintenance cost for measuring the effectiveness of the companies maintenance and support program of assets for the year 2018 and 2019. Increase audience engagement and knowledge by dispensing information using Asset Lifecycle Management Key Metrices For Asset Maintenance. This template helps you present information on one stages. You can also present information on Losses due to Downtime USD, Inventory Maintenance Budget USD, Maintenance Response Time, Maintenance Cost USD using this PPT design. This layout is completely editable so personaize it now to meet your audiences expectations.
-
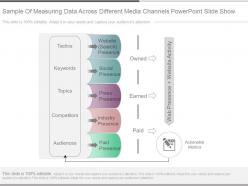 Sample of measuring data across different media channels powerpoint slide show
Presenting sample of measuring data across different media channels powerpoint slide show. This is a sample of measuring data across different media channels powerpoint slide show. This is a five stage process. The stages in this process are tactics, keywords, topics, competitors, audiences, website search presence, social presence, press presence, industry presence, paid presence, owned, earned, paid, web presence, website activity, actionable metrics.
-
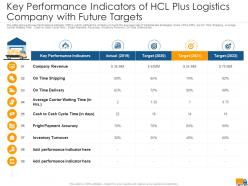 Key performance indicators of hcl plus logistics company with future targets ppt file show
The slide shows the key Performance Indicator KPIs which will help the company to track the success rate of implemented strategies. Some of the KPIs are On Time Shipping, Average Carrier Waiting Time , Cash to Cash Cycle Time , Fright Payment Accuracy , Inventory Turnover, On Time Delivery etc. Present the topic in a bit more detail with this Key Performance Indicators Of HCL Plus Logistics Company With Future Targets Ppt File Show. Use it as a tool for discussion and navigation on On Time Delivery, Revenue, Inventory Turnover, Payment Accuracy. This template is free to edit as deemed fit for your organization. Therefore download it now.
-
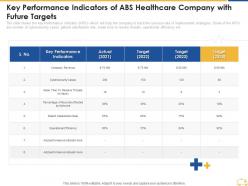 Key performance indicators of abs healthcare company with future targets
The slide shows the key Performance Indicator KPIs which will help the company to track the success rate of implemented strategies. Some of the KPIs are number of cybersecurity cases, patient satisfaction rate, mean time to resolve threats, operational efficiency etc. Deliver an outstanding presentation on the topic using this Key Performance Indicators Of Abs Healthcare Company With Future Targets. Dispense information and present a thorough explanation of Performance, Target, Revenue, Performance, Rate using the slides given. This template can be altered and personalized to fit your needs. It is also available for immediate download. So grab it now.
-
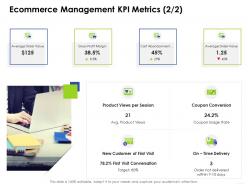 Ecommerce management kpi metrics e business management
Increase audience engagement and knowledge by dispensing information using Ecommerce Management KPI Metrics E Business Management. This template helps you present information on four stages. You can also present information on Average Order Value, Gross Profit Margin, Cart Abandonment, Average Order Value using this PPT design. This layout is completely editable so personaize it now to meet your audiences expectations.
-
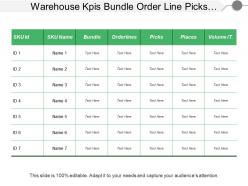 Warehouse kpis bundle order line picks pieces volume customer
Presenting this set of slides with name - Warehouse Kpis Bundle Order Line Picks Pieces Volume Customer. This is a seven stage process. The stages in this process are Warehouse Kpi, Warehouse Dashboard, Warehouse Metrics.
-
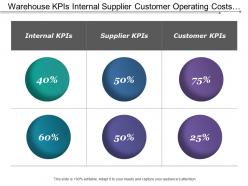 Warehouse kpis internal supplier customer operating costs shipments
Presenting this set of slides with name - Warehouse Kpis Internal Supplier Customer Operating Costs Shipments. This is a six stage process. The stages in this process are Warehouse Kpi, Warehouse Dashboard, Warehouse Metrics.
-
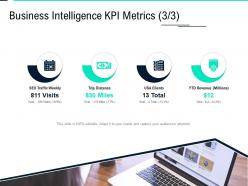 Business intelligence kpi metrics clients data integration ppt layouts maker
Increase audience engagement and knowledge by dispensing information using Business Intelligence Kpi Metrics Clients Data Integration Ppt Layouts Maker. This template helps you present information on four stages. You can also present information on Seo Traffic Weekly, Trip Distance, Usa Clients, Ytd Revenue using this PPT design. This layout is completely editable so personaize it now to meet your audiences expectations.
-
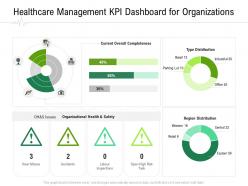 Healthcare management kpi dashboard for organizations hospital administration ppt pictures
Deliver an outstanding presentation on the topic using this Healthcare Management KPI Dashboard For Organizations Hospital Administration Ppt Pictures. Dispense information and present a thorough explanation of organizational health and safety, current overall completeness, labour inspections using the slides given. This template can be altered and personalized to fit your needs. It is also available for immediate download. So grab it now.
-
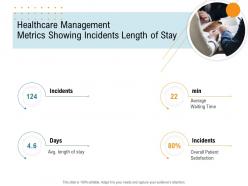 Healthcare management metrics showing incidents length of stay nursing ppt introduction
Introducing Healthcare Management Metrics Showing Incidents Length Of Stay Nursing Ppt Introduction. to increase your presentation threshold. Encompassed with four stages, this template is a great option to educate and entice your audience. Dispence information on incidents, average waiting time, overall patient satisfaction, using this template. Grab it now to reap its full benefits.
-
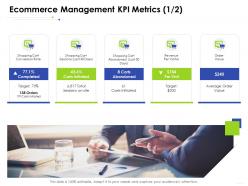 Ecommerce management kpi metrics ordere business management ppt designs
Introducing Ecommerce Management KPI Metrics Ordere Business Management Ppt Designs to increase your presentation threshold. Encompassed with five stages, this template is a great option to educate and entice your audience. Dispence information on Shopping Cart Conversion Rate, Shopping Cart Abandoned Last 30 Days, Revenue Per Visitor, using this template. Grab it now to reap its full benefits.
-
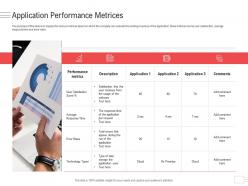 Application performance metrices enterprise application portfolio management ppt summary
The purpose of this slide is to display the various metrices based on which the company can evaluate the existing inventory of the application, these metrices can be user satisfaction, average response time and error rates.Deliver an outstanding presentation on the topic using this Application Performance Metrices Enterprise Application Portfolio Management Ppt Summary. Dispense information and present a thorough explanation of Performance Metrics, Average Response Time, Technology Types, Error Rates using the slides given. This template can be altered and personalized to fit your needs. It is also available for immediate download. So grab it now.
-
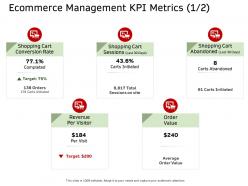 E commerce management kpi metrics order ppt formats
Increase audience engagement and knowledge by dispensing information using E Commerce Management KPI Metrics Order Ppt Formats. This template helps you present information on five stages. You can also present information on shopping cart, conversion rate, shopping cart sessions, order value using this PPT design. This layout is completely editable so personaize it now to meet your audiences expectations.
-
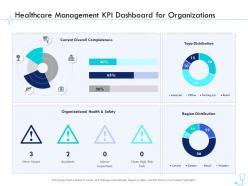 Healthcare management kpi dashboard for organizations pharma company management ppt information
Present the topic in a bit more detail with this Healthcare Management KPI Dashboard For Organizations Pharma Company Management Ppt Information. Use it as a tool for discussion and navigation on Organizational, Current Overall Completeness, Healthcare Management KPI Dashboard For Organizations. This template is free to edit as deemed fit for your organization. Therefore download it now.
-
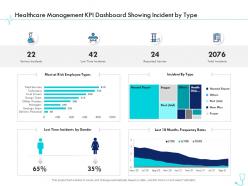 Healthcare management kpi dashboard showing incident by type pharma company management ppt elements
Deliver an outstanding presentation on the topic using this Healthcare Management KPI Dashboard Showing Incident By Type Pharma Company Management Ppt Elements. Dispense information and present a thorough explanation of Healthcare Management KPI Dashboard Showing Incident By Type using the slides given. This template can be altered and personalized to fit your needs. It is also available for immediate download. So grab it now.
-
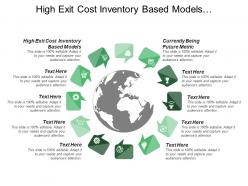 High exit cost inventory based models currently being future metric
Presenting this set of slides with name - High Exit Cost Inventory Based Models Currently Being Future Metric. This is an editable ten stages graphic that deals with topics like High Exit Cost Inventory Based Models, Currently Being Future Metric to help convey your message better graphically. This product is a premium product available for immediate download, and is 100 percent editable in Powerpoint. Download this now and use it in your presentations to impress your audience.
-
 Materials requirements planning system material planning order reporting
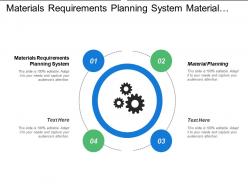
Presenting this set of slides with name - Materials Requirements Planning System Material Planning Order Reporting. This is an editable four stages graphic that deals with topics like Materials Requirements Planning System, Material Planning, Order Reporting to help convey your message better graphically. This product is a premium product available for immediate download, and is 100 percent editable in Powerpoint. Download this now and use it in your presentations to impress your audience.
-
 Healthcare marketing key performance indicators ppt powerpoint presentation icon elements
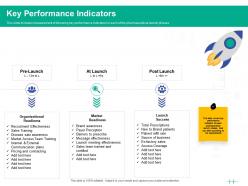
This slide includes measurement of following key performance indicators in each of the pharmaceutical launch phases. Increase audience engagement and knowledge by dispensing information using Healthcare Marketing Key Performance Indicators Ppt Powerpoint Presentation Icon Elements. This template helps you present information on three stages. You can also present information on Organizational Readiness, Market Readiness, Launch Success using this PPT design. This layout is completely editable so personalize it now to meet your audiences expectations.
-
 Order to cash process cycle from handling to reporting updates
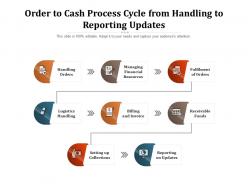
Presenting our well structured Order To Cash Process Cycle From Handling To Reporting Updates. The topics discussed in this slide are Detailed Billing Statement, Revenue Collection, Managing Financial Resources. This is an instantly available PowerPoint presentation that can be edited conveniently. Download it right away and captivate your audience.
-
 Advertising marketing pay per click dashboard of company powerpoint template
This slide shows the graphs of various metrics which helps in advertising marketing. Data covered under this dashboard include the data of number of campaigns, total cost , converted leads, cost trend and total conversion rate. This is a Advertising Marketing Pay Per Click Dashboard Of Company Powerpoint Template featuring in built editable components to add your personal touches. Tailor this template as per your liking and display it on a widescreen or standard screen, the choice is yours.
-
 Analytics dashboard for gym health and fitness clubs performance ppt powerpoint presentation pictures
This slide covers the Key performance indicators for analysing social media platforms, email campaigns and website performance Introducing Analytics Dashboard For Gym Health And Fitness Clubs Performance Ppt Powerpoint Presentation Pictures to increase your presentation threshold. Encompassed with seven stages, this template is a great option to educate and entice your audience. Dispence information on Analytics Dashboard For Gym Health And Fitness Clubs , using this template. Grab it now to reap its full benefits.
-
 E resources and content kpi for page content likes number of posts powerpoint slide
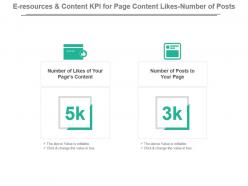
Presenting e resources and content kpi for page content likes number of posts powerpoint slide. This presentation slide shows two Key Performance Indicators or KPIs in a Dashboard style design. The first KPI that can be shown is Number of Likes of Your Pages Content. The second KPI is Number of Posts to Your Page. These KPI Powerpoint graphics are all data driven, and the shape automatically adjusts according to your data. Just right click on the KPI graphic, enter the right value and the shape will adjust automatically. Make a visual impact with our KPI slides.
-
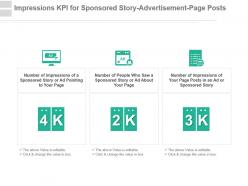 Impressions kpi for sponsored story advertisement page posts powerpoint slide
Presenting impressions kpi for sponsored story advertisement page posts powerpoint slide. This presentation slide shows three Key Performance Indicators or KPIs in a Dashboard style design. The first KPI that can be shown is Number of Impressions of a Sponsored Story or Ad Pointing to Your Page. The second KPI is Number of People Who Saw a Sponsored Story or Ad About Your Page and the third is Number of Impressions of Your Page Posts in an Ad or Sponsored Story. These KPI Powerpoint graphics are all data driven, and the shape automatically adjusts according to your data. Just right click on the KPI graphic, enter the right value and the shape will adjust automatically. Make a visual impact with our KPI slides.
-
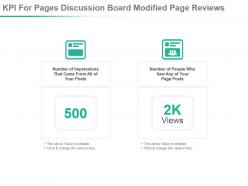 Kpi for pages discussion board modified page reviews powerpoint slide
Presenting kpi for pages discussion board modified page reviews powerpoint slide. This presentation slide shows two Key Performance Indicators or KPIs in a Dashboard style design. The first KPI that can be shown is Number of Impressions That Came From All of Your Posts. The second KPI is Number of People Who Saw Any of Your Page Posts. These KPI Powerpoint graphics are all data driven, and the shape automatically adjusts according to your data. Just right click on the KPI graphic, enter the right value and the shape will adjust automatically. Make a visual impact with our KPI slides.
-
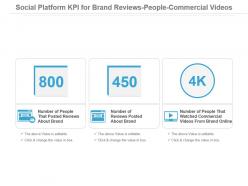 Social platform kpi for brand reviews people commercial videos presentation slide
Presenting social platform kpi for brand reviews people commercial videos presentation slide. This presentation slide shows three Key Performance Indicators or KPIs in a Dashboard style design. The first KPI that can be shown is Number of People That Posted Reviews About Brand. The second KPI is Number of Reviews Posted About Brand and the third is Number of People That Watched Commercial Videos From Brand Online. These KPI Powerpoint graphics are all data driven, and the shape automatically adjusts according to your data. Just right click on the KPI graphic, enter the right value and the shape will adjust automatically. Make a visual impact with our KPI slides.
-
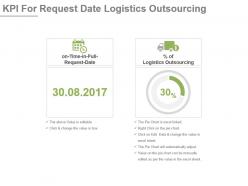 Kpi for request date logistics outsourcing powerpoint slide
Presenting kpi for request date logistics outsourcing powerpoint slide. This presentation slide shows Two Key Performance Indicators or KPIs in a Dashboard style design. The first KPI that can be shown is on Time in Full Request Date. The second KPI is Percentage of Logistics Outsourcing. These KPI Powerpoint graphics are all data driven, and the shape automatically adjusts according to your data. Just right click on the KPI graphic, enter the right value and the shape will adjust automatically. Make a visual impact with our KPI slides.
-
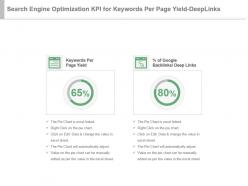 Search engine optimization kpi for keywords per page yield deep links ppt slide
Presenting search engine optimization kpi for keywords per page yield deep links ppt slide. This presentation slide shows Two Key Performance Indicators or KPIs in a Dashboard style design. The first KPI that can be shown is Keywords Per Page Yield. The second KPI is Percentage of Google Backlinks Deep Links. These KPI Powerpoint graphics are all data driven, and the shape automatically adjusts according to your data. Just right click on the KPI graphic, enter the right value and the shape will adjust automatically. Make a visual impact with our KPI slides.
-
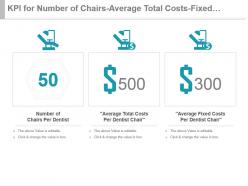 Kpi for number of chairs average total costs fixed costs per dentist presentation slide
Presenting kpi for number of chairs average total costs fixed costs per dentist presentation slide. This presentation slide shows three Key Performance Indicators or KPIs in a Dashboard style design. The first KPI that can be shown is Number of Chairs Per Dentist. The second KPI is Average Total Costs Per Dentist Chair and the third is Average Fixed Costs Per Dentist Chair. These KPI Powerpoint graphics are all data driven, and the shape automatically adjusts according to your data. Just right click on the KPI graphic, enter the right value and the shape will adjust automatically. Make a visual impact with our KPI slides.
-
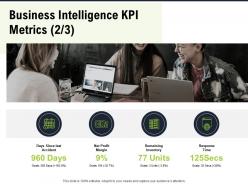
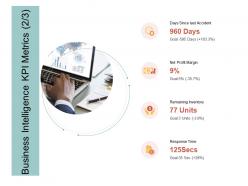 Business intelligence kpi metrics days ppt powerpoint presentation ideas shapes
Presenting this set of slides with name Business Intelligence KPI Metrics Days Ppt Powerpoint Presentation Ideas Shapes. This is a four stage process. The stages in this process are Days Since Last Accident, Net Profit Margin, Remaining Inventory, Response Time. This is a completely editable PowerPoint presentation and is available for immediate download. Download now and impress your audience.
-
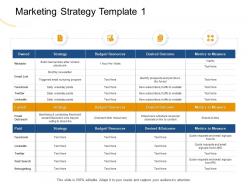 Marketing strategy template 1 website ppt powerpoint presentation show inspiration
Presenting this set of slides with name Marketing Strategy Template 1 Website Ppt Powerpoint Presentation Show Inspiration. The topics discussed in these slides are Resources, Strategy, Budget, Metrics To Measure, Desired Outcome. This is a completely editable PowerPoint presentation and is available for immediate download. Download now and impress your audience.
-
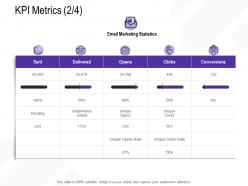 Kpi Metrics Emails M2678 Ppt Powerpoint Presentation Portfolio Topics
Presenting this set of slides with name KPI Metrics Emails M2678 Ppt Powerpoint Presentation Portfolio Topics. The topics discussed in these slides are KPI Metrics. This is a completely editable PowerPoint presentation and is available for immediate download. Download now and impress your audience.
-
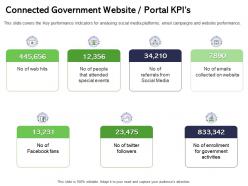 Connected government website portal kpis attended ppt powerpoint presentation icon graphic tips
This slide covers the Key performance indicators for analysing social media platforms, email campaigns and website performance. Presenting this set of slides with name Connected Government Website Portal KPIS Attended Ppt Powerpoint Presentation Icon Graphic Tips. The topics discussed in these slides are Connected Government Website Portal KPIs. This is a completely editable PowerPoint presentation and is available for immediate download. Download now and impress your audience.
-
 Business intelligence kpi metrics m2800 ppt powerpoint presentation summary professional
Presenting this set of slides with name Business Intelligence KPI Metrics M2800 Ppt Powerpoint Presentation Summary Professional. This is a four stage process. The stages in this process are Net Profit Margin, Inventory, Goal. This is a completely editable PowerPoint presentation and is available for immediate download. Download now and impress your audience.
-
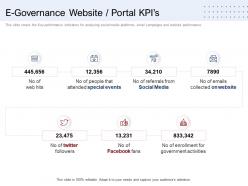 E governance website portal kpis ppt powerpoint presentation portfolio deck
This slide covers the Key performance indicators for analysing social media platforms email campaigns and website performance. Presenting this set of slides with name E Governance Website Portal Kpis Ppt Powerpoint Presentation Portfolio Deck. This is a seven stage process. The stages in this process are E Governance Website Portal KPIS. This is a completely editable PowerPoint presentation and is available for immediate download. Download now and impress your audience.
-
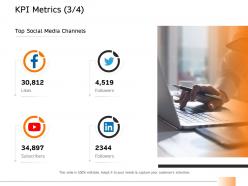 Kpi metrics r731 ppt powerpoint presentation portfolio shapes
Presenting this set of slides with name KPI Metrics R731 Ppt Powerpoint Presentation Portfolio Shapes. This is a one stage process. The stages in this process are KPI Metrics. This is a completely editable PowerPoint presentation and is available for immediate download. Download now and impress your audience.
-
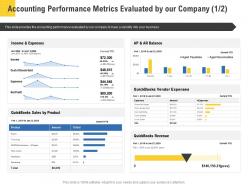 Corporate service providers accounting performance metrics evaluated by our company ppt deck
This slide provides the accounting performance evaluated by our company to have a visibility into your business. Deliver an outstanding presentation on the topic using this Corporate Service Providers Accounting Performance Metrics Evaluated By Our Company Ppt Deck. Dispense information and present a thorough explanation of Sales, Product, Expenses, Income, Customer using the slides given. This template can be altered and personalized to fit your needs. It is also available for immediate download. So grab it now.
-
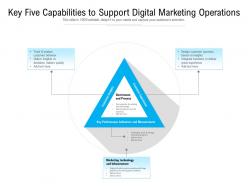 Key five capabilities to support digital marketing operations
Presenting this set of slides with name Key Five Capabilities To Support Digital Marketing Operations. The topics discussed in these slides are Customer Insights, Customer Experience, Key Performance Indicators, Measurement. This is a completely editable PowerPoint presentation and is available for immediate download. Download now and impress your audience.
-
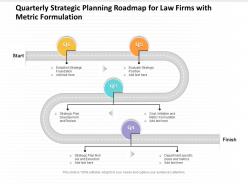 Quarterly strategic planning roadmap for law firms with metric formulation
Presenting Quarterly Strategic Planning Roadmap For Law Firms With Metric Formulation PowerPoint slide. This PPT slide is available at 4,3 and 16,9 aspect ratios. You can download this PPT theme in various formats like PDF, PNG, and JPG. This PowerPoint template is completely editable and you can modify the font size, font type, and shapes as per your requirements. Our PPT layout is compatible with Google Slides.
-
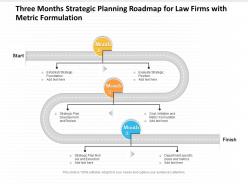 Three months strategic planning roadmap for law firms with metric formulation
Presenting Three Months Strategic Planning Roadmap For Law Firms With Metric Formulation PowerPoint slide. This PPT slide is available at 4,3 and 16,9 aspect ratios. You can download this PPT theme in various formats like PDF, PNG, and JPG. This PowerPoint template is completely editable and you can modify the font size, font type, and shapes as per your requirements. Our PPT layout is compatible with Google Slides.
-
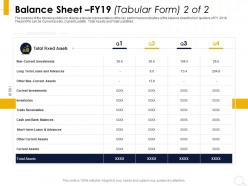 Balance sheet fy19 tabular form inventories ppt powerpoint presentation summary examples
The purpose of the following slide is to display a tabular representation of the key performance indicators of the balance sheet for four quarters of FY 2019. These KPIs can be Current assets, Current Liability , Total Assets and Total Liabilities. Presenting this set of slides with name Balance Sheet FY19 Tabular Form Inventories Ppt Powerpoint Presentation Summary Examples. The topics discussed in these slides are Current Investments, Current Assets, Inventories, Cash, Bank Balances. This is a completely editable PowerPoint presentation and is available for immediate download. Download now and impress your audience.
-
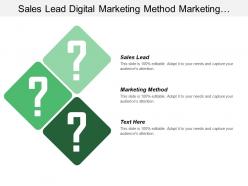 Sales lead digital marketing method marketing performance metrics
Presenting this set of slides with name - Sales Lead Digital Marketing Method Marketing Performance Metrics. This is an editable three stages graphic that deals with topics like Sales Lead, Digital Marketing Method, Marketing Performance Metrics to help convey your message better graphically. This product is a premium product available for immediate download and is 100 percent editable in Powerpoint. Download this now and use it in your presentations to impress your audience.
-
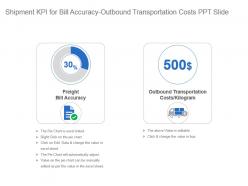 Shipment kpi for bill accuracy outbound transportation costs ppt slide
Presenting shipment kpi for bill accuracy outbound transportation costs ppt slide. This presentation slide shows two Key Performance Indicators or KPIs in a Dashboard style design. The first KPI that can be shown is Freight Bill Accuracy. The second KPI is Outbound Transportation Costs Kilogram. These KPI Powerpoint graphics are all data driven, and the shape automatically adjusts according to your data. Just right click on the KPI graphic, enter the right value and the shape will adjust automatically. Make a visual impact with our KPI slides.
-
 Content creation kpi for story published about page powerpoint slide
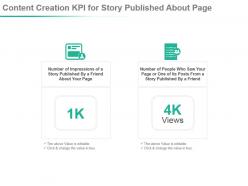
Presenting content creation kpi for story published about page powerpoint slide. This presentation slide shows two Key Performance Indicators or KPIs in a Dashboard style design. The first KPI that can be shown is Number of Impressions of a Story Published By a Friend About Your Page. The second KPI is Number of People Who Saw Your Page or One of Its Posts From a Story Published By a Friend. These KPI Powerpoint graphics are all data driven, and the shape automatically adjusts according to your data. Just right click on the KPI graphic, enter the right value and the shape will adjust automatically. Make a visual impact with our KPI slides.
-
 Data analytics kpi for page viewed stories domain impressions presentation slide
Presenting data analytics kpi for page viewed stories domain impressions presentation slide. This presentation slide shows two Key Performance Indicators or KPIs in a Dashboard style design. The first KPI that can be shown is Number of Times People Viewed Stories That Link to Your Site in News Feed or Page. The second KPI is Number of Comments Box Impressions on Your Domain. These KPI Powerpoint graphics are all data driven, and the shape automatically adjusts according to your data. Just right click on the KPI graphic, enter the right value and the shape will adjust automatically. Make a visual impact with our KPI slides.
-
 E resources kpi for clicked content viewed page deleted comments presentation slide
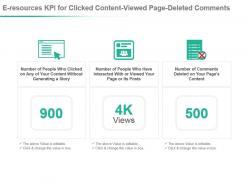
Presenting e resources kpi for clicked content viewed page deleted comments presentation slide. This presentation slide shows three Key Performance Indicators or KPIs in a Dashboard style design. The first KPI that can be shown is Number of People Who Clicked on Any of Your Content Without Generating a Story. The second KPI is Number of People Who Have Interacted With or Viewed Your Page or Its Posts and the third is Number of Comments Deleted on Your Pages Content. These KPI Powerpoint graphics are all data driven, and the shape automatically adjusts according to your data. Just right click on the KPI graphic, enter the right value and the shape will adjust automatically. Make a visual impact with our KPI slides.
-
 Seo kpi for index to crawl ratios natural traffic per keyword presentation slide
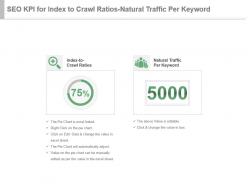
Presenting seo kpi for index to crawl ratios natural traffic per keyword presentation slide. This presentation slide shows Two Key Performance Indicators or KPIs in a Dashboard style design. The first KPI that can be shown is Index to Crawl Ratios. The second KPI is Natural Traffic Per Keyword. These KPI Powerpoint graphics are all data driven, and the shape automatically adjusts according to your data. Just right click on the KPI graphic, enter the right value and the shape will adjust automatically. Make a visual impact with our KPI slides.
-
 Ontime value kpi for orders damage shipments ppt slide
Presenting ontime value kpi for orders damage shipments ppt slide. This presentation slide shows two Key Performance Indicators or KPIs in a Dashboard style design. The first KPI that can be shown is Orders, Correct Documentation. The second KPI is Orders, Damage Shipments. These KPI Powerpoint graphics are all data driven, and the shape automatically adjusts according to your data. Just right click on the KPI graphic, enter the right value and the shape will adjust automatically. Make a visual impact with our KPI slides.
-
 E resources and content kpi for post impressions viewed page posts ppt slide
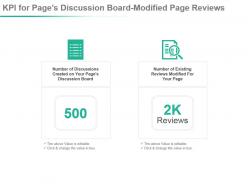
Presenting e resources and content kpi for post impressions viewed page posts ppt slide. This presentation slide shows two Key Performance Indicators or KPIs in a Dashboard style design. The first KPI that can be shown is Number of Discussions Created on Your Pages Discussion Board. The second KPI is Number of Existing Reviews Modified For Your Page. These KPI Powerpoint graphics are all data driven, and the shape automatically adjusts according to your data. Just right click on the KPI graphic, enter the right value and the shape will adjust automatically. Make a visual impact with our KPI slides.


