KPI Dashboard, Excel and Metrics PPT Templates
-
 Kpi for stock available stock controlled skus ppt slide
Presenting kpi for stock available stock controlled skus ppt slide. This presentation slide shows Two Key Performance Indicators or KPIs in a Dashboard style design. The first KPI that can be shown is Percentage of Stock Available at Customers First Request. The second KPI is Percentage of Stock Controlled SKUs. These KPI Powerpoint graphics are all data driven, and the shape automatically adjusts according to your data. Just right click on the KPI graphic, enter the right value and the shape will adjust automatically. Make a visual impact with our KPI slides.
-
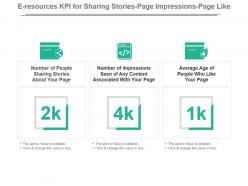 E resources kpi for sharing stories page impressions page like ppt slide
Presenting e resources kpi for sharing stories page impressions page like ppt slide. This presentation slide shows three Key Performance Indicators or KPIs in a Dashboard style design. The first KPI that can be shown is Number of People Sharing Stories About Your Page. The second KPI is Number of Impressions Seen of Any Content Associated With Your Page and the third is Average Age of People Who Like Your Page. These KPI Powerpoint graphics are all data driven, and the shape automatically adjusts according to your data. Just right click on the KPI graphic, enter the right value and the shape will adjust automatically. Make a visual impact with our KPI slides.
-
 Kpi for page content deleted likes videos post audio files played ppt slide
Presenting kpi for page content deleted likes videos post audio files played ppt slide. This presentation slide shows three Key Performance Indicators or KPIs in a Dashboard style design. The first KPI that can be shown is Number of Deletes of Likes of Your Pages Content. The second KPI is Number of Videos Posted to Your Page and the third is Number of Times Your Pages Audio Files Where Played. These KPI Powerpoint graphics are all data driven, and the shape automatically adjusts according to your data. Just right click on the KPI graphic, enter the right value and the shape will adjust automatically. Make a visual impact with our KPI slides.
-
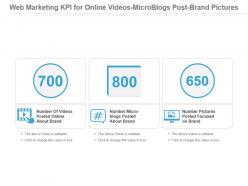 Web Marketing Kpi For Online Videos Microblogs Post Brand Pictures Presentation Slide
Presenting web marketing kpi for online videos microblogs post brand pictures presentation slide. This presentation slide shows three Key Performance Indicators or KPIs in a Dashboard style design. The first KPI that can be shown is Number Of Videos Posted Online About Brand. The second KPI is Number Micro blogs Posted About Brand and the third is Number Pictures Posted Focused on Brand. These KPI Powerpoint graphics are all data driven, and the shape automatically adjusts according to your data. Just right click on the KPI graphic, enter the right value and the shape will adjust automatically. Make a visual impact with our KPI slides.
-
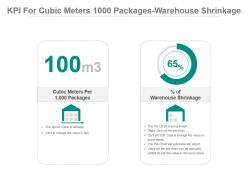 Kpi for cubic meters 1000 packages warehouse shrinkage percentage powerpoint slide
Presenting kpi for cubic meters 1000 packages warehouse shrinkage percentage powerpoint slide. This presentation slide shows Two Key Performance Indicators or KPIs in a Dashboard style design. The first KPI that can be shown is Cubic Meters Per 1,000 Packages. The second KPI is Percentage of Warehouse Shrinkage. These KPI Powerpoint graphics are all data driven, and the shape automatically adjusts according to your data. Just right click on the KPI graphic, enter the right value and the shape will adjust automatically. Make a visual impact with our KPI slides.
-
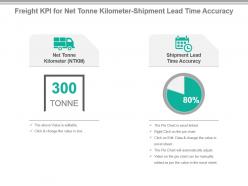 Freight kpi for net tonne kilometer shipment lead time accuracy powerpoint slide
Presenting freight kpi for net tonne kilometer shipment lead time accuracy powerpoint slide. This presentation slide shows two Key Performance Indicators or KPIs in a Dashboard style design. The first KPI that can be shown is Net Tonne Kilometer NTKM. The second KPI is Shipment Lead Time Accuracy. These KPI Powerpoint graphics are all data driven, and the shape automatically adjusts according to your data. Just right click on the KPI graphic, enter the right value and the shape will adjust automatically. Make a visual impact with our KPI slides.
-
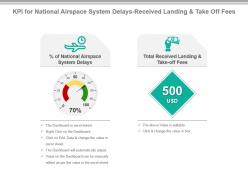 Kpi for national airspace system delays received landing and take off fees presentation slide
Presenting kpi for national airspace system delays received landing and take off fees presentation slide. This presentation slide shows Two Key Performance Indicators or KPIs in a Dashboard style design. The first KPI that can be shown is Percentage of National Airspace System Delays. The second KPI is Total Received Landing and Take off Fees. These KPI Powerpoint graphics are all data driven, and the shape automatically adjusts according to your data. Just right click on the KPI graphic, enter the right value and the shape will adjust automatically. Make a visual impact with our KPI slides.
-
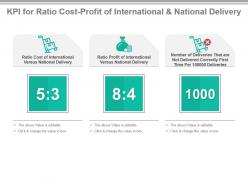 Kpi for ratio cost profit of international and national delivery presentation slide
Presenting kpi for ratio cost profit of international and national delivery presentation slide. This presentation slide shows Three Key Performance Indicators or KPIs in a Dashboard style design. The first KPI that can be shown is Ratio Cost of International Versus National Delivery. The second KPI is Ratio Profit of International Versus National Delivery. The third is Number of Deliveries That are Not Delivered Correctly First Time Per 100000 Deliveries. These KPI Powerpoint graphics are all data driven, and the shape automatically adjusts according to your data. Just right click on the KPI graphic, enter the right value and the shape will adjust automatically. Make a visual impact with our KPI slides.
-
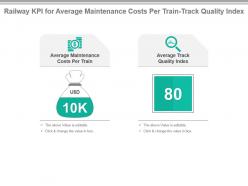 Railway kpi for average maintenance costs per train track quality index powerpoint slide
Presenting railway kpi for average maintenance costs per train track quality index powerpoint slide. This presentation slide shows Two Key Performance Indicators or KPIs in a Dashboard style design. The first KPI that can be shown is Average Maintenance Costs Per Train. The second KPI is Average Track Quality Index. These KPI Powerpoint graphics are all data driven, and the shape automatically adjusts according to your data. Just right click on the KPI graphic, enter the right value and the shape will adjust automatically. Make a visual impact with our KPI slides.
-
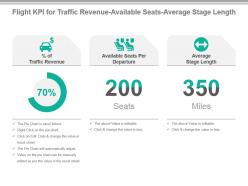 Flight kpi for traffic revenue available seats average stage length presentation slide
Presenting flight kpi for traffic revenue available seats average stage length presentation slide. This presentation slide shows three Key Performance Indicators or KPIs in a Dashboard style design. The first KPI that can be shown is percentage of Traffic Revenue. The second KPI is Available Seats Per Departure and the third is Average Stage Length. These KPI Powerpoint graphics are all data driven, and the shape automatically adjusts according to your data. Just right click on the KPI graphic, enter the right value and the shape will adjust automatically. Make a visual impact with our KPI slides.
-
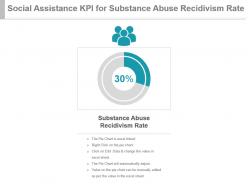 Social assistance kpi for substance abuse recidivism rate ppt slide
Presenting social assistance kpi for substance abuse recidivism rate ppt slide. This presentation slide shows one Key Performance Indicators or KPIs in a Dashboard style design. The first KPI that can be shown is Substance Abuse Recidivism Rate. These KPI Powerpoint graphics are all data driven, and the shape automatically adjusts according to your data. Just right click on the KPI graphic, enter the right value and the shape will adjust automatically. Make a visual impact with our KPI slides.
-
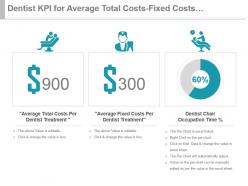 Dentist kpi for average total costs fixed costs occupation time presentation slide
Presenting dentist kpi for average total costs fixed costs occupation time presentation slide. This presentation slide shows three Key Performance Indicators or KPIs in a Dashboard style design. The first KPI that can be shown is Average Total Costs Per Dentist Treatment. The second KPI is Average Fixed Costs Per Dentist Treatment and the third is Dentist Chair Occupation Time percentage. These KPI Powerpoint graphics are all data driven, and the shape automatically adjusts according to your data. Just right click on the KPI graphic, enter the right value and the shape will adjust automatically. Make a visual impact with our KPI slides.
-
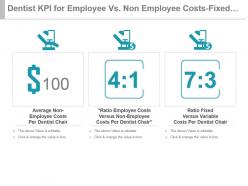 Dentist kpi for employee vs non employee costs fixed variable costs powerpoint slide
Presenting dentist kpi for employee vs non employee costs fixed variable costs powerpoint slide. This presentation slide shows three Key Performance Indicators or KPIs in a Dashboard style design. The first KPI that can be shown is Average Non Employee Costs Per Dentist Chair. The second KPI is Ratio Employee Costs Versus Non Employee Costs Per Dentist Chair and the third is Ratio Fixed Versus Variable Costs Per Dentist Chair. These KPI Powerpoint graphics are all data driven, and the shape automatically adjusts according to your data. Just right click on the KPI graphic, enter the right value and the shape will adjust automatically. Make a visual impact with our KPI slides.
-
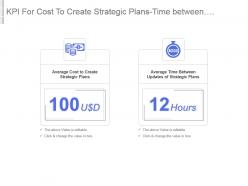 Kpi for cost to create strategic plans time between strategic plans updates ppt slide
Presenting kpi for cost to create strategic plans time between strategic plans updates ppt slide. This presentation slide shows two Key Performance Indicators or KPIs in a Dashboard style design. The first KPI that can be shown is Average Cost to Create Strategic Plans. The second KPI is Average Time Between Updates of Strategic Plans. These KPI Powerpoint graphics are all data driven, and the shape automatically adjusts according to your data. Just right click on the KPI graphic, enter the right value and the shape will adjust automatically. Make a visual impact with our KPI slides.
-
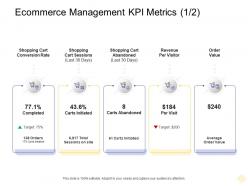 Ecommerce management kpi metrics shopping cart digital business management ppt icons
Increase audience engagement and knowledge by dispensing information using Ecommerce Management Kpi Metrics Shopping Cart Digital Business Management Ppt Icons. This template helps you present information on four stages. You can also present information on Shopping Cart Conversion Rate,Shopping Cart Sessions, Shopping Cart Abandoned, Revenue Per Visitor, Order Value using this PPT design. This layout is completely editable so personaize it now to meet your audiences expectations.
-
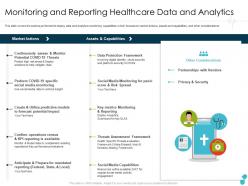 Monitoring and reporting healthcare data and analytics vendors ppt professional
This slide covers the actions performed to deploy data and analytics monitoring capabilities which focuses on market actions, assets and capabilities, and other considerations.Deliver an outstanding presentation on the topic using this Monitoring And Reporting Healthcare Data And Analytics Vendors Ppt Professional. Dispense information and present a thorough explanation of Data Protection Framework, Threats Assessment Framework, Key Metrics Monitoring And Reporting using the slides given. This template can be altered and personalized to fit your needs. It is also available for immediate download. So grab it now.
-
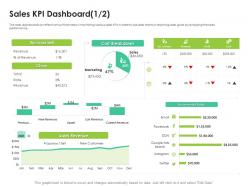 Sales Kpi Dashboard Email Sales Kpi Dashboard Email Revenue Marketing Customers Ppt Images
The sales dashboard is an effective tool that helps in monitoring various sales KPIs in order to aid sales teams in reaching sales goals by analyzing the sales performance. Present the topic in a bit more detail with this Sales Kpi Dashboard Email Sales KPI Dashboard Email Revenue Marketing Customers Ppt Images. Use it as a tool for discussion and navigation on Revenue, Sale, Cost, Marketing. This template is free to edit as deemed fit for your organization. Therefore download it now.
-
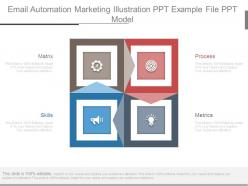 Email Automation Marketing Illustration Ppt Example File Ppt Model
Presenting email automation marketing illustration ppt example file ppt model. This is a email automation marketing illustration ppt example file ppt model. This is a four stage process. The stages in this process are process, metrics, skills, matrix.
-
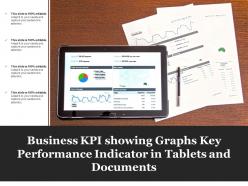 Business kpi showing graphs key performance indicator in tablets and documents
Presenting this set of slides with name - Business Kpi Showing Graphs Key Performance Indicator In Tablets And Documents. This is a four stage process. The stages in this process are Business Kpi, Business Dashboard, Business Metrics.
-
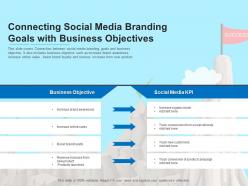 Connecting social media branding goals with business objectives
Presenting our set of slides with Connecting Social Media Branding Goals With Business Objectives. This exhibits information on one stages of the process. This is an easy-to-edit and innovatively designed PowerPoint template. So download immediately and highlight information on Business Objective, Social Media KPI.
-
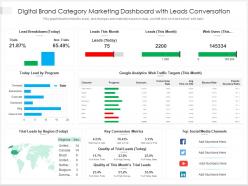 Digital brand category marketing dashboard with leads conversation
Introducing our Digital Brand Category Marketing Dashboard With Leads Conversation set of slides. The topics discussed in these slides are Key Conversion Metrics, Top Social Media Channels, Trial Leads By Region. This is an immediately available PowerPoint presentation that can be conveniently customized. Download it and convince your audience.
-
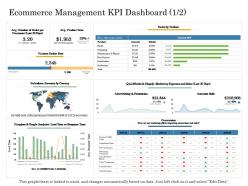 Ecommerce management kpi dashboard country online trade management ppt graphics
Deliver an outstanding presentation on the topic using this Ecommerce Management Kpi Dashboard Country Online Trade Management Ppt Graphics. Dispense information and present a thorough explanation of revenue, returning customers, product page visits using the slides given. This template can be altered and personalized to fit your needs. It is also available for immediate download. So grab it now.
-
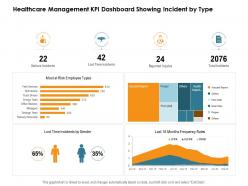 Healthcare management kpi dashboard showing incident by type nursing management ppt sample
Deliver an outstanding presentation on the topic using this Healthcare Management KPI Dashboard Showing Incident By Type Nursing Management Ppt Sample. Dispense information and present a thorough explanation of serious incidents, lost time incidents, reported injuries, total incidents using the slides given. This template can be altered and personalized to fit your needs. It is also available for immediate download. So grab it now.
-
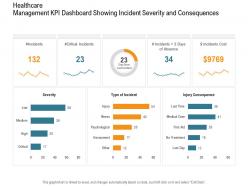 Healthcare management kpi dashboard showing incident severity consequences nursing ppt elements
Present the topic in a bit more detail with this Healthcare Management KPI Dashboard Showing Incident Severity Consequences Nursing Ppt Elements. Use it as a tool for discussion and navigation on high, low, medium. This template is free to edit as deemed fit for your organization. Therefore download it now.
-
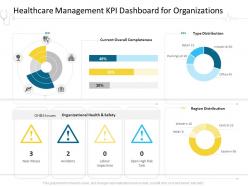 Healthcare management kpi dashboard for organizations hospital management ppt ideas
Deliver an outstanding presentation on the topic using this Healthcare Management KPI Dashboard For Organizations Hospital Management Ppt Ideas. Dispense information and present a thorough explanation of Healthcare Management KPI Dashboard For Organizations using the slides given. This template can be altered and personalized to fit your needs. It is also available for immediate download. So grab it now.
-
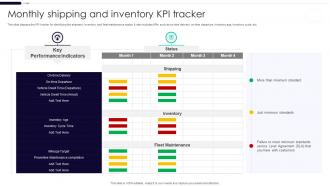 Monthly Shipping And Inventory KPI Tracker
This slide displays the KPI tracker for identifying the shipment, inventory, and fleet maintenance status. It also includes KPIs such as on time delivery, on-time departure, inventory age, inventory cycle, etc. Introducing our Monthly Shipping And Inventory KPI Tracker set of slides. The topics discussed in these slides are Shipping, Inventory, Fleet Maintenance. This is an immediately available PowerPoint presentation that can be conveniently customized. Download it and convince your audience.
-
 On Time Delivery Shipping KPI Icon
Presenting our well-structured On Time Delivery Shipping KPI Icon. The topics discussed in this slide are On Time Delivery, Shipping KPI, Icon. This is an instantly available PowerPoint presentation that can be edited conveniently. Download it right away and captivate your audience.
-
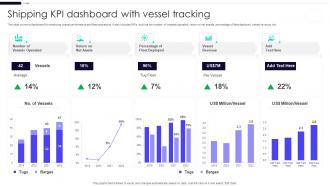 Shipping KPI Dashboard With Vessel Tracking
This slide covers a dashboard for analyzing vessel performance and fleet operations. It also includes KPIs such as the number of vessels operated, return on net assets, percentage of fleet deployed, vessel revenue, etc. Presenting our well-structured Shipping KPI Dashboard With Vessel Tracking. The topics discussed in this slide are Shipping KPI Dashboard, Vessel Tracking. This is an instantly available PowerPoint presentation that can be edited conveniently. Download it right away and captivate your audience.
-
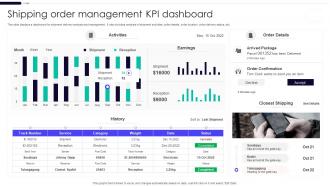 Shipping Order Management KPI Dashboard
This slide displays a dashboard for shipment delivery analysis and management. It also includes analysis of shipment activities, order details, order location, order delivery status, etc. Presenting our well-structured Shipping Order Management KPI Dashboard. The topics discussed in this slide are Shipping Order Management, KPI Dashboard. This is an instantly available PowerPoint presentation that can be edited conveniently. Download it right away and captivate your audience.
-
 Kpis For Inventory Management In Warehouse
This slide represents the metrics for warehouse stock management. It includes KPIs such as internal, supplier and customer. Introducing our premium set of slides with Kpis For Inventory Management In Warehouse. Ellicudate the three stages and present information using this PPT slide. This is a completely adaptable PowerPoint template design that can be used to interpret topics like Supplier Kpis, Customer Kpis, Internal Kpis. So download instantly and tailor it with your information.
-
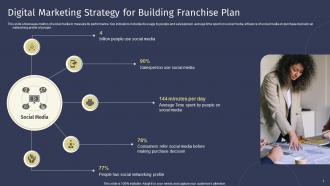 Digital Marketing Strategy For Building Franchise Plan
This slide showcases metrics of social media to measure its performance. Key indicators includes its usage by people and salesperson, average time spent on social media, influence of social media on purchase decision an networking profile of people. Presenting our set of slides with name Digital Marketing Strategy For Building Franchise Plan. This exhibits information on five stages of the process. This is an easy-to-edit and innovatively designed PowerPoint template. So download immediately and highlight information on Digital Marketing Strategy, Building Franchise Plan.
-
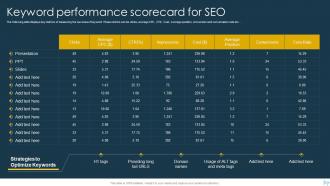 Keyword Performance Scorecard For SEO B2b And B2c Marketing Strategy SEO Strateg
The following slide displays key metrics of measuring the success of keyword. These metrics can be clicks, average CPC, CTR, Cost, Average position, conversion and conversation rate etc.Deliver an outstanding presentation on the topic using this Keyword Performance Scorecard For SEO B2b And B2c Marketing Strategy SEO Strateg. Dispense information and present a thorough explanation of Average, Impressions, Average Position using the slides given. This template can be altered and personalized to fit your needs. It is also available for immediate download. So grab it now.
-
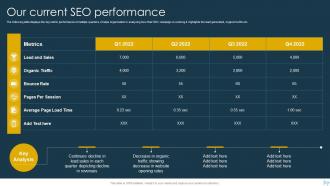 Our Current SEO Performance B2b And B2c Marketing Strategy SEO Strateg
The following slide displays the key metric performance of multiple quarters ,it helps organization in analyzing how their SEO campaign is wokring.it highlights the lead generated, organic traffic etc. Deliver an outstanding presentation on the topic using this Our Current SEO Performance B2b And B2c Marketing Strategy SEO Strateg. Dispense information and present a thorough explanation of Quarter Depicting, Opening Rates, Quarter Depicting using the slides given. This template can be altered and personalized to fit your needs. It is also available for immediate download. So grab it now.
-
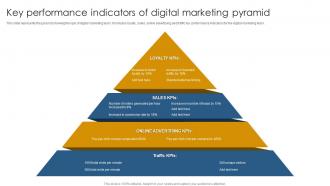 Key Performance Indicators Of Digital Marketing Pyramid
This slide represents the pyramid showing the kpis of digital marketing team. It includes loyalty, sales, online advertising and traffic key performance indicators for the digital marketing team. Presenting our set of slides with name Key Performance Indicators Of Digital Marketing Pyramid. This exhibits information on four stages of the process. This is an easy-to-edit and innovatively designed PowerPoint template. So download immediately and highlight information on Sales KPIS, Loyalty KPIS, Online Advertising KPIS.
-
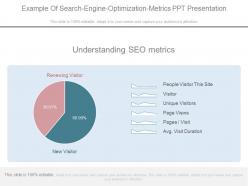 Innovative example of search engine optimization metrics ppt presentation
Presenting innovative example of search engine optimization metrics ppt presentation. This is a example of search engine optimization metrics ppt presentation. This is a two stage process. The stages in this process are understanding seo metrics, people visitor this site, visitor, unique visitors, page views, pages visit, avg visit duration, new visitor, renewing visitor.
-
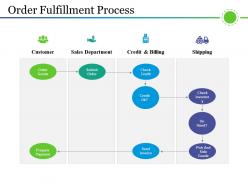 Order fulfillment process powerpoint slide introduction
Presenting Order Fulfillment Process PowerPoint Slide Introduction PPT template. This presentation has been professionally designed and is fully editable in PowerPoint. Our team of PPT designers has used the best PowerPoint templates, images, icons, and layouts currently available. Apart from that, the template can be made inclusive of impressive, editable data visualization tools like charts, graphs, and tables. Owing to its compatibility with Google Slides, it is easy to use and can be saved in JPG or PDF format at just the click of a button.
-
 Performance management kpi metrics communication ppt powerpoint presentation inspiration
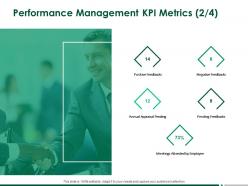
Presenting this set of slides with name Performance Management KPI Metrics Communication Ppt Powerpoint Presentation Inspiration. This is a five stage process. The stages in this process are Positive Feedbacks, Negative Feedbacks, Pending Feedbacks, Planning, Marketing. This is a completely editable PowerPoint presentation and is available for immediate download. Download now and impress your audience.
-
 Inventory turnover kpi metrics management marketing ppt powerpoint presentation summary slides
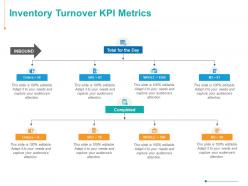
Presenting this set of slides with name Inventory Turnover KPI Metrics Management Marketing Ppt Powerpoint Presentation Summary Slides. This is a two stage process. The stages in this process are Business, Management, Planning, Strategy, Marketing. This is a completely editable PowerPoint presentation and is available for immediate download. Download now and impress your audience.
-
 Hospital business plan healthcare management kpi metrics showing incidents length of stay ppt themes
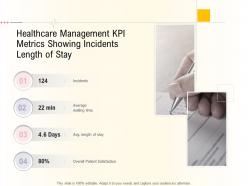
Introducing Hospital Business Plan Healthcare Management KPI Metrics Showing Incidents Length Of Stay Ppt Themes to increase your presentation threshold. Encompassed with four stages, this template is a great option to educate and entice your audience. Dispence information on Healthcare Management KPI Metrics Showing Incidents Length Of Stay, using this template. Grab it now to reap its full benefits.
-
 Impact Of Poor Vendor Management On Major KPIs Increasing Supply Chain Value
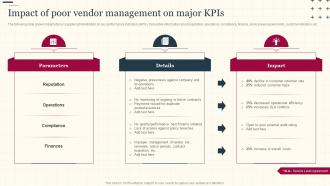
The following slide shows impact of poor supplier administration on key performance indicators KPIs. It provides information about reputation, operations, compliance, finance, service level agreements, customer retention, etc. Increase audience engagement and knowledge by dispensing information using Impact Of Poor Vendor Management On Major KPIs Increasing Supply Chain Value. This template helps you present information on three stages. You can also present information on Parameters, Reputation, Operations, Finances using this PPT design. This layout is completely editable so personaize it now to meet your audiences expectations.
-
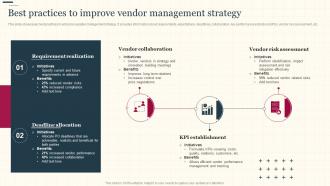 Increasing Supply Chain Value Best Practices To Improve Vendor Management Strategy
This slide showcases best practices to enhance supplier management strategy. It provides information about requirements, expectations, deadlines, collaboration, key performance indicators KPIs, vendor risk assessment, etc. Introducing Increasing Supply Chain Value Best Practices To Improve Vendor Management Strategy to increase your presentation threshold. Encompassed with three stages, this template is a great option to educate and entice your audience. Dispence information on Vendor Collaboration, Vendor Risk Assessment, KPI Establishment, using this template. Grab it now to reap its full benefits.
-
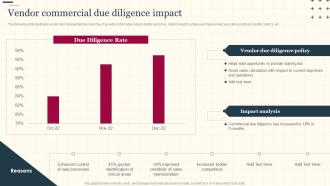 Increasing Supply Chain Value Vendor Commercial Due Diligence Impact
The following slide illustrates vendor risk management process flow. It provides information about identify outcomes, data to insight, continuous improvement, execution practices, identify metrics, etc. Present the topic in a bit more detail with this Increasing Supply Chain Value Vendor Commercial Due Diligence Impact. Use it as a tool for discussion and navigation on Due Diligence Rate, Sale Processes, Sales Memorandum. This template is free to edit as deemed fit for your organization. Therefore download it now.
-
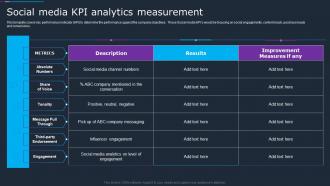 Social Media Kpi Analytics Measurement Company Social Strategy Guide
This template covers key performance indicator KPI to determine the performance against the company objectives. These Social media KPIs would be focusing on social engagements, content reach, purchase leads and conversions. Deliver an outstanding presentation on the topic using this Social Media Kpi Analytics Measurement Company Social Strategy Guide. Dispense information and present a thorough explanation of Analytics, Measurement, Performance using the slides given. This template can be altered and personalized to fit your needs. It is also available for immediate download. So grab it now.
-
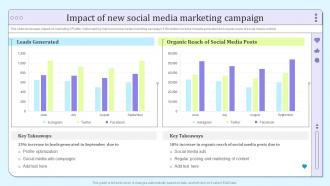 B2b Social Media Marketing And Promotion Impact Of New Social Media Marketing Campaign
This slide showcases impact on marketing KPI after implementing improved social media marketing campaign. It illustrates increase in leads generated and organic reach of social media content. Deliver an outstanding presentation on the topic using this B2b Social Media Marketing And Promotion Impact Of New Social Media Marketing Campaign. Dispense information and present a thorough explanation of Marketing, Campaign, Optimization using the slides given. This template can be altered and personalized to fit your needs. It is also available for immediate download. So grab it now.
-
 Dashboard For Tracking Digital Content Performance Customer Journey Touchpoint Mapping Strategy
This slide covers the KPI dashboard for analyzing online content. It includes metrics such as blog visitors, pageviews, newsletter conversion rate, new signups, new customers, etc. Present the topic in a bit more detail with this Dashboard For Tracking Digital Content Performance Customer Journey Touchpoint Mapping Strategy. Use it as a tool for discussion and navigation on Dashboard For Tracking, Digital Content Performance. This template is free to edit as deemed fit for your organization. Therefore download it now.
-
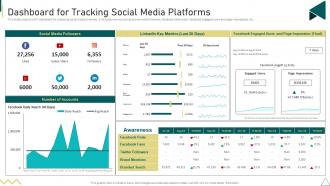 Dashboard For Tracking Social Media Platforms Customer Journey Touchpoint Mapping Strategy
This slide covers the KPI dashboard for analyzing social media channels. It includes metrics such as social media followers, Facebook daily reach, Facebook engaged users and page impressions, etc. Deliver an outstanding presentation on the topic using this Dashboard For Tracking Social Media Platforms Customer Journey Touchpoint Mapping Strategy. Dispense information and present a thorough explanation of Dashboard For Tracking, Social Media Platforms using the slides given. This template can be altered and personalized to fit your needs. It is also available for immediate download. So grab it now.
-
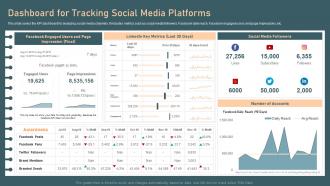 Dashboard For Tracking Social Media Platforms Identifying And Optimizing Customer Touchpoints
This slide covers the KPI dashboard for analyzing social media channels. It includes metrics such as social media followers, Facebook daily reach, Facebook engaged users and page impressions, etc. Deliver an outstanding presentation on the topic using this Dashboard For Tracking Social Media Platforms Identifying And Optimizing Customer Touchpoints. Dispense information and present a thorough explanation of Dashboard For Tracking, Social Media Platforms using the slides given. This template can be altered and personalized to fit your needs. It is also available for immediate download. So grab it now.
-
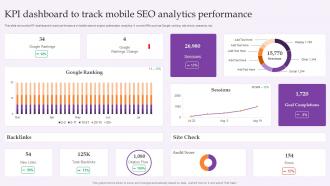 KPI Dashboard To Track Mobile SEO Analytics Performance
This slide shows the KPI dashboard to track performance of mobile search engine optimization analytics. It covers KPIs such as Google ranking, site check, sessions, etc. Introducing our KPI Dashboard To Track Mobile SEO Analytics Performance set of slides. The topics discussed in these slides are Google Ranking, Total Backlinks, New Links, Audit Score. This is an immediately available PowerPoint presentation that can be conveniently customized. Download it and convince your audience.
-
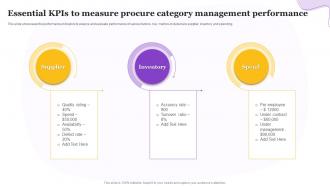 Essential KPIs To Measure Procure Category Management Performance
This slide showcases the performance indicators to analyze and evaluate performance of various factors. Key metrics included are supplier, inventory and spending. Presenting our set of slides with Essential KPIs To Measure Procure Category Management Performance. This exhibits information on four stages of the process. This is an easy to edit and innovatively designed PowerPoint template. So download immediately and highlight information on Supplier, Inventory, Spend.
-
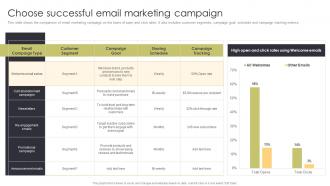 Choose Successful Email Marketing Campaign Sales Automation Procedure For Better Deal Management
This slide shows the comparison of email marketing campaign on the basis of open and click rates. It also includes customer segments, campaign goal, schedule and campaign tracking metrics. Present the topic in a bit more detail with this Choose Successful Email Marketing Campaign Sales Automation Procedure For Better Deal Management. Use it as a tool for discussion and navigation on Newsletters, Promotional Campaigns, Announcement Emails. This template is free to edit as deemed fit for your organization. Therefore download it now.
-
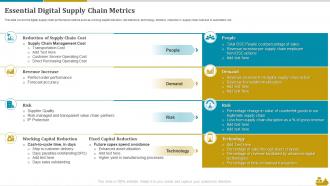 Essential Digital Supply Chain Metrics Shipping And Logistics Ppt File Infographics
This slide covers the digital supply chain performance metrics such as working capital reduction, risk tolerance, technology, demand, reduction in supply chain cost due to automation etc. Introducing Essential Digital Supply Chain Metrics Shipping And Logistics Ppt File Infographics to increase your presentation threshold. Encompassed with four stages, this template is a great option to educate and entice your audience. Dispence information on Reduction Of Supply Chain Cost, Working Capital Reduction, Fixed Capital Reduction, using this template. Grab it now to reap its full benefits.
-
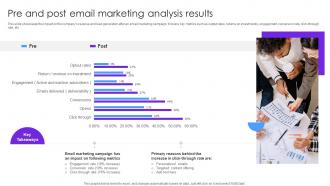 Pre And Post Email Marketing Analysis Results
This slide showcases the impact on the companys revenue and lead generation after an email marketing campaign. It covers key metrics such as output rates, returns on investments, engagement, conversion rate, click-through rate, etc. Presenting our well-structured Pre And Post Email Marketing Analysis Results. The topics discussed in this slide are Pre Post, Email Marketing Analysis, Results. This is an instantly available PowerPoint presentation that can be edited conveniently. Download it right away and captivate your audience.
-
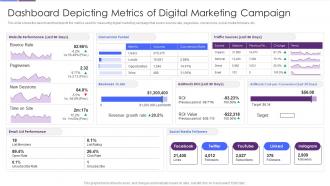 Dashboard Depicting Metrics Of Digital Marketing Improving Strategic Plan Of Internet Marketing
This slide shows the dashboard that depicts the metrics used for measuring digital marketing campaign that covers bounce rate, pageviews, conversions, social media followers, etc. Present the topic in a bit more detail with this Dashboard Depicting Metrics Of Digital Marketing Improving Strategic Plan Of Internet Marketing. Use it as a tool for discussion and navigation on Conversion Funnel, Adwords ROI, Adwords, Cost Per Conversion. This template is free to edit as deemed fit for your organization. Therefore download it now.
-
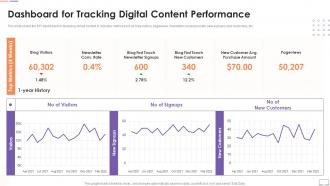 F552 Dashboard For Tracking Digital Content Performance Customer Touchpoint Guide To Improve User Experience
This slide covers the KPI dashboard for analyzing online content. It includes metrics such as blog visitors, pageviews, newsletter conversion rate, new signups, new customers, etc. Present the topic in a bit more detail with this F552 Dashboard For Tracking Digital Content Performance Customer Touchpoint Guide To Improve User Experience. Use it as a tool for discussion and navigation on Performance, Dashboard, Pageviews. This template is free to edit as deemed fit for your organization. Therefore download it now.
-
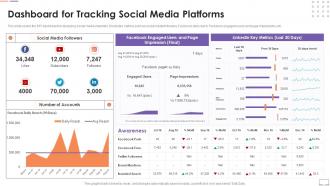 F553 Dashboard For Tracking Social Media Platforms Customer Touchpoint Guide To Improve User Experience
This slide covers the KPI dashboard for analyzing social media channels. It includes metrics such as social media followers, Facebook daily reach, Facebook engaged users and page impressions, etc. Deliver an outstanding presentation on the topic using this F553 Dashboard For Tracking Social Media Platforms Customer Touchpoint Guide To Improve User Experience. Dispense information and present a thorough explanation of Dashboard, Impressions, Analyzing using the slides given. This template can be altered and personalized to fit your needs. It is also available for immediate download. So grab it now.
-
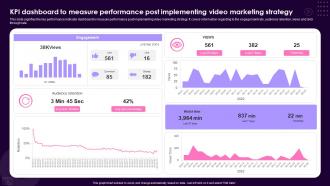 KPI Dashboard To Measure Performance Post Implementing Video Marketing Strategy
This slide signifies the key performance indicator dashboard to measure performance post implementing video marketing strategy. It covers information regarding to the engagement rate, audience retention, views and click through rate. Presenting our well-structured KPI Dashboard To Measure Performance Post Implementing Video Marketing Strategy. The topics discussed in this slide are KPI Dashboard, Measure Performance, Post Implementing, Video Marketing Strategy. This is an instantly available PowerPoint presentation that can be edited conveniently. Download it right away and captivate your audience.
-
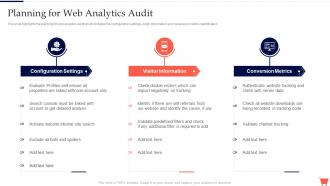 Planning For Web Analytics Audit Complete Guide To Conduct Digital Marketing Audit
This slide highlights the planning for web analytics audit which includes the configuration settings, visitor information and conversion metrics identification. Introducing Planning For Web Analytics Audit Complete Guide To Conduct Digital Marketing Audit to increase your presentation threshold. Encompassed with three stages, this template is a great option to educate and entice your audience. Dispence information on Configuration Settings, Visitor Information, Conversion Metrics, using this template. Grab it now to reap its full benefits.
-
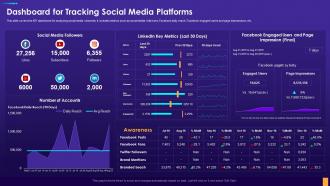 Dashboard For Tracking Social Media Platforms Digital Consumer Touchpoint Strategy
This slide covers the KPI dashboard for analyzing social media channels. It includes metrics such as social media followers, Facebook daily reach, Facebook engaged users and page impressions, etc. Present the topic in a bit more detail with this Dashboard For Tracking Social Media Platforms Digital Consumer Touchpoint Strategy. Use it as a tool for discussion and navigation on Dashboard For Tracking, Social Media Platforms. This template is free to edit as deemed fit for your organization. Therefore download it now
-
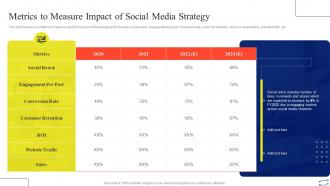 Metrics To Measure Impact Of Social Media Strategy Digital Marketing Strategies To Improve Sales
This slide focuses on metrics to measure impact of social media strategy which includes social reach, engagement per post, conversion rate, customer retention, return on investments, website traffic, etc. Present the topic in a bit more detail with this Metrics To Measure Impact Of Social Media Strategy Digital Marketing Strategies To Improve Sales. Use it as a tool for discussion and navigation on Engagement Per Post, Social Reach, Customer Retention, Website Traffic. This template is free to edit as deemed fit for your organization. Therefore download it now.
-
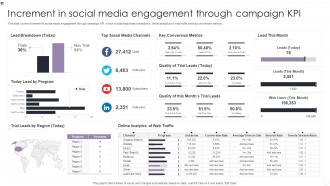 Increment In Social Media Engagement Through Campaign KPI
This slide covers increment in social media engagement through campaign KPI which include lead break breakdown, online analytics of web traffic and key conversion metrics. Presenting our well structured Increment In Social Media Engagement Through Campaign KPI. The topics discussed in this slide are Key Conversion Metrics, Lead Breakdown, Online Analytics. This is an instantly available PowerPoint presentation that can be edited conveniently. Download it right away and captivate your audience.


