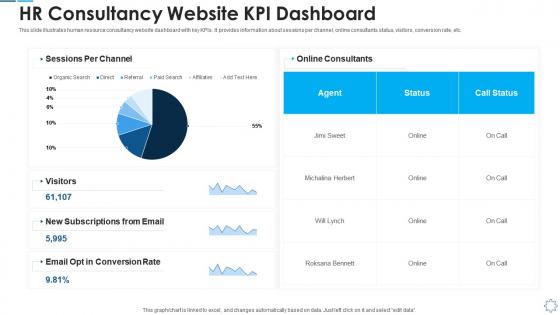
Powerpoint Templates and Google slides for Kpi Dashboard
Save Your Time and attract your audience with our fully editable PPT Templates and Slides.
-
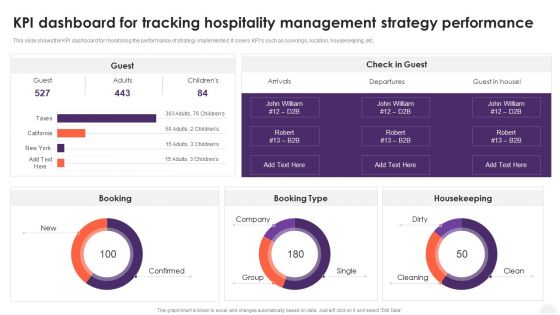 Kpi Dashboard For Tracking Hospitality Management Strategy Performance
This slide shows the KPI dashboard for monitoring the performance of strategy implemented. It covers KPIs such as bookings, location, housekeeping, etc. Deliver an outstanding presentation on the topic using this Kpi Dashboard For Tracking Hospitality Management Strategy Performance. Dispense information and present a thorough explanation of Dashboard, Management, Performance using the slides given. This template can be altered and personalized to fit your needs. It is also available for immediate download. So grab it now.
-
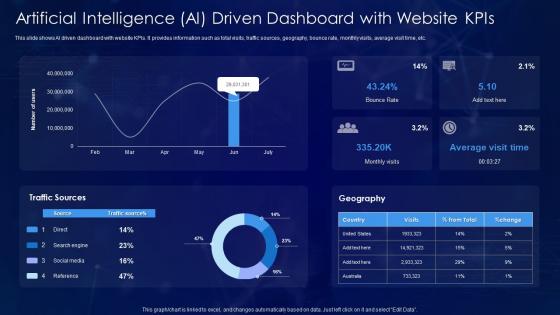 Artificial Intelligence Ai Driven Dashboard With Website Kpis
This slide shows AI driven dashboard with website KPIs. It provides information such as total visits, traffic sources, geography, bounce rate, monthly visits, average visit time, etc. Introducing our Artificial Intelligence Ai Driven Dashboard With Website Kpis set of slides. The topics discussed in these slides are Artificial, Intelligence, Dashboard. This is an immediately available PowerPoint presentation that can be conveniently customized. Download it and convince your audience.
-
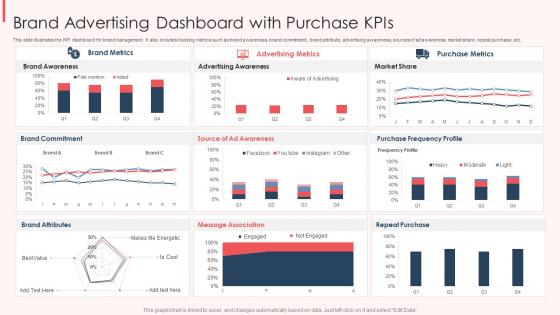 Brand Advertising Dashboard Snapshot With Purchase KPIS
This slide illustrates the KPI dashboard snapshot for brand management. It also includes tracking metrics such as brand awareness, brand commitment, brand attribute, advertising awareness, sources of ad awareness, market share, repeat purchase, etc. Introducing our Brand Advertising Dashboard With Purchase KPIS set of slides. The topics discussed in these slides are Brand Metrics, Advertising Metrics, Purchase Metrics. This is an immediately available PowerPoint presentation that can be conveniently customized. Download it and convince your audience.
-
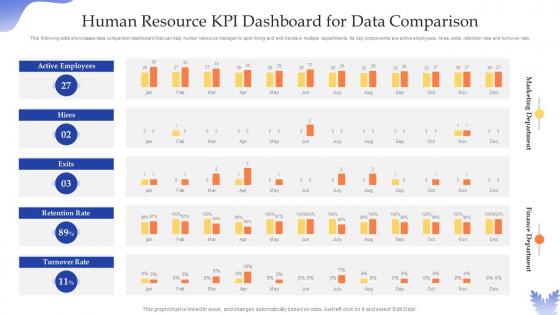 Human Resource KPI Dashboard For Data Comparison
This following slide showcases data comparison dashboard that can help human resource manager to spot hiring and exit trends in multiple departments. Its key components are active employees, hires, exits, retention rate and turnover rate. Presenting our well-structured Human Resource KPI Dashboard For Data Comparison. The topics discussed in this slide are Human Resource, KPI Dashboard, Data Comparison. This is an instantly available PowerPoint presentation that can be edited conveniently. Download it right away and captivate your audience.
-
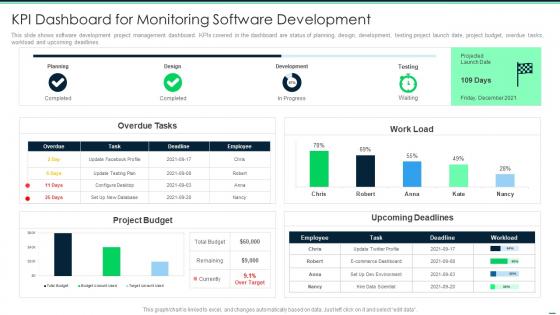 Devops tools kpi dashboard for monitoring software development
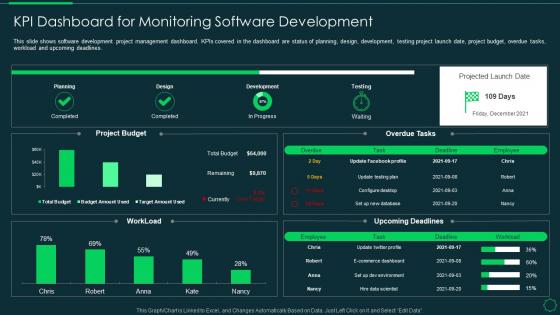
This slide shows software development project management dashboard. KPIs covered in the dashboard are status of planning, design, development, testing project launch date, project budget, overdue tasks, workload and upcoming deadlines. Deliver an outstanding presentation on the topic using this DevOps Tools KPI Dashboard For Monitoring Software Development. Dispense information and present a thorough explanation of Project Budget, Planning, Overdue Tasks, Work Load, Upcoming Deadlines using the slides given. This template can be altered and personalized to fit your needs. It is also available for immediate download. So grab it now.
-
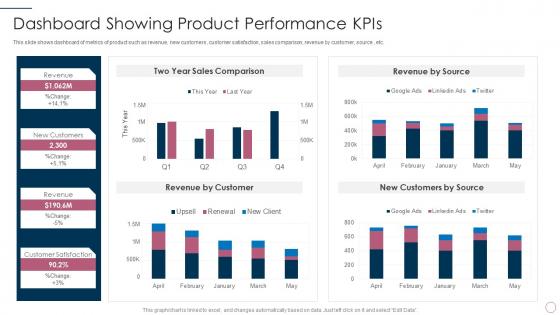 Dashboard showing product performance kpis it product management lifecycle
This slide shows dashboard of metrics of product such as revenue, new customers, customer satisfaction, sales comparison, revenue by customer, source , etc. Deliver an outstanding presentation on the topic using this Dashboard Showing Product Performance KPIS IT Product Management Lifecycle. Dispense information and present a thorough explanation of Sales Comparison, Revenue By Source using the slides given. This template can be altered and personalized to fit your needs. It is also available for immediate download. So grab it now.
-
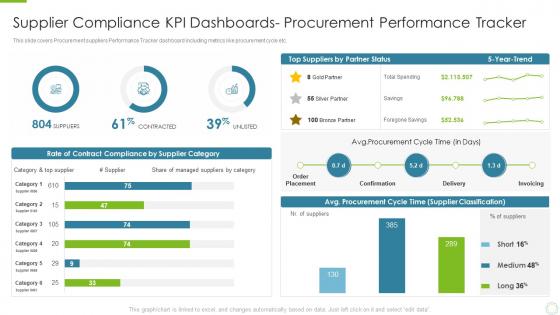 Supplier compliance kpi dashboards key strategies to build an effective supplier relationship
This slide covers Procurement suppliers Performance Tracker dashboard including metrics like procurement cycle etc. Deliver an outstanding presentation on the topic using this Supplier Compliance KPI Dashboards Key Strategies To Build An Effective Supplier Relationship. Dispense information and present a thorough explanation of Procurement Cycle Time, Supplier Classification using the slides given. This template can be altered and personalized to fit your needs. It is also available for immediate download. So grab it now.
-
 Supplier compliance kpi dashboards vendor relationship management strategies
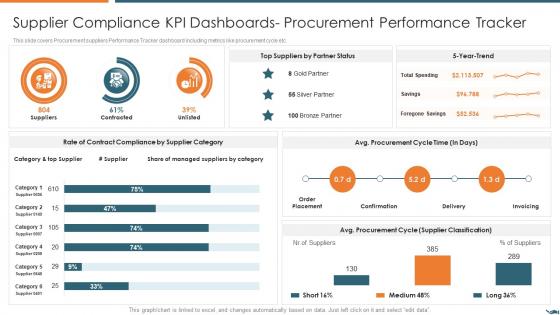
This slide covers Procurement suppliers Performance Tracker dashboard including metrics like procurement cycle etc. Deliver an outstanding presentation on the topic using this Supplier Compliance KPI Dashboards Vendor Relationship Management Strategies. Dispense information and present a thorough explanation of Supplier Compliance KPI Dashboards- Procurement Performance Tracker using the slides given. This template can be altered and personalized to fit your needs. It is also available for immediate download. So grab it now
-
 Business performance measuring kpi dashboard effective brand building strategy
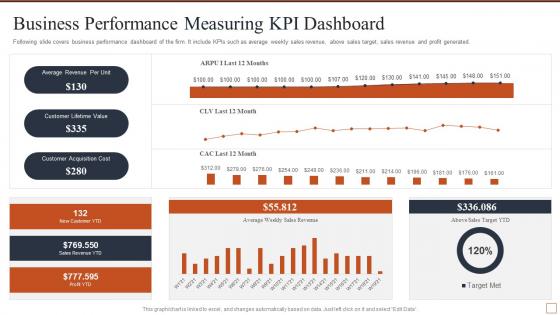
Following slide covers business performance dashboard of the firm. It include KPIs such as average weekly sales revenue, above sales target, sales revenue and profit generated. Deliver an outstanding presentation on the topic using this Business Performance Measuring KPI Dashboard Effective Brand Building Strategy. Dispense information and present a thorough explanation of Average Revenue Per Unit, Customer Lifetime Value, Customer Acquisition Cost using the slides given. This template can be altered and personalized to fit your needs. It is also available for immediate download. So grab it now.
-
 Campaign performance measuring kpi dashboard effective brand building strategy
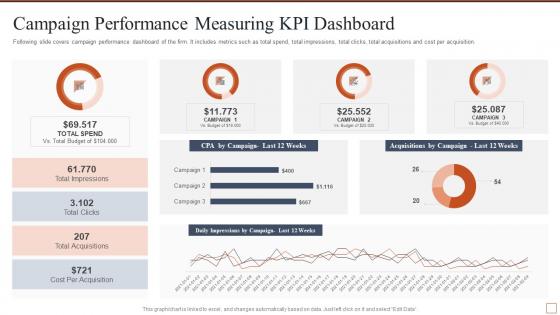
Present the topic in a bit more detail with this Campaign Performance Measuring KPI Dashboard Effective Brand Building Strategy. Use it as a tool for discussion and navigation on Campaign Performance Measuring KPI DashboardFollowing slide covers campaign performance dashboard of the firm. It includes metrics such as total spend, total impressions, total clicks, total acquisitions and cost per acquisition. . This template is free to edit as deemed fit for your organization. Therefore download it now.
-
 Kpi dashboard to monitor sales opportunities improving planning segmentation
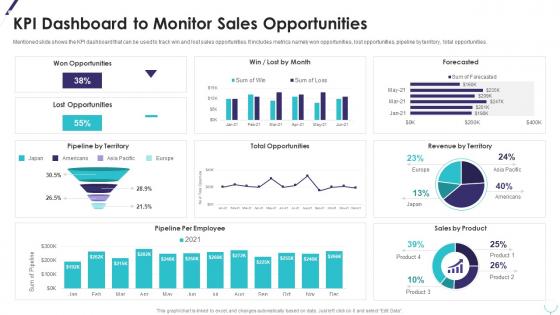
Mentioned slide shows the KPI dashboard that can be used to track win and lost sales opportunities. It includes metrics namely won opportunities, lost opportunities, pipeline by territory, total opportunities. Deliver an outstanding presentation on the topic using this KPI Dashboard To Monitor Sales Opportunities Improving Planning Segmentation. Dispense information and present a thorough explanation of Won Opportunities, Lost Opportunities, Pipeline By Territory, Total Opportunities, Revenue By Territory using the slides given. This template can be altered and personalized to fit your needs. It is also available for immediate download. So grab it now.
-
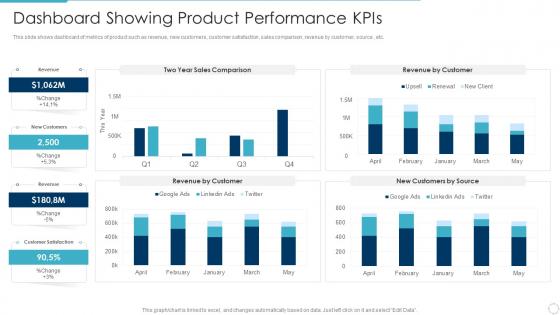 Dashboard showing product performance kpis implementing product lifecycle
This slide shows dashboard of metrics of product such as revenue, new customers, customer satisfaction, sales comparison, revenue by customer, source , etc. Present the topic in a bit more detail with this Dashboard Showing Product Performance KPIS Implementing Product Lifecycle. Use it as a tool for discussion and navigation on Revenue, New Customers, Customer Satisfaction, Two Year Sales Comparison, Revenue By Customer. This template is free to edit as deemed fit for your organization. Therefore download it now.
-
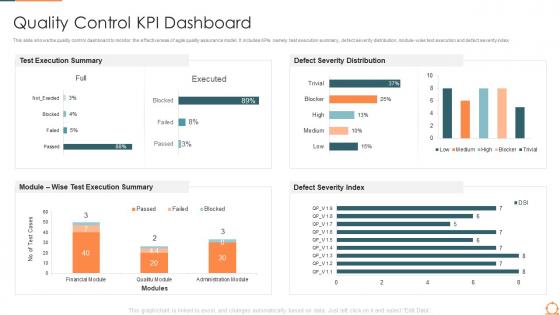 Quality control kpi dashboard agile quality assurance process
This slide shows the quality control dashboard to monitor the effectiveness of agile quality assurance model. It includes KPIs namely test execution summary, defect severity distribution, module wise text execution and defect severity index. Deliver an outstanding presentation on the topic using this Quality Control KPI Dashboard Agile Quality Assurance Process. Dispense information and present a thorough explanation of Test Execution, Defect Severity Index using the slides given. This template can be altered and personalized to fit your needs. It is also available for immediate download. So grab it now.
-
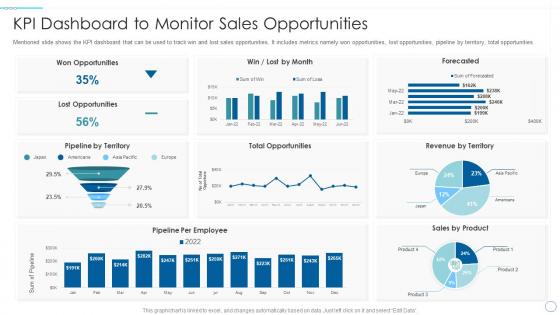 Understanding market dynamics purchasing decisions kpi dashboard monitor sales opportunities
Mentioned slide shows the KPI dashboard that can be used to track win and lost sales opportunities. It includes metrics namely won opportunities, lost opportunities, pipeline by territory, total opportunities. Deliver an outstanding presentation on the topic using this Understanding Market Dynamics Purchasing Decisions Kpi Dashboard Monitor Sales Opportunities. Dispense information and present a thorough explanation of KPI Dashboard To Monitor Sales Opportunities using the slides given. This template can be altered and personalized to fit your needs. It is also available for immediate download. So grab it now.
-
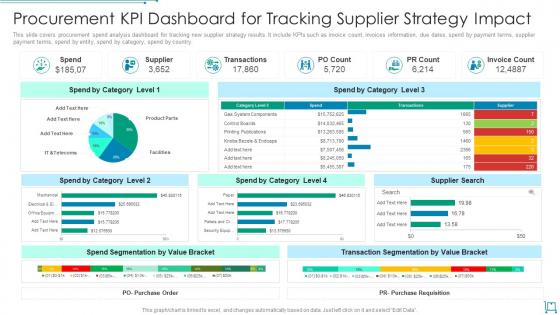 Procurement kpi dashboard for tracking supplier strategy impact
This slide covers procurement spend analysis dashboard for tracking new supplier strategy results. It include KPIs such as invoice count, invoices information, due dates, spend by payment terms, supplier payment terms, spend by entity, spend by category, spend by country. Introducing our Procurement KPI Dashboard For Tracking Supplier Strategy Impact set of slides. The topics discussed in these slides are Transactions, Supplier, Purchase Order. This is an immediately available PowerPoint presentation that can be conveniently customized. Download it and convince your audience.
-
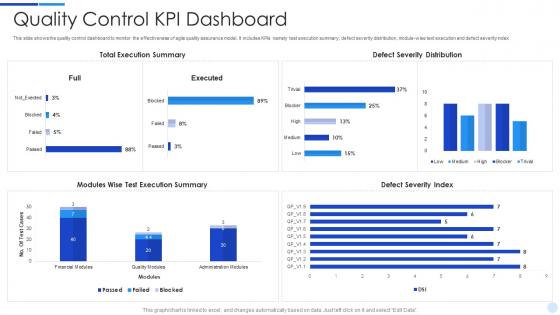 Quality control kpi dashboard quality assurance processes in agile environment
This slide shows the quality control dashboard to monitor the effectiveness of agile quality assurance model. It includes KPIs namely test execution summary, defect severity distribution, module wise text execution and defect severity index. Present the topic in a bit more detail with this Quality Control KPi Dashboard Quality Assurance Processes In Agile Environment. Use it as a tool for discussion and navigation on Quality Control KPi Dashboard. This template is free to edit as deemed fit for your organization. Therefore download it now.
-
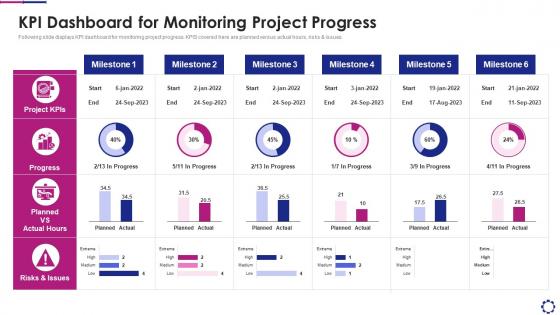 Kpi dashboard for monitoring project progress introducing devops pipeline within software
Following slide displays KPI dashboard for monitoring project progress. KPIS covered here are planned versus actual hours, risks and issues. Present the topic in a bit more detail with this KPI Dashboard For Monitoring Project Progress Introducing Devops Pipeline Within Software. Use it as a tool for discussion and navigation on KPI Dashboard For Monitoring Project Progress. This template is free to edit as deemed fit for your organization. Therefore download it now.
-
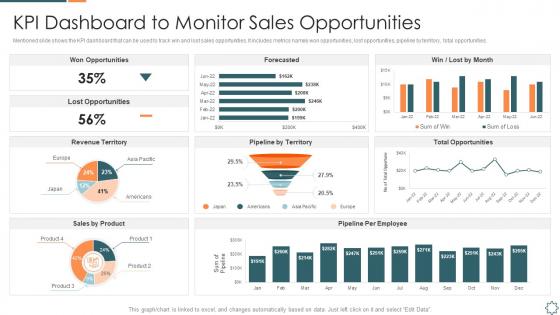 Introducing a new sales enablement kpi dashboard to monitor sales opportunities
Mentioned slide shows the KPI dashboard that can be used to track win and lost sales opportunities. It includes metrics namely won opportunities, lost opportunities, pipeline by territory, total opportunities. Deliver an outstanding presentation on the topic using this Introducing A New Sales Enablement Kpi Dashboard To Monitor Sales Opportunities. Dispense information and present a thorough explanation of KPI Dashboard To Monitor Sales Opportunities using the slides given. This template can be altered and personalized to fit your needs. It is also available for immediate download. So grab it now.
-
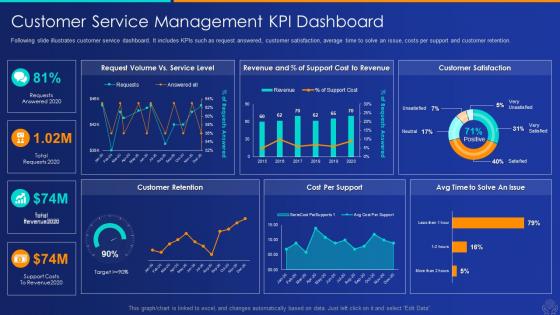 Artificial intelligence and machine learning customer kpi dashboard snapshot
Following slide illustrates customer service dashboard. It includes KPIs such as request answered, customer satisfaction, average time to solve an issue, costs per support and customer retention. Present the topic in a bit more detail with this Artificial Intelligence And Machine Learning Customer KPI Dashboard Snapshot Use it as a tool for discussion and navigation on Customer Service Management KPI Dashboard This template is free to edit as deemed fit for your organization. Therefore download it now.
-
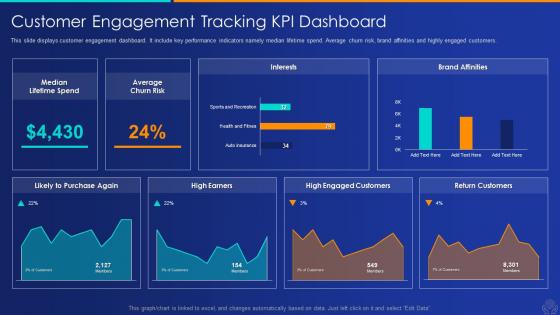 Customer kpi dashboard artificial intelligence and machine learning
This slide displays customer engagement dashboard. It include key performance indicators namely median lifetime spend. Average churn risk, brand affinities and highly engaged customers.Present the topic in a bit more detail with this Customer KPI Dashboard Artificial Intelligence And Machine Learning Use it as a tool for discussion and navigation on Median Lifetime Spend, Return Customers, High Engaged Customers This template is free to edit as deemed fit for your organization. Therefore download it now.
-
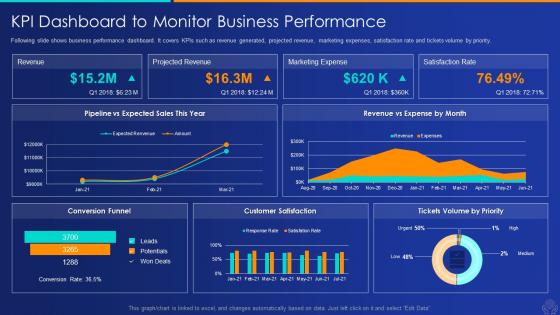 Kpi dashboard to monitor performance artificial intelligence and machine learning
Following slide shows business performance dashboard. It covers KPIs such as revenue generated, projected revenue, marketing expenses, satisfaction rate and tickets volume by priority.Present the topic in a bit more detail with this KPI Dashboard To Monitor Performance Artificial Intelligence And Machine Learning Use it as a tool for discussion and navigation on Projected Revenue, Marketing Expense, Satisfaction Rate This template is free to edit as deemed fit for your organization. Therefore download it now.
-
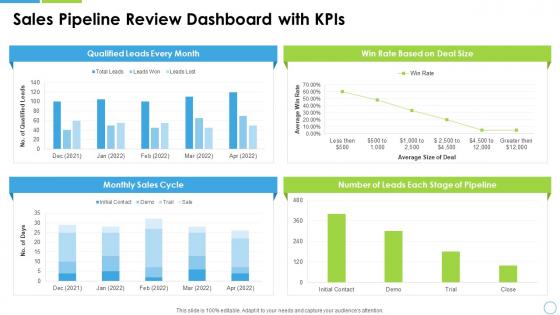 Sales pipeline review dashboard snapshot with kpis
Introducing our Sales Pipeline Review Dashboard Snapshot With KPIs set of slides. The topics discussed in these slides are Sales Pipeline Review Dashboard With KPIs. This is an immediately available PowerPoint presentation that can be conveniently customized. Download it and convince your audience.
-
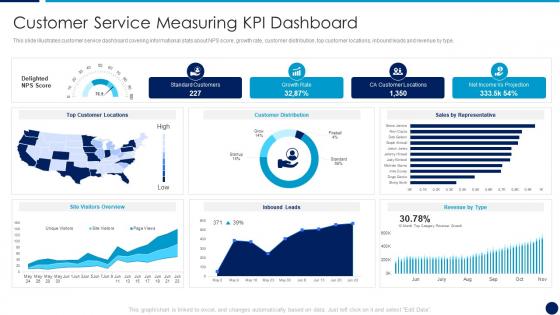 It service integration after merger customer service measuring kpi dashboard
This slide illustrates customer service dashboard covering informational stats about NPS score, growth rate, customer distribution, top customer locations, inbound leads and revenue by type.Present the topic in a bit more detail with this IT Service Integration After Merger Customer Service Measuring KPI Dashboard Use it as a tool for discussion and navigation on Customer Service Measuring KPI Dashboard This template is free to edit as deemed fit for your organization. Therefore download it now.
-
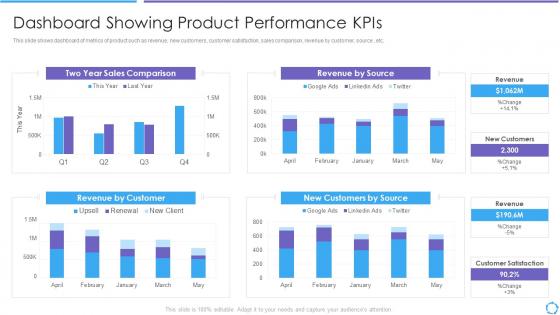 Developing product lifecycle dashboard showing product performance kpis
This slide shows dashboard of metrics of product such as revenue, new customers, customer satisfaction, sales comparison, revenue by customer, source , etc. Present the topic in a bit more detail with this Developing Product Lifecycle Dashboard Showing Product Performance KPIs. Use it as a tool for discussion and navigation on Two Year Sales Comparison, Revenue Source, Revenue Customer, New Customers Source, Customer Satisfaction. This template is free to edit as deemed fit for your organization. Therefore download it now.
-
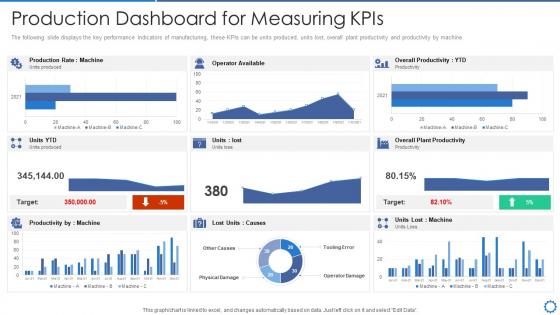 Manufacturing operation best practices dashboard snapshot for measuring kpis
The following slide displays the key performance Indicators of manufacturing, these KPIs can be units produced, units lost, overall plant productivity and productivity by machine Present the topic in a bit more detail with this Manufacturing Operation Best Practices Dashboard For Measuring Kpis. Use it as a tool for discussion and navigation on Production Dashboard Snapshot For Measuring Kpis. This template is free to edit as deemed fit for your organization. Therefore download it now.
-
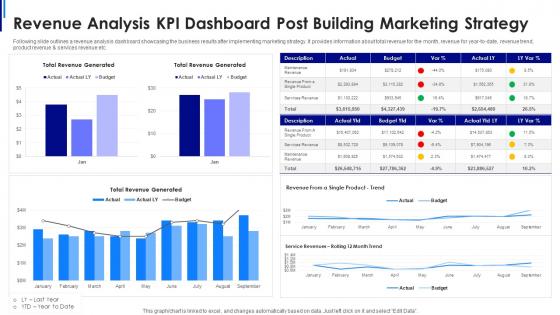 Revenue analysis kpi dashboard post building marketing strategy
Following slide outlines a revenue analysis dashboard showcasing the business results after implementing marketing strategy. It provides information about total revenue for the month, revenue for year to date, revenue trend, product revenue and services revenue etc. Presenting our well structured Revenue Analysis KPI Dashboard Post Building Marketing Strategy. The topics discussed in this slide are Service Revenues, Single Product, Budget. This is an instantly available PowerPoint presentation that can be edited conveniently. Download it right away and captivate your audience.
-
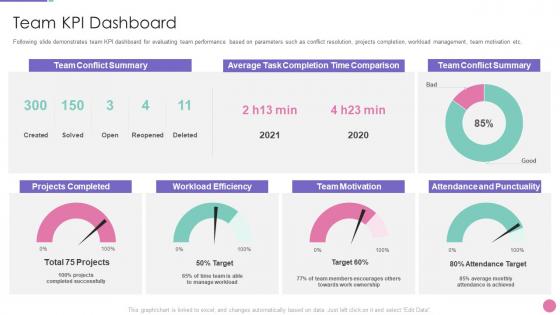 Strategic approach to develop organization kpi dashboard
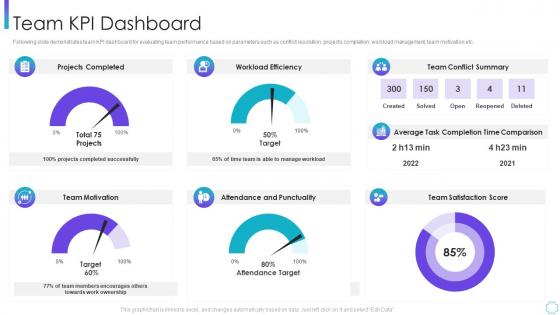
Following slide demonstrates team KPI dashboard for evaluating team performance based on parameters such as conflict resolution, projects completion, workload management, team motivation etc. Present the topic in a bit more detail with this Strategic Approach To Develop Organization Kpi Dashboard. Use it as a tool for discussion and navigation on Team Kpi Dashboard. This template is free to edit as deemed fit for your organization. Therefore download it now.
-
 Team kpi dashboard corporate program improving work team productivity
Following slide demonstrates team KPI dashboard for evaluating team performance based on parameters such as conflict resolution, projects completion, workload management, team motivation etc. Deliver an outstanding presentation on the topic using this Team Kpi Dashboard Corporate Program Improving Work Team Productivity. Dispense information and present a thorough explanation of Team KPI Dashboard using the slides given. This template can be altered and personalized to fit your needs. It is also available for immediate download. So grab it now.
-
 Effective real estate marketing campaign property management kpi dashboard
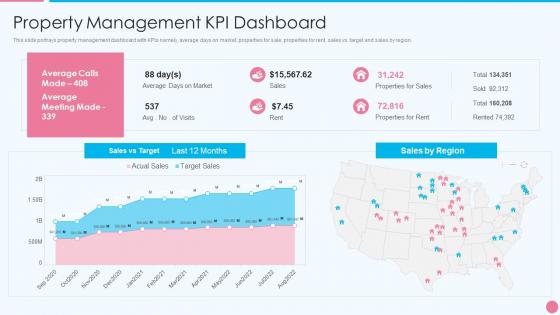
This slide portrays property management dashboard with KPIs namely, average days on market, properties for sale, properties for rent, sales vs. target and sales by region. Present the topic in a bit more detail with this Effective Real Estate Marketing Campaign Property Management KPI Dashboard. Use it as a tool for discussion and navigation on Property Management KPI Dashboard. This template is free to edit as deemed fit for your organization. Therefore download it now.
-
 Introducing devops tools for in time product release it kpi dashboard monitoring software development
This slide shows software development project management dashboard. KPIs covered in the dashboard are status of planning, design, development, testing project launch date, project budget, overdue tasks, workload and upcoming deadlines. Present the topic in a bit more detail with this Introducing Devops Tools For In Time Product Release It Kpi Dashboard Monitoring Software Development. Use it as a tool for discussion and navigation on KPI Dashboard For Monitoring Software Development. This template is free to edit as deemed fit for your organization. Therefore download it now.
-
 Commencement of an it project project management kpi dashboard
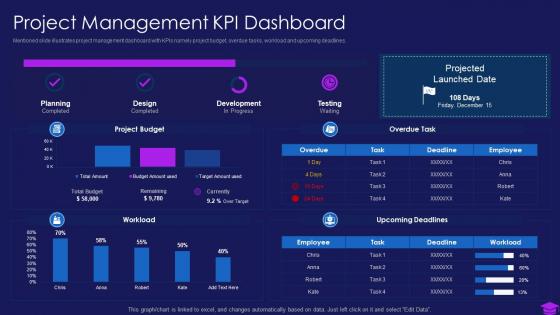
Mentioned slide illustrates project management dashboard with KPIs namely project budget, overdue tasks, workload and upcoming deadlines. Deliver an outstanding presentation on the topic using this Commencement Of An IT Project Project Management KPI Dashboard. Dispense information and present a thorough explanation of Planning, Design, Development, Projected Launched Date, Testing, Overdue Task using the slides given. This template can be altered and personalized to fit your needs. It is also available for immediate download. So grab it now.
-
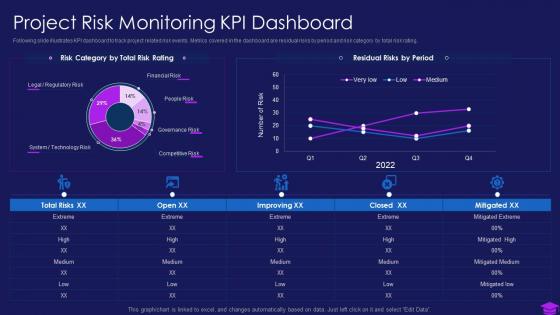 Commencement of an it project project risk monitoring kpi dashboard
Following slide illustrates KPI dashboard to track project related risk events. Metrics covered in the dashboard are residual risks by period and risk category by total risk rating. Present the topic in a bit more detail with this Commencement Of An IT Project Project Risk Monitoring KPI Dashboard. Use it as a tool for discussion and navigation on Risk Category, Total Risk Rating, Residual Risks Period. This template is free to edit as deemed fit for your organization. Therefore download it now.
-
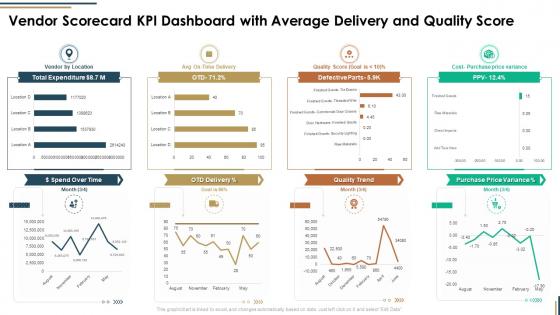 Vendor scorecard kpi dashboard with average delivery and quality score ppt file
Deliver an outstanding presentation on the topic using this Vendor Scorecard KPI Dashboard With Average Delivery And Quality Score Ppt File. Dispense information and present a thorough explanation of Quality Score, Cost Purchase Price, Quality Trend using the slides given. This template can be altered and personalized to fit your needs. It is also available for immediate download. So grab it now.
-
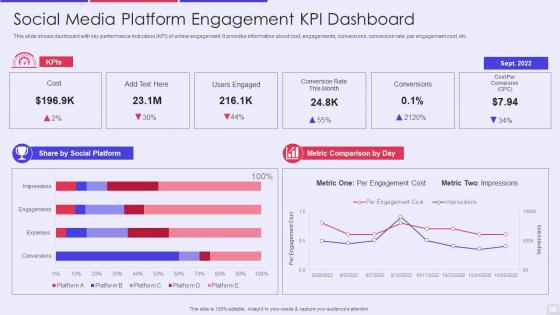 Social media platform engagement kpi dashboard
Presenting our well structured Social Media Platform Engagement Kpi Dashboard. The topics discussed in this slide are Social Media Platform Engagement KPI Dashboard. This is an instantly available PowerPoint presentation that can be edited conveniently. Download it right away and captivate your audience.
-
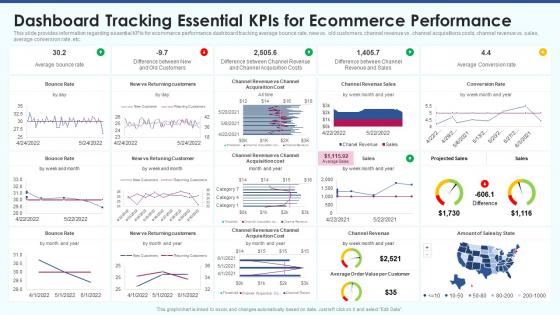 Ecommerce strategy playbook dashboard tracking essential kpis for ecommerce performance
This slide provides information regarding essential KPIs for ecommerce performance dashboard tracking average bounce rate, new vs. old customers, channel revenue vs. channel acquisitions costs, channel revenue vs. sales, average conversion rate, etc. Deliver an outstanding presentation on the topic using this Ecommerce Strategy Playbook Dashboard Tracking Essential KPIS For Ecommerce Performance. Dispense information and present a thorough explanation of Bounce Rate, Retuning Customer, Channel Revenue, Projected Sales using the slides given. This template can be altered and personalized to fit your needs. It is also available for immediate download. So grab it now.
-
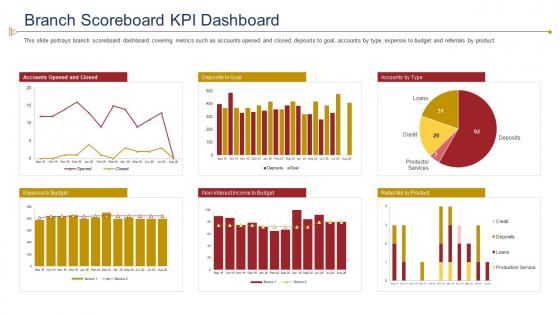 Introducing mobile financial services in developing countries branch scoreboard kpi dashboard
This slide portrays branch scoreboard dashboard covering metrics such as accounts opened and closed, deposits to goal, accounts by type, expense to budget and referrals by product. Deliver an outstanding presentation on the topic using this Introducing Mobile Financial Services In Developing Countries Branch Scoreboard KPI Dashboard. Dispense information and present a thorough explanation of Accounts Opened And Closed, Deposits To Goal, Accounts, Expense To Budget, Non Interest Income To Budget, Referrals Product using the slides given. This template can be altered and personalized to fit your needs. It is also available for immediate download. So grab it now.
-
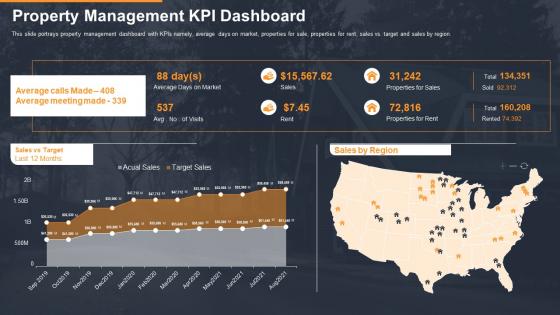 Developing a marketing campaign for property selling property management kpi dashboard
This slide portrays property management dashboard with KPIs namely, average days on market, properties for sale, properties for rent, sales vs. target and sales by region. Deliver an outstanding presentation on the topic using this Developing A Marketing Campaign For Property Selling Property Management KPI Dashboard. Dispense information and present a thorough explanation of Sales Vs Target, Average Days Market, Rent, Properties Rent, Properties Sales using the slides given. This template can be altered and personalized to fit your needs. It is also available for immediate download. So grab it now.
-
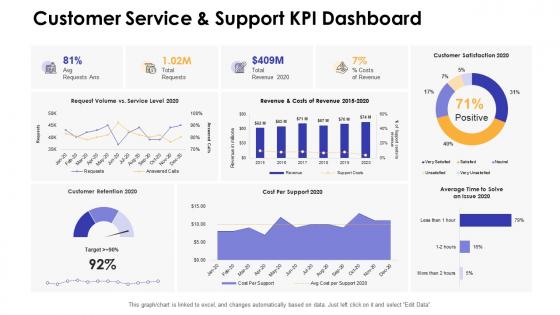 Customer service and support kpi dashboards by function
Present the topic in a bit more detail with this Customer Service And Support Kpi Dashboards By Function. Use it as a tool for discussion and navigation on Customer, Service, Dashboard. This template is free to edit as deemed fit for your organization. Therefore download it now.
-
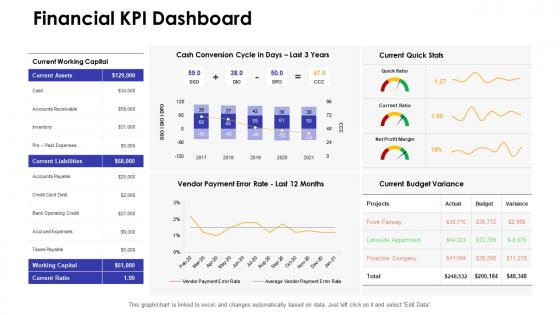 Financial kpi dashboard dashboards by function
Deliver an outstanding presentation on the topic using this Financial Kpi Dashboard Dashboards By Function. Dispense information and present a thorough explanation of Financial Kpi Dashboard using the slides given. This template can be altered and personalized to fit your needs. It is also available for immediate download. So grab it now.
-
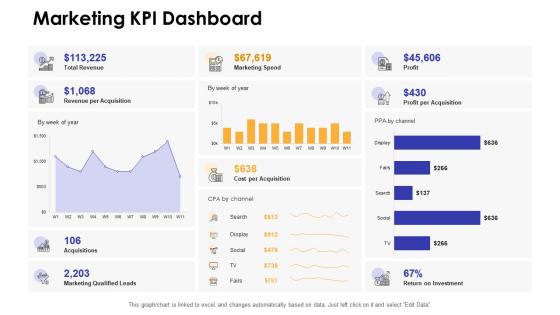 Marketing kpi dashboard dashboards by function
Deliver an outstanding presentation on the topic using this Marketing Kpi Dashboard Dashboards By Function. Dispense information and present a thorough explanation of Marketing Kpi Dashboardusing the slides given. This template can be altered and personalized to fit your needs. It is also available for immediate download. So grab it now.
-
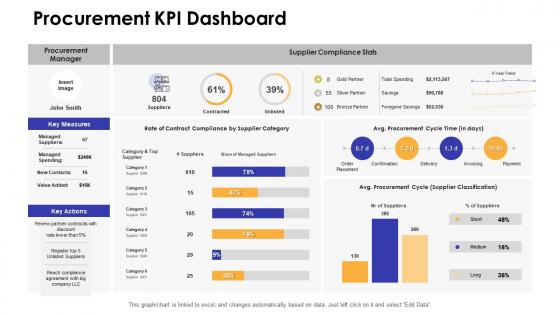 Procurement kpi dashboard dashboards by function
Present the topic in a bit more detail with this Procurement Kpi Dashboard Dashboards By Function. Use it as a tool for discussion and navigation on Procurement Kpi Dashboard. This template is free to edit as deemed fit for your organization. Therefore download it now.
-
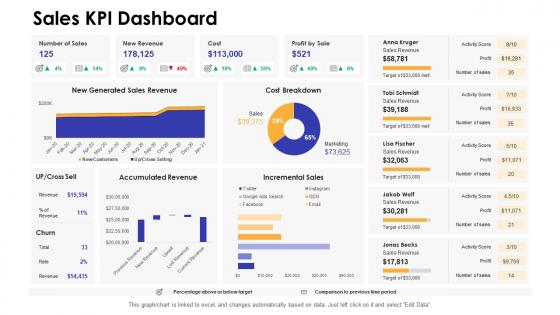 Sales kpi dashboard dashboards by function
Present the topic in a bit more detail with this Sales Kpi Dashboard Dashboards By Function. Use it as a tool for discussion and navigation on Sales Kpi Dashboard. This template is free to edit as deemed fit for your organization. Therefore download it now.
-
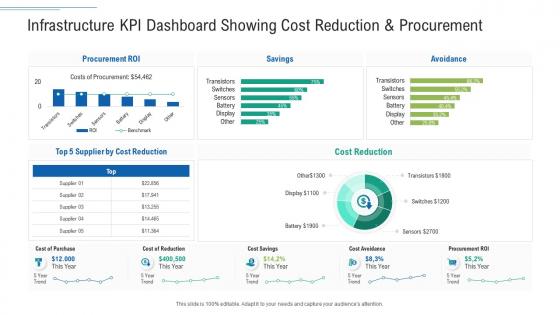 Infrastructure kpi dashboard infrastructure planning and facilities management
Deliver an outstanding presentation on the topic using this Infrastructure KPI Dashboard Infrastructure Planning And Facilities Management. Dispense information and present a thorough explanation of Cost Reduction, Purchase using the slides given. This template can be altered and personalized to fit your needs. It is also available for immediate download. So grab it now.
-
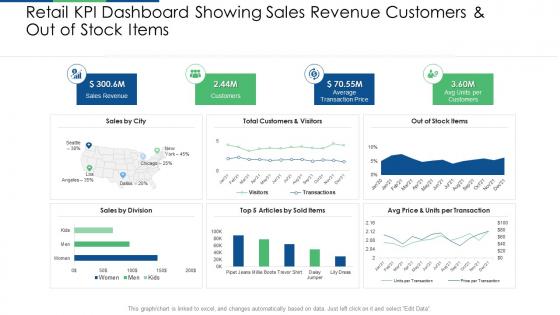 Retail industry evaluation retail kpi dashboard showing sales revenue
Present the topic in a bit more detail with this Retail Industry Evaluation Retail KPI Dashboard Showing Sales Revenue. Use it as a tool for discussion and navigation on Sales, Customers, Stock, Average, Price. This template is free to edit as deemed fit for your organization. Therefore download it now.
-
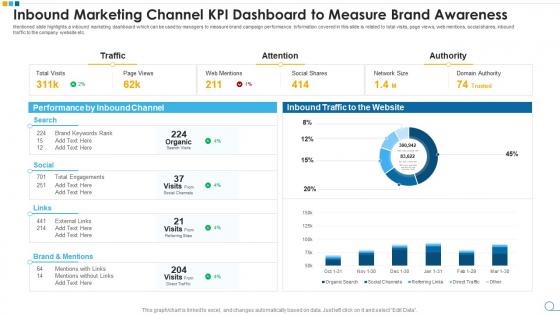 Inbound marketing channel kpi dashboard to measure brand awareness
Presenting our well structured Inbound Marketing Channel KPI Dashboard To Measure Brand Awareness. The topics discussed in this slide are Inbound Marketing Channel KPI Dashboard To Measure Brand Awareness. This is an instantly available PowerPoint presentation that can be edited conveniently. Download it right away and captivate your audience.
-
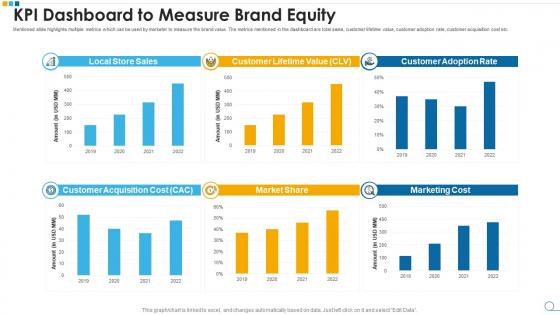 Kpi dashboard to measure brand equity
Presenting our well structured KPI Dashboard To Measure Brand Equity. The topics discussed in this slide are KPI Dashboard To Measure Brand Equity. This is an instantly available PowerPoint presentation that can be edited conveniently. Download it right away and captivate your audience.
-
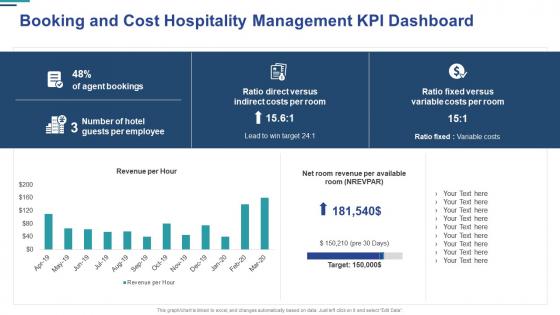 Booking and cost hospitality management kpi dashboard
Present the topic in a bit more detail with this Booking And Cost Hospitality Management KPI Dashboard. Use it as a tool for discussion and navigation on Booking And Cost Hospitality Management KPI Dashboard. This template is free to edit as deemed fit for your organization. Therefore download it now.
-
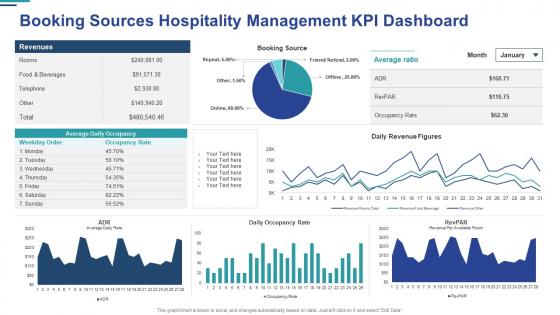 Booking sources hospitality management kpi dashboard
Deliver an outstanding presentation on the topic using this Booking Sources Hospitality Management KPI Dashboard. Dispense information and present a thorough explanation of Average, Revenues, Source using the slides given. This template can be altered and personalized to fit your needs. It is also available for immediate download. So grab it now.
-
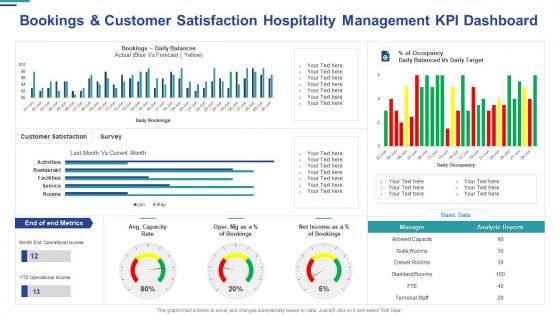 Bookings and customer satisfaction hospitality management kpi dashboard
Present the topic in a bit more detail with this Bookings And Customer Satisfaction Hospitality Management KPI Dashboard. Use it as a tool for discussion and navigation on Bookings And Customer Satisfaction Hospitality Management KPI Dashboard. This template is free to edit as deemed fit for your organization. Therefore download it now.
-
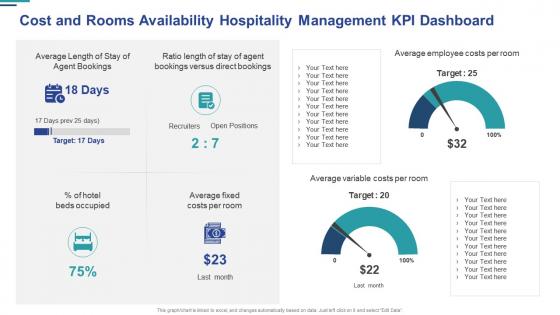 Cost and rooms availability hospitality management kpi dashboard
Deliver an outstanding presentation on the topic using this Cost And Rooms Availability Hospitality Management KPI Dashboard. Dispense information and present a thorough explanation of Average, Costs, Recruiters, Target using the slides given. This template can be altered and personalized to fit your needs. It is also available for immediate download. So grab it now.
-
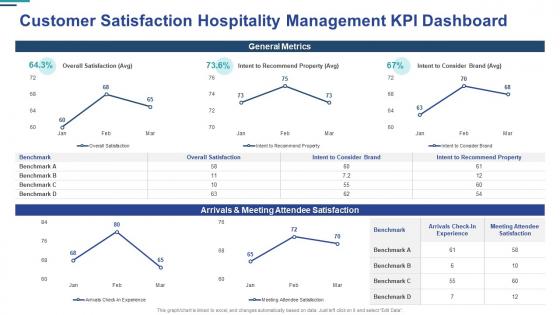 Customer satisfaction hospitality management kpi dashboard
Present the topic in a bit more detail with this Customer Satisfaction Hospitality Management KPI Dashboard. Use it as a tool for discussion and navigation on Customer Satisfaction Hospitality Management KPI Dashboard. This template is free to edit as deemed fit for your organization. Therefore download it now.
-
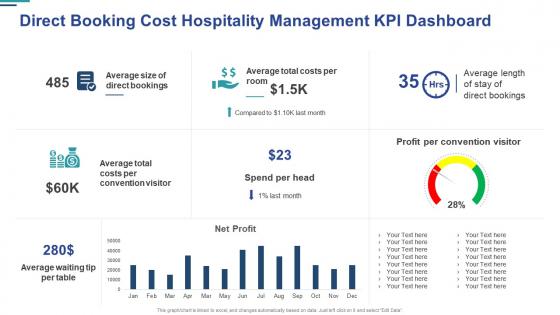 Direct booking cost hospitality management kpi dashboard
Deliver an outstanding presentation on the topic using this Direct Booking Cost Hospitality Management KPI Dashboard. Dispense information and present a thorough explanation of Average, Costs, Average, Profit using the slides given. This template can be altered and personalized to fit your needs. It is also available for immediate download. So grab it now.
-
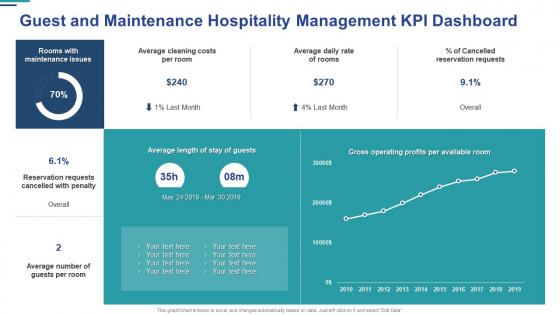 Guest and maintenance hospitality management kpi dashboard
Deliver an outstanding presentation on the topic using this Guest And Maintenance Hospitality Management KPI Dashboard. Dispense information and present a thorough explanation of Average, Costs, Rate using the slides given. This template can be altered and personalized to fit your needs. It is also available for immediate download. So grab it now.
-
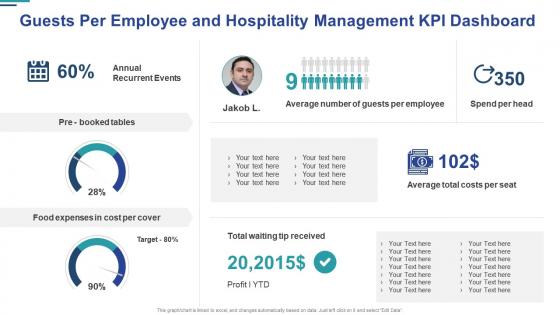 Guests per employee and hospitality management kpi dashboard
Present the topic in a bit more detail with this Guests Per Employee And Hospitality Management KPI Dashboard. Use it as a tool for discussion and navigation on Average, Target, Expenses. This template is free to edit as deemed fit for your organization. Therefore download it now.
-
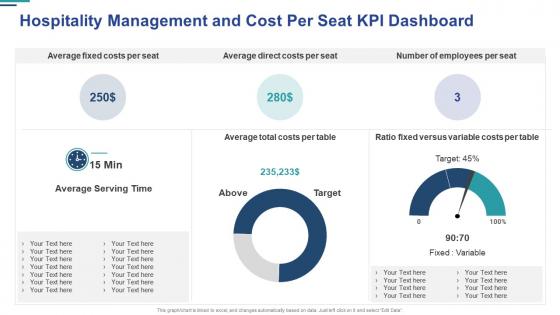 Hospitality management and cost per seat kpi dashboard
Deliver an outstanding presentation on the topic using this Hospitality Management And Cost Per Seat KPI Dashboard. Dispense information and present a thorough explanation of Costs, Average, Target using the slides given. This template can be altered and personalized to fit your needs. It is also available for immediate download. So grab it now.
-
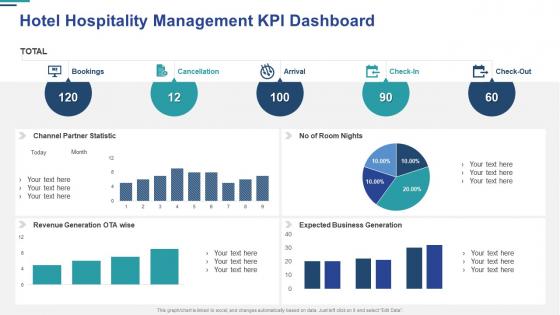 Hotel hospitality management kpi dashboard
Deliver an outstanding presentation on the topic using this Hotel Hospitality Management KPI Dashboard. Dispense information and present a thorough explanation of Hotel Hospitality Management KPI Dashboard using the slides given. This template can be altered and personalized to fit your needs. It is also available for immediate download. So grab it now.
-
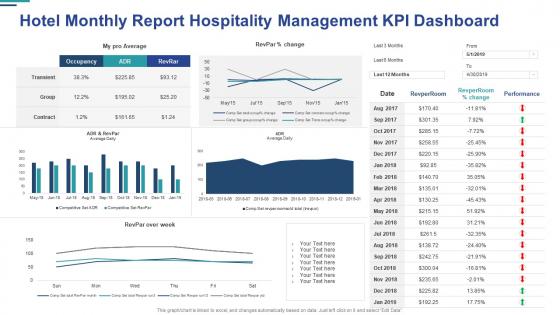 Hotel monthly report hospitality management kpi dashboard
Present the topic in a bit more detail with this Hotel Monthly Report Hospitality Management KPI Dashboard. Use it as a tool for discussion and navigation on Hotel Monthly Report Hospitality Management KPI Dashboard. This template is free to edit as deemed fit for your organization. Therefore download it now.
-
 National and international guests hospitality management kpi dashboard
Deliver an outstanding presentation on the topic using this National And International Guests Hospitality Management KPI Dashboard. Dispense information and present a thorough explanation of National And International Guests Hospitality Management KPI Dashboard using the slides given. This template can be altered and personalized to fit your needs. It is also available for immediate download. So grab it now.
-
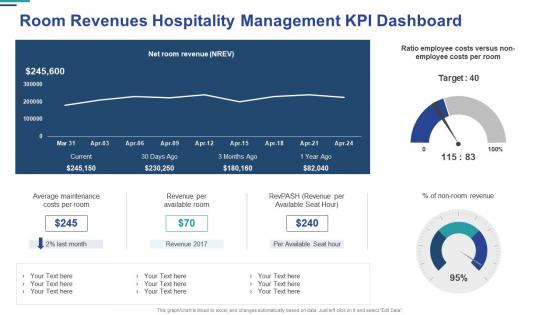 Room revenues hospitality management kpi dashboard
Present the topic in a bit more detail with this Room Revenues Hospitality Management KPI Dashboard. Use it as a tool for discussion and navigation on Revenue, Average, Costs. This template is free to edit as deemed fit for your organization. Therefore download it now.


